Anand Rathi - Dabur India Limited
Anand Rathi - Dabur India Limited
Anand Rathi - Dabur India Limited
- No tags were found...

You also want an ePaper? Increase the reach of your titles
YUMPU automatically turns print PDFs into web optimized ePapers that Google loves.
December, 2009<strong>Anand</strong> <strong>Rathi</strong> - <strong>India</strong> Consumer ConferenceMumbai, <strong>India</strong>A trust of over 125 years1
Index<strong>Dabur</strong> <strong>India</strong>-IntroductionFMCG Industry ScenarioBusiness OverviewBrand/Growth StrategyFinancialsA trust of over 125 years2
<strong>Dabur</strong>: Largest <strong>India</strong>n HPC CompanyHighlightsEight Billion Rupee Brands Herbal & NaturalPortfolio 4,500 Distributors in<strong>India</strong> Retail Reach 2.8 mn 5 Umbrella Brands 350+ products 4,200 employees 15 ManufacturingLocations 20% contribution fromoverseas marketsListed in Forbes’ 200Best Under-A-BillionCompanies ListRanked 60th MostValuable <strong>India</strong>n Companyin 2009 in BusinessToday's BT-500 ListRanked 28th in ET-Brand Equity MostTrusted Brands 2009list.A trust of over 125 years3
Strong FinancialsSalesKey Financials H1FY10in Rs. millionCAGR - 18%17,56520,80323,96328,341Market CapCash FlowUS$2.9 billion^Rs. 2.6 billion12,35614,170EBITDA Margin 19.5%PAT/Sales 14.4%RoNW 48.4%FY04 FY05 FY06 FY07 FY08 FY09^As of December 15, 2009in Rs. millionNet Profitin %EBITDA Margin (in %)CAGR - 30%2,8173,3293,91317.118.118.5 18.32,14215.31,0651,55813.3FY04 FY05 FY06 FY07 FY08 FY09FY04 FY05 FY06 FY07 FY08 FY09A trust of over 125 years4
FY09: Highest Organic Growth in the DecadeY-o-Y growth (%)Sales and Growth Rates (Y-o-Y)13.8% 12.0% 9.2% 7.0% -3.8% 14.7% 24.0% 18.4% 15.2% 18.3%Sales in Rs. millionNote: Balsara acquisition added 10% to topline in FY06Sales show a decline in FY04 on account of de-merger of Pharma businessA trust of over 125 years5
Manufacturing Locations - <strong>India</strong>New units being set up at Baddiand Uttaranchal in 2009-10 forcapacity expansionJammu (J&K)Baddi (HP)Newai (Raj)UttaranchalSahibabad (UP)One of our largestmanufacturingfacilities at Baddi, HPSilvassaSillguri (WB)Katni, (MP)Manufacturing FacilitiesMulti line integrated facility atRudrapur, UttaranchalA trust of over 125 years6
Manufacturing Locations - InternationalNepalNigeriaEgyptDubaiRAKBangladeshKey marketsManufacturing FacilitiesA trust of over 125 years7
Research & Development Strengths<strong>Dabur</strong> introduced more than 20 new products/variants during FY09New Product DevelopmentAyurvedic MedicinesCollaboration with govtagenciesPersonal CareFoodsHome CareOTC HealthcareTeam of 50 scientistsincluding Ayurvedic doctors,Pharmacists, Agro-nomists,Botanists, Tissue Culturespecialists, etcEnvironmental InitiativesAgronomy InitiativesEffluent ManagementProtecting endangered herbsAlternate sources of energyTechnical assistance to farmersCarbon footprint mappingContract cultivation of herbsGreen House at NepalA trust of over 125 years8
Distribution Network : Route to MarketFactoryD.C.StockistSuperstockistWholesalersSemi WholesalersSubstockistInstitutionsModernTradeRetail TradeRetail TradeShoppers & Consumers<strong>Dabur</strong> reaches a total of 2.8 mn retail outlets; Direct reach of 0.8 mn outletsA trust of over 125 years9
<strong>Dabur</strong>: Strong Presence in FMCG CategoriesCategoryPositionMarket ShareKey BrandsHair Care312%<strong>Dabur</strong> Amla hair Oil, Vatika hair oil &Vatika ShampoosOral Care313%Red toothpaste, Babool, Meswak, RedtoothpowderSkin Care3 7%<strong>Dabur</strong> Gulabari, Fem, <strong>Dabur</strong> UvedaOTC Health110%<strong>Dabur</strong> Chyawanprash, Asavs, Honitus& Other OTC productsFruit Juices1 50%Real Fruit Juices, Real ActivHair care includes Hair Oils & Shampoos;Oral care includes Toothpastes & Toothpowder;OTC health includes Over The Counter categories of Health Supplements, Digestives, Ayurvedic Healthcare etc;Skin care includes moisturizers, face cleaning, lightening, anti ageing & other skin care productsA trust of over 125 years10
FMCG Sector: Current ScenarioHighlightsFMCG space showing steady growth• Economic downturn did not impact FMCG;most categories witnessing double digitgrowth• Significant increase in agri commodityrealizations and investments inagriculture/rural economy boosted ruralgrowth• No signs of any significant consumer downtrading so far.100959085807519 19212620 2017141916 16302017100• Modern Trade showing signs of revival• Growth to be driven by penetration,innovation and value proposition'Jul-08'Aug-08'Sep-08'Oct-08'Nov-08'Dec-08'Jan-09'Feb-09'Mar-09'Apr-09'May-09FMCG Value Rs.BnFMCG Value Growth % YA'Jun-09FMCG Industry Size^Rs Bn MAT-09 MAT-08FMCG Size 1104.1 927.8YoY% 19%Source: AC Neilsen. MAT is immediately preceding 12 months to June^All <strong>India</strong> U+R Value Estimates for 80+ FMCG categories as tracked by Nielsen <strong>India</strong>A trust of over 125 years11
Rural Growth DriversKey Drivers• Multitude of structural factors driving ruraldemand - incomes, consumptions & govt ledinvestments• No of rural households with annual income ofmore than US$2000 have touched 56 million• By 2014-15, 150 million people in rural <strong>India</strong>will have consumption levels similar to the‘better-off’ urban consumer of today*• By 2014-15, industry and services willtogether account for 38% of ruralemployment. This growth will bring with itsignificant changes in consumer preferencesin rural <strong>India</strong>*• Government has allocated further Rs 400 bntowards National Rural EmploymentGeneration Act (NREGA), which will helpsustain/rev up rural demand going forward* Source: CERG report on Consumer <strong>India</strong>20.00%18.00%16.00%14.00%12.00%10.00%8.00%6.00%4.00%2.00%0.00%8.7%12.7%18.7%18.2%5.4%9.8%13.2%11.5%Shampoo Hair Oil^ Toothpaste ChyawanprashUrban RuralSource: AC Neilsen Apr-Oct 2009. ^Apr-Aug 2009201816141210864200.7%5Category Growth: Urban Vs RuralIncrease in Rural spend by Government0.8%70.9%101.5%161.6%2006 2007 2008 2009RE 2010BEUS $ BnAs a % of GDP, RsSource: Budget Estimates, Morgan Stanley Research191.8%1.6%1.4%1.2%1.0%0.8%0.6%0.4%0.2%0.0%A trust of over 125 years12
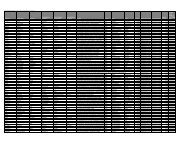
Penetration Levels: Sufficient HeadroomCategory Name Category Size (Rs Mn) All <strong>India</strong> % Urban %Rural %Hair Oil 22,631 94 96 93Health supplements* 1,681 8 14 5Packaged fruit Beverage 12,000 16 30 10Mosquito repellants 66,70 32 58 20Washing powders 47,027 90 93 89Washing cakes/ bars 28,269 88 91Move rural86Utensil cleaners NA 29 59 penetration 16to urbanShampoo 19,173 51 62 46levelsToilet Soap 62,170 91 96 89Tooth Paste 24,835 56 79 45Tooth Powder 4,551 31 26 33Fairness Creams NA 16 20 14Cold Creams NA 1 3 1Skin Cream 24,551 23 30 19Branded Baby Oil NA 2 2 1Source: Industry Data, <strong>India</strong>n Readership Survey 2008 Round 2Low penetration levels: Room for sustained growthA trust of over 125 years13
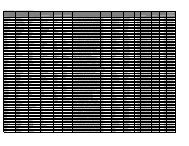
Key Players: FMCGUSD MillionCompany Key Categories Sales Profit Market CapHindustan Unilever Ltd Soaps, Detergents, Personal Care, Foods 4,383 536 12,066Tata Tea Tea 1,011 115 1,188Nestle <strong>India</strong> Ltd* Food, Beverages, Infant nutrition 915 119 5,234<strong>Dabur</strong> <strong>India</strong> Ltd Personal, Health & Homecare, Foods 590 82 2,941Britannia Industries Ltd Biscuits 706 38 806Colgate Palmolive (I) Ltd Oral Care & Toiletries 374 61 1,901Marico Ltd. Hair care, Food, Skincare 478 38 1,299Glaxo Smithkline Consumer* Consumer Health Care 309 38 1,147Cadbury <strong>India</strong> Ltd Chocolates, Confectionery, Nutrition 195 10 UnlistedReckitt Benckiser (<strong>India</strong>) Ltd*** Home Care 168 21 UnlistedGodrej Consumer Products Ltd Hair Care, Soaps 290 36 1,422Procter & Gamble** Feminine Hygiene, personal care 157 35 1,170Source: Published results for year ending 31.03.09*Year ending 31.12.08**Year ending 30.06.09 annualized***Year ending 31.12.04Note: Market Cap. as of 15.12.09A trust of over 125 years14
Business Structure<strong>Dabur</strong> operates through three focused Strategic Business UnitsBusiness UnitDescriptionRevenue ShareConsumer CareDivisionFMCG portfolio comprising fourdistinct businesses:•Personal Care•Health Care•Home Care•Foods70%Consumer HealthDivisionRange of ethical and OTC productsthat deliver the age-old benefits ofAyurveda in modern ready-to-useformats8%InternationalBusinessCaters to the health & personal careneeds of customers across differentinternational markets spanningMiddle East, North & West Africa, EUand US through its brands <strong>Dabur</strong> andVatika20%Note: Percentage share in revenue based on H1FY10 Financials ; Femcare included in Consumer Care DivisionA trust of over 125 years15
Consumer Care Division OverviewFPD HCPD Balsara Foods FEM2003-2004 2006-2007 2007-2008 2008-2009CCDFPD: Family Products DivisionHCPD: Health Care Products DivisionBalsara and Fem were acquisitions*Foods division was a 100% subsidiary of DILCategory-wise Share of CCD SalesCCD Sales - Historicalin Rs. million13%6%44%25,00020,00015,00010,158CAGR - 15.2%14,01312,25016,39218,65820,62037%10,0005,000Health Care Personal Care Foods Home Care-FY04 FY05 FY06 FY07 FY08 FY09A trust of over 125 years16
Consumer Care Category PerformanceGrowth Rate (Y-o-Y)35%30%25%20%15%10%5%0%22%23%7%5%21%11%29%15% 14%13%10%8%23%14%Hair CareOral CareHealthSupplementsDigestivesH1FY10Skin CareFY09Home CareFoods• Hair care the largest category continuing to post strong growth• Growth picked up in oral care, health supplements, foods and skin care• Foods reported robust growth of 23% during H1FY10.• Skin care grew by 29% in H1FY10 led by Gulabari brand and its extensionsA trust of over 125 years17
Consumer Care CategoriesKey BrandsHair Oils37%7%16%3%6%31%Bajaj <strong>Dabur</strong> Dey's MedicalEmami Marico OthersValue Share-ACN June, 09<strong>Dabur</strong> Amla:Largest brand inthe portfolioVatika: Value addedcoconut oilAnmol Hair Oil:Value propositionShampoos24%8%11%7%3%2%46%CavinkareHindustan UnileverL'orealOthersValue Share-ACN June, 09<strong>Dabur</strong>ITCP&GVatika range of shampoos<strong>Dabur</strong> Total ProtectAyurvedic ShampooA trust of over 125 years18
Consumer Care Categories (Contd.)Key BrandsOral Care23.6%11.5%3.3%48.7%12.8%Anchor Health Colgate <strong>Dabur</strong>Unilever OthersValue Share-ACN June, 09<strong>Dabur</strong> Red:Toothpaste &ToothpowderBabool: Targeted ateconomy segmentMeswak: PremiumtherapeutictoothpasteHealth Supplements (Chyawanprash)1.1% 6.3% 10.9%0.1%8.1%13.2%60.3%Baidyanath <strong>Dabur</strong> Emami Mayer <strong>India</strong>Ranbaxy Zandu OthersValue Share-ACN June, 09<strong>Dabur</strong> Chyawanprash:Largest selling healthsupplement in thecountry<strong>Dabur</strong> Glucose:2 nd largestplayer in thecountry<strong>Dabur</strong> Honey: Largestbranded honey in thecountry; growingcategory through replacesugar strategyA trust of over 125 years19
Consumer Care Categories (Contd.)Key BrandsFoods15.5%3.7%45%36.4%<strong>Dabur</strong> Pepsi Priya Gold OthersValue Share-ACN May, 09 ; Fruit Juice categoryReal: Flagshipbeverages brandReal Activ: Rangeof 100% pure juiceReal Burrst: Newfruit Drink brandSkin Care*3.2%18.0%58.9%6.4%6.6%6.8%Hindustan Lever Emami <strong>Dabur</strong>Loreal Cavin Care Others*Company estimates; Includes Fem skin care portfolioGulabari range of rose based skin careproducts: Moisturizer, Face freshener& Rose waterFem Skin care :Acquired recentlyA trust of over 125 years20
Robust Brand Architecturein Rs. billionBrand ArchitectureDomesticOverseasTotal<strong>Dabur</strong>Herbal Healthcare15.31.717.0VatikaHerbal Personal Care2.11.83.9HajmolaTasty Digestives1.30.11.4FemSkin Care range1.0*1.0RealFruit Beverages2.50.53.0BalsaraHome Care1.2 0.1 1.3* Brand size pertains to FY2008-09 sales in <strong>India</strong> and overseas; Fem had sales of about Rs.30 mn in overseas markets in FY09A trust of over 125 years22
Key Initiatives: Aggressive Product LaunchesPersonal CareHome CareOdonil Gel variantslaunchedVatika Dandruff ControlShampoo with 3 variants<strong>Dabur</strong> Total ProtectAyurvedic shampooAmla Flower MagicOdomos NaturalsLaunch of Gulabaricold cream & lotionVatika AlmondEnriched hair oilA trust of over 125 yearsDazzl Silver &Glass Cleaners23
Key Initiatives: Aggressive Product LaunchesHealth CareFruit based BeveragesRe-launch of LDM andRTP in new packNew HoneypackagingBabool Mint Gel launchedin key marketsNew variants of Real: AppleNectar, Peach & Black CurrantLaunch of Lemon & OrangeflavoursNew Pudinavariant ofHajmolaEntered MFD categorywith Chyawan Junior;Revamped theChyawanprashpackagingTest Launched Burrst : NewFruit Drinks brandA trust of over 125 years24
Uveda: New Skin Care LaunchHighlights• The new Uveda range test marketed in Delhi& Maharashtra.• Vidya Balan is the new brand ambassador forUveda• Good initial response to the brand• Pan-<strong>India</strong> roll-out planned in FY2011In shop promotionsUveda Ads in Print MediaUveda placementin Modern TradeA trust of over 125 years25
Consumer Health DivisionDescription• <strong>Dabur</strong> is the largest OTC Healthcarecompany in <strong>India</strong> (Source: Nicholas Hall’sOTC Yearbook 2008)• CHD :Repository of <strong>Dabur</strong>’s AyurvedicHealthcare knowledge• Plans underway to build a comprehensivestrategy for a greater push in OTC HealthspaceCHD StructureOTC (57%)ETHICAL (43%)GenericsTonicBranded Products ClassicalsBranded EthicalsFocus on <strong>Dabur</strong> Ayurveda: Generatingequity for Ethical portfolioHoni- Mint Extension of HonitusPudin Hara :Leading DigestivesOTC brandFirst ever Ad spend onHingoli in Seven yearsIn shop activationsA trust of over 125 years26
International Business DivisionHighlights• <strong>Dabur</strong>’s overseas business now contributes20% to consolidated sales led by CAGR of33% in last 5 years• Focus markets:• GCC• Egypt• Nigeria• Bangladesh• Nepalin Rs. million600050004000High Growth in IBDCAGR - 33%5,2503,7602,91730002,2581,80720001,281100002003-04 2004-05 2005-06 2006-07 2007-08 2008-09• U.S.• High level of localization of manufacturingand sales and marketing• Leveraging the “Natural” preference amonglocal consumers to increase share in personalcare categories• Sustained investments in brand building andmarketingNew products contributingsignificantly to overseassalesA trust of over 125 years27
Fem Care AcquisitionHighlights• Fem care acquisition completed on 25 th June,2009.• First full quarter completed under <strong>Dabur</strong>management• Core consumer business of Bleaches & HairRemoving Creams delivered growth of 29.6%during Q2FY10.• Categories growing at 15-25% offeringsignificant growth potential• Launched new Fem Herbal Bleach &Complete Hair Removal system. Herbal HRCin the offing.• Substantial brand building investments incore brands.• Preity Zinta taken as brand ambassador forFem• To be merged with <strong>Dabur</strong> <strong>India</strong> <strong>Limited</strong> witheffect from 1st April 2009Hair RemovingSystem launchedNew Herbal Bleachlaunched in May 2009A trust of over 125 years28
DIL Growth StrategyStrengthening new categoriesSkin Care: Ayurvedic skin carerange under a new brandlaunched; Acquisition of FemOTC Healthcare: LeveragingAyurveda knowledge for a rangeof OTC herbal productsFruit Drinks and Culinary:Entry into the fast growing fruitdrinks category leveraging theReal franchiseTargeting inorganicopportunitiesMarket Entry: Acquisitionscritical for building scale inexisting categories & marketsSynergies: Should besynergistic and make a goodstrategic fitGeographies: Opportunities infocus marketsStrong innovation programmeContribution: New products tocontribute 5-6% of revenuesFocus Categories: New productactivations planned up in allcategoriesRenovation: Periodic brandrenovations to keep older productssalientExpanding across geographiesOverseas markets: 20% ofoverall company; target to sustainhigher growth ratesSouth <strong>India</strong>: Increasedcontribution from 7% to 12%;Continued focus on the relevantportfolio to grow contributionA trust of over 125 years29
Topline and Bottomline Performance: FY09in Rs. millionSales: FY 2008-09 v/s 2007-0830000250002000023,96318.3%28,341Sales increased by 18.3% to touchRs. 28,341 mn during FY09150001000050000FY08FY09PAT: FY 2008-09 v/s 2007-08in Rs. millionConsolidated PAT grew at 17.5% inFY09 touching Rs.3,912 mn.45004000350030003,32917.5%3,913PAT growth of 19% excluding retail25002000150010005000FY08FY09A trust of over 125 years30
Topline and Bottomline Performance: H1FY10Key Highlights• <strong>Dabur</strong> delivered robust first half sales growthof 22.3% driven by strong volume growth of14.2%• CCD including Foods grew by 17.2%• CHD grew by 15.1%• IBD grew by 38.2%• Categories leading the accelerated growthwere- Shampoos, Hair care, HealthSupplements, Skin care & Foods• PAT in H1FY10 went up by 29.3% forconsolidated business• EBITDA growth stood at 31%; expansion inEBITDA margins of 129 bpsin Rs. million180001600014000120001000080006000400020000in Rs. millionSales : H1 FY10 v/s H1 FY0922.3%16,03113,108H1 FY09H1 FY10PAT : H1 FY10 vs H1 FY09250020001,78529.3%2,308150010005000H1 FY09H1 FY10A trust of over 125 years31
Stock Performance & Shareholding Pattern<strong>Dabur</strong>’s Stock Price vis-à-vis NIFTYShareholding Structure*Banks/FIs/InsuranceCos., 8.1%FIIs, 13.1%<strong>India</strong>nPublic andOthers, 6.9%Promoters,69.5%MutualFunds, 2.5%*As on November 20, 2009<strong>Dabur</strong> Outperformed the index by 36% during the period Dec 2008 to Dec 2009A trust of over 125 years32
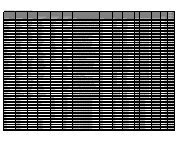
DIL Consolidated Financials: P&L H1FY10in Rs. million H1FY10 H1FY09 YoY (%) FY09 FY08 YoY (%)Gross Sales 16,031 13,108 22.3% 28,341 23,963 18.3%Less:Excise Duty 123.8 157.1 286.8 352.2Net Sales 15,907 12,951 22.8% 28,054 23,611 18.8%Other Operating Income 106 153 -30.7% 256 240 6.6%Material Cost 7,347 6,372 15.3% 13,762 11,154 23.4%% of Sales 45.8% 48.6% 48.6% 46.5%Employee Costs 1,319 1,134 16.3% 2,347 1,993 17.8%% of Sales 8.2% 8.7% 8.3% 8.3%Ad Pro 2,339 1,594 46.7% 3,433 2,955 16.1%% of Sales 14.6% 12.2% 12.1% 12.3%Other Expenses 1,965 1,732 13.5% 3,808 3,415 11.5%% of Sales 12.3% 13.2% 13.4% 14.3%Other Non Operating Income 79 112 -28.8% 213 100 112.1%EBITDA 3,122 2,384 31.0% 5,173 4,433 16.7%% of Sales 19.5% 18.2% 18.3% 18.5%Interest Expenses 70 80 -12.7% 232 168 38.2%Depreciation/Amortization 263 240 9.5% 492 421 17.0%Profit Before Tax (PBT) 2,790 2,064 35.2% 4,449 3,844 15.7%Taxes 475 283 67.9% 540 507 6.6%Profit After Tax (PAT) 2,315 1,781 30.0% 3,909 3,338 17.1%% of Sales 14.4% 13.6% 13.8% 13.9%PAT (After Minority Int) 2,305 1,785 29.2% 3,913 3,329 17.5%EPS (Rs) 2.66 2.06 4.52 3.85A trust of over 125 years33
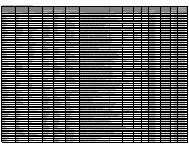
DIL Consolidated Balance Sheet: Sept 30, 2009in Rs. millionSources Of FundsShareholders' Fund:YTD Sep 09 YTD Sep 08Share Capital 866 865Reserves & Surplus 9,193 7,18310,058 8,048Minority Interest 83 44Loan Funds:Secured Loans 1,133 1,523Unsecured Loans 541 1,674 42 1,565Deffered Tax Liability 358 283TOTAL 12,173 9,940Application of funds:Fixed Assets:Gross Block 11,772 8,052less: Depreciation 3,266 2,827Net block 8,507 5,225Investments 1,121 1,744Current Assets,Loans & AdvancesInventories 4,491 4,154Sundry Debtors 2,195 2,265Cash & Bank balances 1,377 706Loans & Advances 3,414 11,477 2,735 9,860Current Liabilities 5,729 4,994Provisions 3,535 2,2729,264 7,266Net Current Assets 2,213 2,594Miscellaneous Expenditure 79 138Deffered Tax Assets 257 240TOTAL 12,173 9,940A trust of over 125 years34
Investor Relations<strong>Dabur</strong> <strong>India</strong> LtdContact:+91-11-42786000A trust of over 125 years35