Connecting Possibilities Living Energy - Siemens
Connecting Possibilities Living Energy - Siemens
Connecting Possibilities Living Energy - Siemens

Create successful ePaper yourself
Turn your PDF publications into a flip-book with our unique Google optimized e-Paper software.
ContentsContents 3Preface4Introduction61 Europe 82 Russia 123 USA 164 China 205 Saudi Arabia 246 Republic of Korea 287 World 32Imprint 343
Tomorrow’s energy:connecting possibilities<strong>Energy</strong> is one of the fundamental requisites for thedevelopment of every society. Economic successand prosperity depend directly on the questionof how reliably a society’s energy system – inparticular electricity – functions. The situationnaturally varies from country to country and fromregion to region.To ensure the availability of electricity and makeit both economical and climate friendly, manyquestions have to be answered. And definitiveanswers can be found only when the search forsolutions doesn’t end at a given country’s orregion’s borders, but rather takes the largercontexts into account.Our Road to the World <strong>Energy</strong> Congress in Daegu,October 2013, was a welcome opportunity to takea closer look at energy systems in regionsthroughout the world. Our goal wasn’t to focus onminor possibilities for improvements, but to thinkin larger terms.The individual scenarios make it clear that thereis huge savings potential when it comes tosustainable, secure and, above all, cost-efficientenergy supplies. The results are intended tostimulate ideas and motivate.4
PrefaceIf we all promote and implement only a smallshare of these possibilities, we would makesubstantial progress toward achieving energysystems with more innovative technologies, moreeffective climate and environmental protection,better supply security and greater efficiency.Let’s join together and pursue this path!Yours,Michael SuessDr. Michael SuessCEO <strong>Siemens</strong> <strong>Energy</strong> Sectorand member of themanaging board of<strong>Siemens</strong> AG5
IntroductionAlthough energy markets throughout the worldface enormous challenges, they also have vastopportunities. The challenges are obvious: Whilethe focus is on developing and expanding powersupplies for rapidly growing populations andeconomies in the dynamic markets of Asia andSouth America, industrialized countries are aimingat stabilizing the price of electricity and ensuringhigh reliability of their energy systems. In addition,some countries are undertaking a comprehensiveshift of their energy systems to renewable sources.All countries and regions have four core challengesin common: ensuring economic efficiency, areliable power supply, resource efficiency andclimate protection. However, each country has itsown particular weighting of these challenges – dueto differences in their resources, geographiclocation and economic development.Three channelsIn the run-up to the World <strong>Energy</strong> Congress inDaegu, South Korea, in 2013, <strong>Siemens</strong> – as oneof the world’s major energy solution providers –launched a global discussion on three differentchannels on its Road to Daegu:The first channel featured six live discussions withDr. Michael Suess, CEO of the <strong>Siemens</strong> <strong>Energy</strong>Sector, and local energy experts in six differentregions.The second channel was provided by a tourconducted by two bloggers who traveled fromcontinent to continent asking questions, searchingfor answers, and discussing them with readersworldwide on the <strong>Energy</strong>Blog.6
IntroductionAnd a third channel was opened to prepare aninteresting basis for discussions: the study»<strong>Connecting</strong> <strong>Possibilities</strong> – Scenarios for Optimizing<strong>Energy</strong> Systems.« The study analyzes the regionalcircumstances of six regions or countriesconsidering forecasts for their future energydemands, and derives implications for theirenergy markets on this basis.Scenarios for optimizing energy systemsFor each of the six regions (EU, Russia, USA,China, Saudi Arabia and Republic of Korea), wecalculated – based on the present situation – anumber of scenarios up to the year 2030 that showthe optimization potential that would be availablethrough technical changes in the energy suppliescompared to current planning.All the scenarios show that investments in securityof energy supply, fuel diversification, energyefficientdemand-side technologies, efficientpower-generation technologies and infrastructuremodernization offer a combination of economicand environmental advantages. In short: The studyconcludes that economic behavior in terms ofenergy leads to a balanced energy triangle andthus to greater social prosperity.7
EuropeSelf-sufficiency58%Power generation3,662TWhthereofrenewables24%Per capitaconsumptionCO2 emissionsper capitaPopulation552million5,631kWhper capita2.5 tCO2 emissionsof power sectorCO2 intensityof power sectorCalculations for 2010Source: IEA – WEO 2012; IEA – <strong>Energy</strong>Balances 2012; The World Bank – WorldData Bank; <strong>Siemens</strong> calculations81,373 Mt440 gper kWh
EuropeThe European Union is one of the largest singleeconomic areas in the world, which can be seen inthe high share of imports compared to localconsumption. Four of the 28 member states rank inthe top ten largest national economies in the worldby GDP. Yet the European Union is the economicregion with the least primary energy resources inthe world. Greater energy independence and bettersustainability could be achieved by developing ahigher share of renewable energy sources. Variousincentives have been offered by Europeangovernments to promote more wind and solarpower generation, and have resulted in partlyuncoordinated market growth. Since theseincentives often fail to consider Europe’sgeographical diversity, at times they lead toinefficiency and unexploited potential, such asrenewable power plants in suboptimal locations.The situation is further complicated by the complexstructure of national regulations and the lack of anintegrated European energy policy and market. Tofunction as a single integrated energy market, theregion’s political, organizational and technicalbarriers must be overcome.The two scenarios present the possibilities forsignificant saving potentials in the future. The firstsuggests a location optimization of all additionalrenewable power plants across the EU up to 2030to increase the load factor of the new installations.The second assumes a complete consecutive coalto-gasshift by 2030, which would increase thesustainability and stabilize the availability of power.9
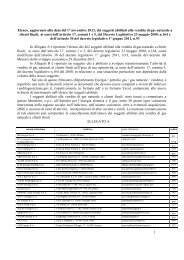
Scenario 1»Renewable energygeneration plants willbe built at optimalgeographic locationsin the EU.«Present2012Optimized2030The optimization of renewable power plant locations would lead tosavings of up to USD 60 bn by 203010
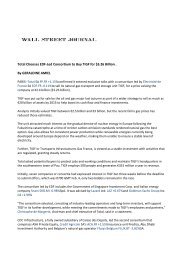
EuropeScenario 2»All coal-fired power plants will consecutively be replaced by modernand flexible combined cycle gas-fired power plants by 2030.«Combined cyclepower plantGas 895 TWh860 Mt CO2+TodaySteampower plantCoal 485 TWh495 Mt CO2Combined cyclepower plantGas 1,380 TWh> 2030365 MtCO2 savings40%CO2 savingsThe coal-to-gas shift would lead to 365 Mt CO2 savings from 2030 onwards11
RussiaSelf-sufficiency184%Power generation1,036TWhthereofgas50%Per capitaconsumptionCO2 emissionsper capitaPopulation142.7million5,179kWhper capita6.0 tCO2 emissionsof power sectorCO2 intensityof power sectorCalculations for 2010Source: IEA – WEO 2012; IEA – <strong>Energy</strong>Balances 2012; The World Bank – WorldData Bank; <strong>Siemens</strong> calculations12872 Mt1,200 gper kWh
RussiaStretching 17,100,000 square kilometers acrossnorthern Eurasia, Russia is the largest country inthe world. Drawing on its vast energy resourcereserves, Russia produced approximately 1,300Mtoe of primary energy in 2010. This equaledmore than 10% of the total worldwide primaryenergy demand that year. Only about half of theproduced amount is consumed within the countryitself; the rest is exported and thus a major driverfor national GDP. Russia’s decisions concerning itsenergy will therefore have an influence on thesecurity of international energy supplies,environmental sustainability and the country’sdomestic economy.Most of the country’s power is generated ininefficient plants due to the lack of financialincentives for modernization. Tariff regulations inthe power generation sector, for example,discourage market competition and there is nomarket mechanism for investments. Nevertheless,modernization of the country’s plant fleet isnecessary to tap benefits such as increasedcompetitiveness, reduced fossil fuel dependencyand environmental improvements.The scenarios quantify the efficiency potential inthe Russian power generation and energyconsumption sector. In terms of power generation,replacing gas-fired steam power plants would tapmajor potential for energy savings. With regard toend consumption, the potential offered bymodernizing the industry, building and transportsectors is shown in the second scenario.13
USASelf-sufficiency78%Power generation4,353TWhthereofcoal46%Per capitaconsumptionCO2 emissionsper capitaPopulation316.4million12,257kWhper capita7.4 tCO2 emissionsof power sectorCO2 intensityof power sectorCalculations for 2010Source: IEA – WEO 2012; IEA – <strong>Energy</strong>Balances 2012; The World Bank – WorldData Bank; <strong>Siemens</strong> calculations162,290 Mt530 gper kWh
USAThe United States accounts for roughly one-sixth ofthe global energy consumption and has until nowbeen dependent on energy imports. Now that it isexploiting its vast reserves of unconventional fuelslike shale gas to increase the affordability of itsenergy supplies, the U.S. is shifting from anenergy-importing to an energy-exporting nation.The government’s focus on affordability of energymight be one reason for the comparably low shareof renewable energy sources to date. Nevertheless,the U.S. can provide a sustainable and affordableenergy supply by using its domestic natural gas inefficient combined cycle power plants. Thereduction of CO2 emissions in the past years hasbeen a positive side effect of the economicallydriven development that has strengthened U.S.global competitiveness. This course has helped theU.S. government achieve environmentalimprovements in its energy supply while keepingenergy prices low.Nonetheless, there is still potential to be realized.Most of the electricity in the U.S. is still generated byinefficient coal-fired power plants. These plants areeconomically viable due to the relatively low coalprices ensured by the country’s huge coal reserves.In addition, the country’s power transmission grid,with losses higher than the international average, isnot adequate for today’s market conditions and isplagued by frequent supply interruptions.The two scenarios define various measures forovercoming the specific challenges in the U.S.energy market. They describe the economic andenvironmental savings that could be achieved byfocusing on gas in power generation andmodernizing the grid system.17
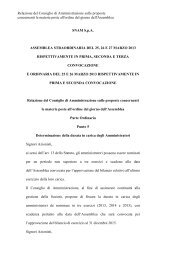
Scenario 1»The primary energy carrier coal will besubstituted completely by gas in powergeneration by 2030.«Combined cyclepower plant2,300 Mt CO2Steampower plant1,300 Mt CO2Combined cyclepower plant1,000 MtCO2 savings+ 45%CO2 savingsGas 1,100 TWhCoal 1,970 TWhGas 3,530 TWhToday> 2030The coal-to-gas shift would lead to 1,000 Mt CO2 savings from 2030 onwards18
USAScenario 2»The power grid system in theU.S. will be modernized anddeveloped towards an internationalstate-of-the-art level.«ReductionAnnual savings6% 4%Reduction of overall grid losses fromabout 6% currently to about 4%Annual savings in powerproduction expendituresUSD 4 bnThe modernization of the power grid system would lead to savingsof USD 4 bn annually19
ChinaSelf-sufficiency91%Power generation4,247TWhthereofcoal78%Per capitaconsumptionCO2 emissionsper capitaPopulation1,353.3million2,581kWhper capita2.8 tCO2 emissionsof power sectorCO2 intensityof power sectorCalculations for 2010Source: IEA – WEO 2012; IEA – <strong>Energy</strong>Balances 2012; The World Bank – WorldData Bank; <strong>Siemens</strong> calculations203,625 Mt1,050 gper kWh
ChinaWith over 1.3 billion inhabitants, China is the mostpopulous country in the world. This vast number ofpeople and China’s large economy make thecountry energy-hungry. In absolute numbers, it isthe largest consumer of energy in the world andas the economy grows, demand for energy willcontinue to soar. To master this challenge, Chinaneeds uninterrupted access to affordable bulkenergy.Furthermore, to maintain energy security, thisneeds to be achieved without substantiallyincreasing the country’s dependence on energyimports. China currently has a high degree ofself-sufficiency, primarily due to its extensivecoal reserves.At the same time, however, the country’s focus oncoal is a key driver behind high CO2 emissions andhas made China the world’s largest emitter. Thegovernment is aware of this problem and is takingvarious measures to control emissions. The powersector is responsible for nearly half of the totalemissions in China. Given this situation, thefollowing options for reducing CO2 emissions arefeasible: modernization of aging, inefficient powerplants, accelerated construction of highly efficientgas-fired power plants, and further developmentof non-fossil fuels, such as renewables.The scenarios examine a coal-to-gas shift forinefficient coal-fired power plants and anexpansion of renewables.21
Scenario 1»Replacement of inefficient coal-fired power plants (about 30%of the installed coal capacity) by efficient gas-fired combinedcycle power plants by 2030.«Consumption p.a.CO2 emissions p.a.Regularplanning20306,210 MtSteam power plant5,980 TWh1,430 MtoeCoal-togasshiftscenario2030Steam power plantCombined cycle power plant4,890 Mt4,190 TWh1,790 TWh1,200 MtoeA 30% coal-to-gas shift would lead to 1,300 Mt CO2 savings from 2030 onwards22
ChinaScenario 2»Increasing the share of renewables without hydroin the power generation mix to 30% by 2030.«China2 x Europe6,210 Mt CO24,050 MtCO22,160 MtCO2 savings1,000 Mt CO235%CO2 savings1,000 Mt CO2Total expected emissionsof power sector in 2030(Regular planning)Total expected emissionsof power sector in 2030(Renewable scenario)A share of 30% intermittent renewables in power generationwould reduce CO2 emissions by roughly 2,200 Mt2,160 Mt CO2 savings isnearly twice the totalgeneration emissions inEurope in 201023
SaudiArabiaSelf-sufficiency318%Power generation240TWhthereofoil54%Per capitaconsumptionCO2 emissionsper capitaPopulation28.7million7,140kWhper capita6.7 tCO2 emissionsof power sectorCO2 intensityof power sectorCalculations for 2010Source: IEA – WEO 2012; IEA – <strong>Energy</strong>Balances 2012; The World Bank – WorldData Bank; <strong>Siemens</strong> calculations24183 Mt940 gper kWh
Saudi ArabiaThe Kingdom of Saudi Arabia, as a part of theMiddle East region, is among the most energyresource-rich countries in the world. With provenoil reserves comprising about one-fifth of theworld’s total, Saudi Arabia is among the majorproducers as well as exporters of petroleum liquids.Consequently, the Saudi Arabian economy stronglydepends on this industry. Furthermore, the sizeof proven natural gas reserves in the country isthe fifth-largest in a worldwide comparison.Nevertheless, broad gas extraction for exportpurposes has not yet been a primary nationaltarget.But in line with the growing Saudi Arabian economyand population, domestic energy consumption issharply increasing. If no optimization measures aretaken, experts predict that by 2030, two-thirds ofthe country’s oil production would be required fordomestic consumption and export revenues wouldbe hurt significantly.Therefore, optimizing the efficiency of the existingequipment infrastructure and diversifying towardmore sustainable alternative non-fossil sourcesneeds to be considered. Even though the SaudiArabian government is already introducing plans toovercome these challenges, there are still untappedpotentials to be realized.The scenarios define various measures for thespecific challenges in the Saudi Arabian energymarket. They describe the economic andenvironmental savings that could be achieved byshifting from oil to gas, and toward non-fossilenergy sources.25
Scenario 1»Shift of all oil-fired steam power plants to gas-firedcombined cycle power plants by 2030.«Fuel consumption p.a.CO2 emissions p.a.Regularplanning2030Oil-firedsteam power plant117 Mtoe320 MtScenario 12030Gas-fired combined cyclepower plant97 Mtoe235 MtThe oil-to-gas shift would lead to 85 Mt CO2 savings from 2030 onwards26
Saudi ArabiaScenario 2»Shift towards non-fossil energy by increasing the shareof renewable and nuclear power plants by 2030.«Saudi Arabia1.5 xUnited Arab Emirates320 Mt CO2227 Mt CO2 60 Mt CO293 MtCO2 savingsTotal expected emissionsof power sector in 2030(Regular planning)Total expected emissionsof power sector in 2030(Scenario 2)30%CO2 savingsThe increased share of non-fossil power generation wouldreduce CO2 emissionsby roughly 93 Mt from 2030 onwards93 Mt CO2 savingsis approximately1.5 times the totalgeneration emissionsof the UnitedArab Emiratesfor 203027
Republicof KoreaSelf-sufficiency18%Power generation497TWhthereofnuclear30%Per capitaconsumptionCO2 emissionsper capitaPopulation49.4million9,186kWhper capita5.7 tCO2 emissionsof power sectorCO2 intensityof power sectorCalculations for 2010Source: IEA – WEO 2012; IEA – <strong>Energy</strong>Balances 2012; The World Bank – WorldData Bank; <strong>Siemens</strong> calculations28279 Mt620 gper kWh
Republic of KoreaDue to its limited domestic energy resources,the Republic of Korea is heavily dependent onprimary energy imports. The country consumedmore than 680 million barrels of oil and 43.2 billioncubic meters of gas in 2011, partly due to its hugeand advanced refinery industries. More than 85%of the country’s primary energy imports come fromthe Middle East, and this dependence is the majorchallenge faced by the Korean energy market.Greater independence of imports could beachieved by intensifying the development andintegration of renewable energy sources andfurther expanding nuclear sources.However, the country’s share of renewable sourcesin its overall primary energy supply is the lowestof all OECD countries, while its nuclear share liesabove the OECD average. Consequently,improvement potentials exist that should betapped to strengthen the economy overall andsecure the country’s energy supply for the future.The scenarios have been calculated to address thespecific Korean challenges and present options forthe country’s energy market. In the first scenario, acoal-to-gas shift is assumed, while in the secondscenario the share of renewable and nuclear powergeneration is assumed to increase up to 2030.29
Scenario 1»All coal-fired power plants will consecutively bereplaced by modern and flexible combined cyclegas-fired power plants by 2030.«190 Mt CO2130 Mt CO260 MtCO2 savingsCombined cyclepower plant+Steam power plantCombined cyclepower plant30%CO2 savingsGas 210 TWhCoal 105 TWhGas 315 TWhRegular planning 2030> 2030The coal-to-gas shift would lead to 60 Mt CO2 savings from 2030 onwards30
Republic of KoreaScenario 2»Shift towards non-fossil energy by increasing theshare of renewable and nuclear power plants by 2030.«190 Mt CO2 95 Mt CO295 MtCO2 savings50%CO2 savingsTotal expected emissionsof power sector in 2030(Regular planning)Total expected emissionsof power sector in 2030(Scenario 2)The enhanced installation of renewables and nuclear power plants would lead to95 Mt CO2 savings annually from 2030 onwards, compared to the regular planning31
RésuméThe study showed that great potential for improvingefficiency and reducing environmental impact liesin a coal-to-gas shift. Currently, the most efficientfossil power generation is achieved with gas-firedcombined cycle power plants. Therefore, a coalto-gasshift is the most sensible path in terms ofefficiency. If one assumes a worldwide powergeneration shift from coal-fired steam power plantsto gas-fired combined cycle power plants by 2030(with the exception of China and India, where a 30%shift is assumed, due to extensive regional coalresources, limited gas resources, and missinginfrastructure such as pipelines), this shift wouldresult in annual CO2 savings of more than 4,000 Mtfrom 2030 onward, which equals a 25% reduction inthe power sector compared to the regular planningcase. Technically recoverable conventional andunconventional global gas resources could cover thegas demand of a worldwide coal-to-gas scenario formore than 250 years.The calculated scenarios in this study show thatinvestments in more efficient power generation anda heavier weighting of non-fossil energy sources likewind and solar in the energy mix would pay off in allenergy markets. In short: The study concludes thateconomically based behavior in terms of energyleads to environmental and social benefits.32
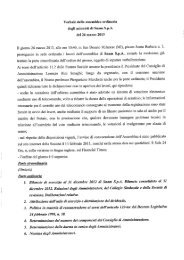
WorldScenario»All coal-fired power plants will consecutively be replaced by modernand flexible combined cycle gas-fired power plants by 2030.«+25%13.2 Gt CO216.7 Gt CO2-5%12.7 Gt CO2Regularplanning+ +Coal-togasshiftGas-firedpower plantCoal-firedpower plantGas-firedpower plantCoal-firedpower plantGas-firedpower plant20122030A global coal-to-gas shift would lead to a reduction of CO2 emission by 5%instead of the significant increase of more than 25% in the regular planning33
ImprintPublisher<strong>Siemens</strong> <strong>Energy</strong> SectorFreyeslebenstrasse 191058 ErlangenGermanysiemens.com/energyFor more information, please contact ourCustomer Support Center.Phone: +49 180 524 70 00Fax: +49 180 524 24 71(charges depending on provider)E-mail: support.energy@siemens.comsiemens.com/energy/living-energyImage processing, graphics, layoutfeedback communication GmbH90489 NurembergGermanyProductionWünsch Offset-Druck GmbH92318 Neumarkt, GermanyOrder No. E50001-W100-A189-X-4A00Printed in GermanyDispo 11900fb 5859 WÜ 411260 10131.5© 2013 by <strong>Siemens</strong> AG. All rights reserved.The rights to all images are held by <strong>Siemens</strong> AG.The information in this document contains generaldescriptions of the technical options available,which may not apply in all cases.All information and figures presented herein werecurrent at the time of printing in September 2013.The complete studycan be downloaded at:siemens.com/energy-study34
Findus atsiemens.com/energy<strong>Living</strong> <strong>Energy</strong>E50001-G100-M164-V8-4A00
siemens.com/energy