Manual for Sugar solution Prism - Frederiksen
Manual for Sugar solution Prism - Frederiksen
Manual for Sugar solution Prism - Frederiksen

Create successful ePaper yourself
Turn your PDF publications into a flip-book with our unique Google optimized e-Paper software.
<strong>Manual</strong> <strong>for</strong> <strong>Sugar</strong> <strong>solution</strong> <strong>Prism</strong>03.08.05 Ae 5459.20The sugar <strong>solution</strong> prism is designed <strong>for</strong> experimentaldetermination of the sugar concentration inwater-based <strong>solution</strong>s. The method is based on themeasurment of a number of sugar <strong>solution</strong>s withdifferent concentrations (measured in percentage bymass). The index of refraction <strong>for</strong> a sugar <strong>solution</strong>depends upon the concentration. For ordinary canesugar the relationship between the index of refractionand the concentration is given by the followingtable:<strong>Sugar</strong> concentration (%) Index of refraction0 1.33305 1.340310 1.347915 1.355720 1.363925 1.372330 1.381135 1.390240 1.399745 1.409650 1.420055 1.430760 1.441865 1.453270 1.465175 1.477480 1.490185 1.5033By sending monochromatic light e.g. from a laserthrough a number of sugar <strong>solution</strong>s of known concentrations,one can observe the refraction of thelight. Using a horizontal beam of light, one can measurehow high the refracted beam strikes a verticalscreen placed at a known distance from the prism.This data can be used to prepare a calibration curve.Then <strong>solution</strong>s of unknown concentration can bestudied using the calibration curve to determine theirconcentrations.For sugar <strong>solution</strong>s containing less than 40% sugarone can figure on a linear relationship between therefraction and sugar concentration. I such cases justtwo points on the calibration curve are sufficient(e.g. at 10% and 25%).The advantage of using laser light, in addition to itsmonochromicity (single wavelength), is that it is sointense that it can easily penetrate strongly coloredliquids such as undiluted soda pop or juice.Required accessories:Laser (2885.00 / 2885.10 / 2885.20), or diode laser(1420.70 / 1420.80). Screen or white cardboard.Theoretical considerationsBecause the angle at the bottom of the sugar prismis 60 degrees it is possible to arrive at the followingdata using geometry and the law of refraction.Source: Handbook of Chemistry & Physics, 64. edition, CRC, 1984.A/S S. <strong>Frederiksen</strong> Tel. +45 7524 4966 sflab@sflab.dkViaduktvej 35 · DK-6870 Ølgod Fax +45 7524 6282 www.sflab.dk
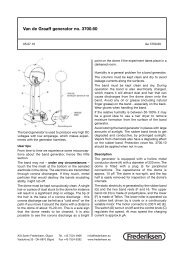
<strong>Sugar</strong> concentration Index of refraction Deviation angle from Height in mm at 1 m(*horizontal (degrees)0 1.333 25.0 4675 1.3403 25.8 48210 1.3479 26.5 49815 1.3557 27.2 51420 1.3639 28.0 53225 1.3723 28.9 55230 1.3811 29.8 57335 1.3902 30.8 59640 1.3997 31.8 62145 1.4096 33.0 64950 1.42 34.2 68055 1.4307 35.5 71560 1.4418 37.0 75465 1.4532 38.6 79870 1.4651 40.4 85175 1.4774 42.4 91480 1.4901 44.8 99385 1.5033 47.7 100*) Vertical height over the position of the spot of laser light when the sugar prism is emptyIt the last column of the table is graphed vs. the sugar concentation (column 1), the following is obtained:It can be seen from the graph that the relationship is approximately linear <strong>for</strong> concentrations up to 40%.Maintenance:The sugar prism must not be cleaned with alcohol. Use ordinary soap and water and rinse.
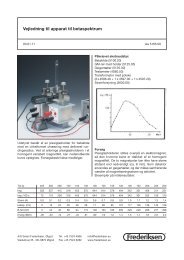
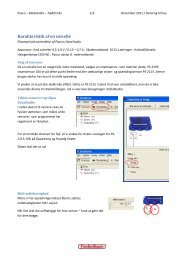
Laboratory exercise – setup:Important!When the experiment has begun, the distance betweenthe screen and the prism must remain constant.<strong>Sugar</strong>concentration in %Deviation in mm– Fasten the paper to the wall or screen with tapeas shown in the illustration.– Send a horizontal laser beam through the prismwhile the prism is empty.– Make a mark on the paper where the laser beamstrikes. This point is considered to be the referencelevel <strong>for</strong> measuring the vertical deviations.– Pour pure water into the prism and repeat themeasurement.– Prepare sugar <strong>solution</strong>s of e.g. 10% and 25%.– Per<strong>for</strong>m measurements with these <strong>solution</strong>s,noting in each case the vertical deviation comparedwith the reference mark.– Enter the data <strong>for</strong> 0%, 10% and 25% in a coordinatesystem with concentrations on the x-axisand deviations on the y-axis.– Now measure the deviation distance due to oneor more test liquids, e.g. soda pop or other drinkcontaining sugar.– Use the graph to read off the sugar concentrationof each test liquid based on your measurementsof the deviation distance.
0% 10% 20% 30% 40% 50%A/S S. <strong>Frederiksen</strong> Tel. +45 7524 4966 sflab@sflab.dkViaduktvej 35 · DK-6870 Ølgod Fax +45 7524 6282 www.sflab.dk