

Libro Blanco Vol I en Ingles
Libro Blanco Vol I en Ingles
Libro Blanco Vol I en Ingles

You also want an ePaper? Increase the reach of your titles
YUMPU automatically turns print PDFs into web optimized ePapers that Google loves.
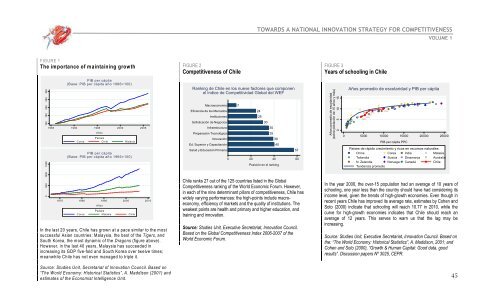
TOWARDS A NATIONAL INNOVATION STRATEGY FOR COMPETITIVENESSVOLUME 1FIGURE 1The importance of maintaining growthFIGURE 2Competitiv<strong>en</strong>ess of ChileFIGURE 3Years of schooling in Chile100 150 200 250 3000 500 1000 1500PIB per cápita(Base: PIB per cápita año 1986=100)1985 1990 1995 2000 2005A ñosPaísesC orea Chile MalasiaPIB per cápita(Base: PIB per cápita año 1966=100)1970 1980 1990 2000 2010AñosPaísesC orea M alasia ChileIn the last 20 years, Chile has grown at a pace similar to the mostsuccessful Asian countries: Malaysia, the best of the Tigers, andSouth Korea, the most dynamic of the Dragons (figure above).However, in the last 40 years, Malaysia has succeeded inincreasing its GDP five-fold and South Korea over twelve times;meanwhile Chile has not ev<strong>en</strong> managed to triple it.Ranking de Chile <strong>en</strong> los nueve factores que compon<strong>en</strong>el Indice de Competitividad Global del WEFMacroeconomíaEfici<strong>en</strong>cia de los MercadosInstitucionesSofisticación de NegociosInfraestructuraPreparación TecnológicaInnovaciónEd. Superior y CapacitaciónSalud y Educación Primaria724253035353940570 20 40 60Posición <strong>en</strong> el rankingChile ranks 27 out of the 125 countries listed in the GlobalCompetitiv<strong>en</strong>ess ranking of the World Economic Forum. However,in each of the nine determinant pillars of competitiv<strong>en</strong>ess, Chile haswidely varying performances: the high-points include macroeconomy,effici<strong>en</strong>cy of markets and the quality of institutions. Theweakest points are health and primary and higher education, andtraining and innovation.Source: Studies Unit, Executive Secretariat, Innovation Council.Based on the Global Competitiv<strong>en</strong>ess Index 2006-2007 of theWorld Economic Forum.Años promedio de escolaridad(sobre población de 15 años y más)0 5 10 15Años promedio de escolaridad y PIB per cápita199019801960 197020000 5000 10000 15000 20000 25000PIB per cápita PPCPaíses de rápido crecimi<strong>en</strong>to y ricos <strong>en</strong> recursos naturalesChina Corea India MalasiaTailandia Suecia Dinamarca AustraliaN. Zelandia Noruega Canadá ChileT<strong>en</strong>d<strong>en</strong>cia promedioIn the year 2000, the over-15 population had an average of 10 years ofschooling, one year less than the country should have had considering itsincome level, giv<strong>en</strong> the tr<strong>en</strong>ds of high-growth economies. Ev<strong>en</strong> though inrec<strong>en</strong>t years Chile has improved its average rate, estimates by Coh<strong>en</strong> andSoto (2000) indicate that schooling will reach 10.77 in 2010, while thecurve for high-growth economies indicates that Chile should reach anaverage of 12 years. This serves to warn us that the lag may beincreasing.Source: Studies Unit, Executive Secretariat, Innovation Council. Based onthe: “The World Economy: Historical Statistics”, A. Maddison, 2001; andCoh<strong>en</strong> and Soto (2000), “Growth & Human Capital: Good data, goodresults”. Discussion papers Nº 3025, CEPR.Source: Studies Unit, Secretariat of Innovation Council. Based on“The World Economy: Historical Statistics”, A. Maddison (2001) andestimates of the Economist Intellig<strong>en</strong>ce Unit.45


![[Tam] Uygula[ya] - Bilim, Teknoloji ve Ä°novasyon Politikaları TartıÅma ...](https://img.yumpu.com/36820041/1/184x260/tam-uygulaya-bilim-teknoloji-ve-anovasyon-politikalara-tartaama-.jpg?quality=85)


