Genetic variation in Broadleaf Lupine (Lupinus latifolius) on the Mt ...
Genetic variation in Broadleaf Lupine (Lupinus latifolius) on the Mt ...
Genetic variation in Broadleaf Lupine (Lupinus latifolius) on the Mt ...
- No tags were found...

Create successful ePaper yourself
Turn your PDF publications into a flip-book with our unique Google optimized e-Paper software.
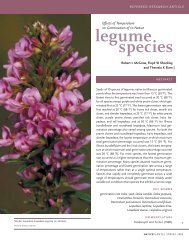
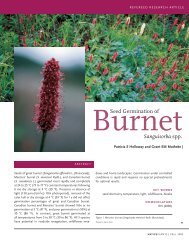
ables obta<str<strong>on</strong>g>in</str<strong>on</strong>g>ed from <strong>the</strong> PRISM model (Daly and o<strong>the</strong>rs 1994)<str<strong>on</strong>g>in</str<strong>on</strong>g>cluded: average m<strong>on</strong>thly temperature (Jan–Dec, °C), averagem<strong>on</strong>thly precipitati<strong>on</strong> (Jan–Dec, cm), average m<strong>on</strong>thly snow(Jan–Dec, cm), average m<strong>on</strong>thly grow<str<strong>on</strong>g>in</str<strong>on</strong>g>g degree-days (Jan–Dec,days above 10 °C [50 °F]), average date of last spr<str<strong>on</strong>g>in</str<strong>on</strong>g>g frost (Juliandate), and average date of first fall frost (Julian date). Plant associati<strong>on</strong>series, def<str<strong>on</strong>g>in</str<strong>on</strong>g>ed by Hall (1998), used for classify<str<strong>on</strong>g>in</str<strong>on</strong>g>g siteswere: Pacific silver fir, grand fir, western hemlock, mounta<str<strong>on</strong>g>in</str<strong>on</strong>g>hemlock, eastside Douglas-fir, and p<strong>on</strong>derosa p<str<strong>on</strong>g>in</str<strong>on</strong>g>e.PORTLANDCars<strong>on</strong>CorvallisOREGONGreenhouse and Field SitesSeeds were scarified and sown <str<strong>on</strong>g>in</str<strong>on</strong>g>to 5-cm (2-<str<strong>on</strong>g>in</str<strong>on</strong>g>) peat pots <str<strong>on</strong>g>in</str<strong>on</strong>g>early February 1997 at <strong>the</strong> Natural Resources C<strong>on</strong>servati<strong>on</strong> ServicePlant Materials Center (PMC) greenhouse <str<strong>on</strong>g>in</str<strong>on</strong>g> Corvallis, Oreg<strong>on</strong>.Plants were arranged <str<strong>on</strong>g>in</str<strong>on</strong>g> 2 replicati<strong>on</strong>s of a 16-plant plot ofeach family for greenhouse growth. By May 1 seedl<str<strong>on</strong>g>in</str<strong>on</strong>g>gs haddeveloped extensive root systems and were ready for outplant<str<strong>on</strong>g>in</str<strong>on</strong>g>g.Seedl<str<strong>on</strong>g>in</str<strong>on</strong>g>gs were outplanted to 2 field sites, <strong>on</strong>e at <strong>the</strong> PMC <strong>on</strong>May 8 and 9, and <strong>the</strong> o<strong>the</strong>r at <strong>the</strong> USDA Forest Service W<str<strong>on</strong>g>in</str<strong>on</strong>g>d RiverNursery (WRN) <str<strong>on</strong>g>in</str<strong>on</strong>g> Cars<strong>on</strong>, Wash<str<strong>on</strong>g>in</str<strong>on</strong>g>gt<strong>on</strong>, <strong>on</strong> May 21 and 22 (Figure1). Plants were spaced 46 x 91 cm (18 x 36 <str<strong>on</strong>g>in</str<strong>on</strong>g>) <str<strong>on</strong>g>in</str<strong>on</strong>g> a designwhere family row plots (4 plants of <strong>the</strong> same family) were randomized<str<strong>on</strong>g>in</str<strong>on</strong>g> 2 replicati<strong>on</strong>s at each locati<strong>on</strong> (1216 plants at eachsite). Experimental plots were surrounded by a two-row buffer tom<str<strong>on</strong>g>in</str<strong>on</strong>g>imize edge effects. Weeds were c<strong>on</strong>trolled by cover<str<strong>on</strong>g>in</str<strong>on</strong>g>g <strong>the</strong> plotwith woven plastic mulch material, and test plants were planted <str<strong>on</strong>g>in</str<strong>on</strong>g>10-cm (4-<str<strong>on</strong>g>in</str<strong>on</strong>g>) holes cut <str<strong>on</strong>g>in</str<strong>on</strong>g> <strong>the</strong> mulch fabric (Figure 2). Outplant<str<strong>on</strong>g>in</str<strong>on</strong>g>gsurvival was 95%. Plants were grown and observed for 2 y.TraitsGenerally, traits could be grouped <str<strong>on</strong>g>in</str<strong>on</strong>g>to 5 broad categories:greenhouse traits (such as time to emergence), plant size(crown height or diameter), morphology (height-to-diameterratios, erectness), phenology (flower<str<strong>on</strong>g>in</str<strong>on</strong>g>g date or date of budburst), and pest resistance (mildew susceptibility) (Figure 3).Measurements were taken at each site and evaluated <str<strong>on</strong>g>in</str<strong>on</strong>g>dependently,for example, first year crown height at PMC and firstyear crown height at WRN are 2 separate traits. I evaluated 74traits over <strong>the</strong> course of <strong>the</strong> study.<strong>Mt</strong>. Hood0 10 miles (16 km)SourceFifth field watershedFourth field watersheFigure 1. Locati<strong>on</strong> of <strong>the</strong> 2 field plot sites used <str<strong>on</strong>g>in</str<strong>on</strong>g> <strong>the</strong> comm<strong>on</strong>-garden studywith a detail of <strong>the</strong> Lup<str<strong>on</strong>g>in</str<strong>on</strong>g>us <str<strong>on</strong>g>latifolius</str<strong>on</strong>g> sampl<str<strong>on</strong>g>in</str<strong>on</strong>g>g sites <strong>on</strong> <strong>the</strong> <strong>Mt</strong> Hood Nati<strong>on</strong>alForest.Photo by Joan Tr<str<strong>on</strong>g>in</str<strong>on</strong>g>dleStatistical AnalysisAnalysis generally follows <strong>the</strong> methods outl<str<strong>on</strong>g>in</str<strong>on</strong>g>ed <str<strong>on</strong>g>in</str<strong>on</strong>g> Campbell(1986) and Sorensen and Weber (1994). SAS software for pers<strong>on</strong>alcomputers (SAS 1999) was used for all statistical computati<strong>on</strong>s.To determ<str<strong>on</strong>g>in</str<strong>on</strong>g>e significance of effects and estimate variancecomp<strong>on</strong>ents for <str<strong>on</strong>g>in</str<strong>on</strong>g>dividual traits, analyses of variance (PROCMIXED) were performed <strong>on</strong> plot means us<str<strong>on</strong>g>in</str<strong>on</strong>g>g <strong>the</strong> nested model:Y ijkl = µ + B i + S j + F k(j) + E l(ijk)Figure 2. The field site at Corvallis, Oreg<strong>on</strong>, show<str<strong>on</strong>g>in</str<strong>on</strong>g>g plot layout.where µ is <strong>the</strong> grand mean, B is <strong>the</strong> effect of block<str<strong>on</strong>g>in</str<strong>on</strong>g>g, S is <strong>the</strong>effect of source locati<strong>on</strong>, F is <strong>the</strong> family with<str<strong>on</strong>g>in</str<strong>on</strong>g> source effect,39DAVID L DOEDE NATIVEPLANTS | SPRING 2005
<strong>the</strong> source effect, <strong>the</strong> better <strong>the</strong> model expla<str<strong>on</strong>g>in</str<strong>on</strong>g>ed genetic <str<strong>on</strong>g>variati<strong>on</strong></str<strong>on</strong>g>am<strong>on</strong>g sources.Transfer risk am<strong>on</strong>g locati<strong>on</strong>s with<str<strong>on</strong>g>in</str<strong>on</strong>g> a z<strong>on</strong>e was estimated as<strong>the</strong> average proporti<strong>on</strong> of genotypes that differ between 2 populati<strong>on</strong>swith<str<strong>on</strong>g>in</str<strong>on</strong>g> <strong>the</strong> z<strong>on</strong>e. This was calculated as <strong>the</strong> proporti<strong>on</strong> ofn<strong>on</strong>-overlap between 2 normal curves (<strong>on</strong>e represent<str<strong>on</strong>g>in</str<strong>on</strong>g>g <strong>the</strong>transferred populati<strong>on</strong> and <strong>on</strong>e represent<str<strong>on</strong>g>in</str<strong>on</strong>g>g <strong>the</strong> local, nativepopulati<strong>on</strong>) with variances equal to <strong>the</strong> additive genetic variancewith<str<strong>on</strong>g>in</str<strong>on</strong>g> locati<strong>on</strong>s and separati<strong>on</strong> equal to <strong>the</strong> average distancebetween locati<strong>on</strong> means <str<strong>on</strong>g>in</str<strong>on</strong>g> <strong>the</strong> z<strong>on</strong>e (Campbell 1986).Additive genetic variance was calculated as 3X <strong>the</strong> familywith<str<strong>on</strong>g>in</str<strong>on</strong>g>-sourcecomp<strong>on</strong>ent of variance. A factor of 3 was usedbecause <strong>the</strong>re is some level of <str<strong>on</strong>g>in</str<strong>on</strong>g>breed<str<strong>on</strong>g>in</str<strong>on</strong>g>g <str<strong>on</strong>g>in</str<strong>on</strong>g> <strong>the</strong>se populati<strong>on</strong>s(Wils<strong>on</strong> and Hipk<str<strong>on</strong>g>in</str<strong>on</strong>g>s 2002) that would <str<strong>on</strong>g>in</str<strong>on</strong>g>crease <strong>the</strong> correlati<strong>on</strong>am<strong>on</strong>g progeny of open-poll<str<strong>on</strong>g>in</str<strong>on</strong>g>ated plants. Also, <strong>the</strong> estimate of<str<strong>on</strong>g>variati<strong>on</strong></str<strong>on</strong>g> am<strong>on</strong>g locati<strong>on</strong> means with<str<strong>on</strong>g>in</str<strong>on</strong>g> a z<strong>on</strong>e <str<strong>on</strong>g>in</str<strong>on</strong>g>cludes sampl<str<strong>on</strong>g>in</str<strong>on</strong>g>gerrors associated with sampl<str<strong>on</strong>g>in</str<strong>on</strong>g>g 1 to 4 families per locati<strong>on</strong>and genetic effects such as drift and/or migrati<strong>on</strong> fromn<strong>on</strong>-local pollen sources. An overall risk value of 0.51 impliesthat 50% of <strong>the</strong> seedl<str<strong>on</strong>g>in</str<strong>on</strong>g>g populati<strong>on</strong> is outside <strong>the</strong> genetic distributi<strong>on</strong>of <strong>the</strong> local populati<strong>on</strong>.Variati<strong>on</strong> <str<strong>on</strong>g>in</str<strong>on</strong>g> chromosome number was revealed <str<strong>on</strong>g>in</str<strong>on</strong>g> isozymeanalysis of a subset of <strong>the</strong> sources used <str<strong>on</strong>g>in</str<strong>on</strong>g> this study (Wils<strong>on</strong>and Hipk<str<strong>on</strong>g>in</str<strong>on</strong>g>s 2002). This trait was not quantified directly <str<strong>on</strong>g>in</str<strong>on</strong>g> thisstudy, however, an attempt was made to classify sources as totetraploid and diploid cytology <str<strong>on</strong>g>in</str<strong>on</strong>g>directly. A discrim<str<strong>on</strong>g>in</str<strong>on</strong>g>antfuncti<strong>on</strong> was developed to classify <strong>the</strong> cytology of <strong>the</strong> subset ofsources with known cytology (identified by isozyme analysis).A stepwise selecti<strong>on</strong> procedure was used to select traits for <strong>the</strong>discrim<str<strong>on</strong>g>in</str<strong>on</strong>g>ant functi<strong>on</strong>. This functi<strong>on</strong> was <strong>the</strong>n applied to all<strong>the</strong> sources <str<strong>on</strong>g>in</str<strong>on</strong>g> this study.RESULTSModerate amounts of genetic <str<strong>on</strong>g>variati<strong>on</strong></str<strong>on</strong>g> (source plus familywith<str<strong>on</strong>g>in</str<strong>on</strong>g>-source)were found for broadleaf lup<str<strong>on</strong>g>in</str<strong>on</strong>g>e <str<strong>on</strong>g>in</str<strong>on</strong>g> this study.Of <strong>the</strong> 74 traits analyzed, 64 had significant (P > 0.05) sourceor with<str<strong>on</strong>g>in</str<strong>on</strong>g>-source <str<strong>on</strong>g>variati<strong>on</strong></str<strong>on</strong>g>. For <strong>the</strong> majority of traits, <strong>the</strong>source comp<strong>on</strong>ent was greater than <strong>the</strong> with<str<strong>on</strong>g>in</str<strong>on</strong>g>-source variancecomp<strong>on</strong>ent. In 59 traits where genetic <str<strong>on</strong>g>variati<strong>on</strong></str<strong>on</strong>g> was more than25% of <strong>the</strong> total phenotypic <str<strong>on</strong>g>variati<strong>on</strong></str<strong>on</strong>g>, source <str<strong>on</strong>g>variati<strong>on</strong></str<strong>on</strong>g> averaged28% of <strong>the</strong> phenotypic <str<strong>on</strong>g>variati<strong>on</strong></str<strong>on</strong>g> while with<str<strong>on</strong>g>in</str<strong>on</strong>g>-source<str<strong>on</strong>g>variati<strong>on</strong></str<strong>on</strong>g> was 13% of <strong>the</strong> total. There is also abundant with<str<strong>on</strong>g>in</str<strong>on</strong>g>source<str<strong>on</strong>g>variati<strong>on</strong></str<strong>on</strong>g> and several traits displayed much more <str<strong>on</strong>g>variati<strong>on</strong></str<strong>on</strong>g>am<strong>on</strong>g families than am<strong>on</strong>g sources. For example, genetic<str<strong>on</strong>g>variati<strong>on</strong></str<strong>on</strong>g> <str<strong>on</strong>g>in</str<strong>on</strong>g> emergence was 70% of <strong>the</strong> phenotypic variance,yet <strong>the</strong> magnitude of <strong>the</strong> with<str<strong>on</strong>g>in</str<strong>on</strong>g>-source comp<strong>on</strong>ent was 2.8X41DAVID L DOEDE NATIVEPLANTS | SPRING 2005
<strong>the</strong> source comp<strong>on</strong>ent. O<strong>the</strong>r traits display<str<strong>on</strong>g>in</str<strong>on</strong>g>g this trend weretraits relat<str<strong>on</strong>g>in</str<strong>on</strong>g>g to flower<str<strong>on</strong>g>in</str<strong>on</strong>g>g date, number of flower spikes, andsenescence. Traits <str<strong>on</strong>g>in</str<strong>on</strong>g> which <strong>the</strong> majority of genetic <str<strong>on</strong>g>variati<strong>on</strong></str<strong>on</strong>g> isexhibited as with<str<strong>on</strong>g>in</str<strong>on</strong>g>-source <str<strong>on</strong>g>variati<strong>on</strong></str<strong>on</strong>g> do not provide <str<strong>on</strong>g>in</str<strong>on</strong>g>formati<strong>on</strong>about geographic patterns of <str<strong>on</strong>g>variati<strong>on</strong></str<strong>on</strong>g>, <strong>the</strong>refore <strong>the</strong>setraits were dropped from c<strong>on</strong>siderati<strong>on</strong>, as were traits highlycorrelated with o<strong>the</strong>r traits occurr<str<strong>on</strong>g>in</str<strong>on</strong>g>g later <str<strong>on</strong>g>in</str<strong>on</strong>g> <strong>the</strong> life cycle.I reta<str<strong>on</strong>g>in</str<strong>on</strong>g>ed 24 traits quantify<str<strong>on</strong>g>in</str<strong>on</strong>g>g size, growth rate, phenology,flower color, and disease resistance for fur<strong>the</strong>r analysis (Tables1 and 2). In pr<str<strong>on</strong>g>in</str<strong>on</strong>g>cipal comp<strong>on</strong>ent analysis of 24 traits, 4 comp<strong>on</strong>entsreta<str<strong>on</strong>g>in</str<strong>on</strong>g>ed more than 72% of <strong>the</strong> orig<str<strong>on</strong>g>in</str<strong>on</strong>g>al variability(Table 3). The first comp<strong>on</strong>ent was by far <strong>the</strong> largest, and summarized44% of <strong>the</strong> variability <str<strong>on</strong>g>in</str<strong>on</strong>g> <strong>the</strong> dataset. Most of <strong>the</strong> traitsc<strong>on</strong>tributed to <strong>the</strong> <str<strong>on</strong>g>variati<strong>on</strong></str<strong>on</strong>g> <str<strong>on</strong>g>in</str<strong>on</strong>g> this comp<strong>on</strong>ent. The positivecoefficients for size, growth rate, and phenology traits <str<strong>on</strong>g>in</str<strong>on</strong>g>dicatethat PC1 score <str<strong>on</strong>g>in</str<strong>on</strong>g>creases as <strong>the</strong>se traits <str<strong>on</strong>g>in</str<strong>on</strong>g>crease, and suggestthat this comp<strong>on</strong>ent could be a usable surrogate for plant sizeand vigor. PC2 accounted for 14% of <strong>the</strong> total <str<strong>on</strong>g>variati<strong>on</strong></str<strong>on</strong>g>, andalthough <strong>the</strong> pattern<str<strong>on</strong>g>in</str<strong>on</strong>g>g of coefficients is not as easily <str<strong>on</strong>g>in</str<strong>on</strong>g>terpreted,<strong>the</strong>re was an emphasis <strong>on</strong> flower color traits and size atWRN. The rema<str<strong>on</strong>g>in</str<strong>on</strong>g><str<strong>on</strong>g>in</str<strong>on</strong>g>g 2 comp<strong>on</strong>ents accounted for much less<str<strong>on</strong>g>variati<strong>on</strong></str<strong>on</strong>g> (comb<str<strong>on</strong>g>in</str<strong>on</strong>g>ed about 14%), and <strong>the</strong>re is no clear pattern<str<strong>on</strong>g>in</str<strong>on</strong>g>gto <strong>the</strong> coefficients. C<strong>on</strong>sequently, PC3 and PC4 weredropped from fur<strong>the</strong>r c<strong>on</strong>siderati<strong>on</strong>.Variati<strong>on</strong> <str<strong>on</strong>g>in</str<strong>on</strong>g> comp<strong>on</strong>ent scores am<strong>on</strong>g sources was significantlycorrelated with geographic variables (Table 4), with latitudehav<str<strong>on</strong>g>in</str<strong>on</strong>g>g <strong>the</strong> str<strong>on</strong>gest correlati<strong>on</strong> with PC1 and departurehav<str<strong>on</strong>g>in</str<strong>on</strong>g>g <strong>the</strong> str<strong>on</strong>gest correlati<strong>on</strong> with PC2. Scatter plots ofpr<str<strong>on</strong>g>in</str<strong>on</strong>g>cipal comp<strong>on</strong>ent scores plotted by latitude and departurealso show trends across <strong>the</strong> landscape (Figure 4). Regressi<strong>on</strong>TABLE 1Descripti<strong>on</strong> of traits used to exam<str<strong>on</strong>g>in</str<strong>on</strong>g>e geographic patterns of genetic <str<strong>on</strong>g>variati<strong>on</strong></str<strong>on</strong>g> <str<strong>on</strong>g>in</str<strong>on</strong>g> Lup<str<strong>on</strong>g>in</str<strong>on</strong>g>us <str<strong>on</strong>g>latifolius</str<strong>on</strong>g>.Trait Descripti<strong>on</strong>, locati<strong>on</strong>, z date Measurement unitsCV1H1D1 Crown height-to-diameter ratio, PMC, 7 Jul 1997 cm/mmCV1HT1 Crown height, PMC, 7 Jul 1997 cmCV1HT2 Crown height, PMC, 27 Jul 1997 cmCV1MLD Mildew score, PMC, 3 Sep 1997 0 = n<strong>on</strong>e to 3 = heavyCV1VIG Vigor rat<str<strong>on</strong>g>in</str<strong>on</strong>g>g, PMC, 3 Sep 1997 1 = unthrifty to 5 = vigorousCV1VRATE Rate of crown volume <str<strong>on</strong>g>in</str<strong>on</strong>g>crease, PMC, 1997 cm 3 /dayCV1WHC Amount of white color <str<strong>on</strong>g>in</str<strong>on</strong>g> flowers, PMC, 15 Jun 1997 0 = light to 3 = str<strong>on</strong>gCV2BB Bud burst class, PMC, 17 Mar 1998 1 = dormant to 6 = advancedCV2DI1 Crown diameter, PMC, 20 Apr 1998 mmCV2DI2 Crown diameter, PMC, 15 Jun 1998 mmCV2SH2 Stalk height, PMC, 15 Jun 1998 cmWR1DI2 Crown diameter,WRN, 1997 mmWR1GRS Growth stage,WRN, 15 Sep 1997 1 = green to 5 = senescedWR1H1D1 Crown height-to-diameter ratio,WRN, 20 Jul 1997 cm/mmWR1H2D2 Crown height-to-diameter ratio,WRN, 11 Aug 1997 cm/mmWR1HT2 Crown height,WRN, 11 Aug 1997 cmWR1RDC Amount of red color <str<strong>on</strong>g>in</str<strong>on</strong>g> flowers,WRN, 23 Jun 1997 0 = light to 3 = str<strong>on</strong>gWR1WHC Amount of white color <str<strong>on</strong>g>in</str<strong>on</strong>g> flowers,WRN, 23 Jun 1997 0 = light to 3 = str<strong>on</strong>gWR1V2 Crown volume,WRN, 20 Jul 1997 cm 3WR2BB Bud burst class,WRN, 1 Apr 1998 1 = dormant to 6 = advancedWR2FORM Plant form,WRN, 9 Jul 1998 1 = upright to 5 = prostrateWR2HGT Crown height,WRN, 27 Jul 1997 cmWR2LFW Leaflet width,WRN, 9 Jul 1998 mmFRSTLEAF First true leaf, GRN, 1997 Julian datez PMC = Plant Materials Center, Corvallis, Oreg<strong>on</strong>; WRN = W<str<strong>on</strong>g>in</str<strong>on</strong>g>d River Nursery, Cars<strong>on</strong>,Wash<str<strong>on</strong>g>in</str<strong>on</strong>g>gt<strong>on</strong>; GRN = Greenhouse at PMC42NATIVEPLANTS | SPRING 2005GENETIC VARIATION IN BROADLEAF LUPINE
TABLE 2Overall means, coefficients of <str<strong>on</strong>g>variati<strong>on</strong></str<strong>on</strong>g>, and relative variances (as percentage) for traits measured <str<strong>on</strong>g>in</str<strong>on</strong>g> <strong>the</strong> comm<strong>on</strong>-garden study of Lup<str<strong>on</strong>g>in</str<strong>on</strong>g>us <str<strong>on</strong>g>latifolius</str<strong>on</strong>g> from <strong>Mt</strong> HoodNati<strong>on</strong>al Forest, and 4 pr<str<strong>on</strong>g>in</str<strong>on</strong>g>cipal comp<strong>on</strong>ents.Trait z Mean Coefficient of <str<strong>on</strong>g>variati<strong>on</strong></str<strong>on</strong>g> Total phenotypic <str<strong>on</strong>g>variati<strong>on</strong></str<strong>on</strong>g> y(%)Sources Families (Sources) Plot errorCV1H1D1 0.91 18.8 43.1 ••• x 11.7 • 45.1CV1HT1 23.8 27.0 27.7 ••• 24.4 •• 47.9CV1HT2 31.6 22.6 40.5 ••• 16.9 •• 42.6CV1MLD 1.1 53.3 25.2 ••• 21.7 •• 53.0CV1VIG 3.1 11.5 34.7 ••• 0.0 65.3CV1VRATE 542.4 55.2 30.1 ••• 8.9 60.1CV1WHC 1.7 24.3 40.0 ••• 7.3 52.6CV2BB 3.9 28.2 43.8 ••• 2.2 54.0CV2DI1 23.7 35.3 37.9 ••• 4.1 58.0CV2DI2 58.0 27.3 39.4 ••• 0.0 60.6CV2SH2 40.5 29.1 40.6 ••• 0.0 59.4WR1DI2 21.7 19.7 34.6 ••• 4.2 61.1WR1GRS 3.7 27.3 34.3 ••• 10.9 • 54.8WR1H1D1 1.1 24.6 41.0 ••• 15.2 •• 43.8WR1H2D2 1.1 21.9 36.0 ••• 10.6 • 53.3WR1HT2 22.9 25.9 45.2 ••• 12.2 •• 42.6WR1RDC 1.4 33.6 44.3 ••• 10.8 • 44.9WR1WHC 1.4 31.2 34.4 ••• 6.2 59.4WR1V2 1717.7 43.9 30.5 ••• 5.4 64.1WR2BB 4.3 17.2 35.4 ••• 5.8 58.8WR2FORM 2.6 18.8 50.3 ••• 0.8 49.0WR2HGT 19.5 27.2 47.3 ••• 9.5 • 43.2WR2LFW 10.6 16.6 35.6 ••• 4.0 ns 60.4FRSTLEAF 92.1 4.2 35.8 ••• 28.0 ••• 36.2PC1 0.0 79.7 ••• 20.3PC2 0.0 62.5 ••• 37.5PC3 0.0 53.3 ••• 46.7PC4 0.0 17.0 • 83.0z See Table 1 for trait def<str<strong>on</strong>g>in</str<strong>on</strong>g>iti<strong>on</strong>s.y Calculated as Σ 2TP = Σ 2S + Σ 2F(S) + Σ 2P where Σ 2S = <str<strong>on</strong>g>variati<strong>on</strong></str<strong>on</strong>g> due to source locati<strong>on</strong>, Σ 2F(S) = <str<strong>on</strong>g>variati<strong>on</strong></str<strong>on</strong>g> due to families-with<str<strong>on</strong>g>in</str<strong>on</strong>g>-sources, and Σ 2P = <str<strong>on</strong>g>variati<strong>on</strong></str<strong>on</strong>g> due to plot error.x ••• = P < 0.001; •• = P < 0.01; • =P < 0.05; ns = not significant43DAVID L DOEDE NATIVEPLANTS | SPRING 2005
TABLE 3Pr<str<strong>on</strong>g>in</str<strong>on</strong>g>cipal comp<strong>on</strong>ent analysis of <strong>the</strong> 24 traits used <str<strong>on</strong>g>in</str<strong>on</strong>g> this study, with factor load<str<strong>on</strong>g>in</str<strong>on</strong>g>gs and proporti<strong>on</strong>s of locati<strong>on</strong> <str<strong>on</strong>g>variati<strong>on</strong></str<strong>on</strong>g> expla<str<strong>on</strong>g>in</str<strong>on</strong>g>ed.Trait zFactor load<str<strong>on</strong>g>in</str<strong>on</strong>g>gsPC1 PC2 PC3 PC4CV1H1D1 0.18877 0.12923 -0.35632 -0.08614CV1HT1 0.25167 0.14654 -0.00565 -0.10971CV1HT2 0.27070 -0.03515 -0.02776 -0.02253CV1MLD -0.01777 -0.14292 0.06120 0.63134CV1VIG 0.24935 -0.05391 0.07771 -0.13662CV1VRATE 0.26867 0.07128 0.03361 -0.13339CV1WHC 0.12761 -0.26531 0.16264 0.11600CV2BB 0.22636 -0.17566 0.15862 0.01430CV2DI1 0.25080 -0.08058 0.02488 -0.12305CV2DI2 0.25931 -0.02032 0.06226 -0.07851CV2SH2 0.25831 -0.09111 -0.01800 -0.06485WR1DI2 0.07896 0.29605 0.46914 0.22022WR1GRS 0.05462 0.44274 0.06836 0.13490WR1H1D1 0.23998 0.20432 -0.23075 0.04779WR1H2D2 0.21106 0.14553 -0.34572 0.10030WR1HT2 0.24715 0.27679 -0.01242 0.13539WR1RDC -0.15620 0.27836 -0.01425 -0.36505WR1V2 0.16398 0.33652 0.25854 0.23421WR1WHC 0.17327 -0.30272 0.03854 0.21040WR2BB 0.20490 -0.13906 0.02446 -0.04242WR2FORM -0.16720 0.16398 0.41640 -0.13454WR2HGT 0.26901 -0.00349 0.02168 0.03431WR2LFW 0.11292 -0.24272 0.21026 -0.09674FRSTLEAF -0.14104 0.07065 -0.34641 0.38160Proporti<strong>on</strong> of total 0.4397 0.1384 0.0908 0.0533<str<strong>on</strong>g>variati<strong>on</strong></str<strong>on</strong>g> expla<str<strong>on</strong>g>in</str<strong>on</strong>g>edCumulative proporti<strong>on</strong> 0.4397 0.5781 0.6689 0.7222z See Table 1 for trait def<str<strong>on</strong>g>in</str<strong>on</strong>g>iti<strong>on</strong>s.44NATIVEPLANTS | SPRING 2005GENETIC VARIATION IN BROADLEAF LUPINE
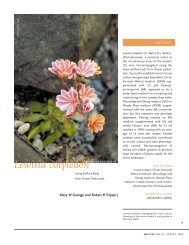
TABLE 4Correlati<strong>on</strong> coefficients (r) between factor scores for 2 pr<str<strong>on</strong>g>in</str<strong>on</strong>g>cipal comp<strong>on</strong>ents and5 geographic and topographic variables.50600005050000PC1 CLASSGeographic or topographic variable PC1 PC2Departure -0.04 -0.55•••Latitude 0.52 ••• -0.15Elevati<strong>on</strong> -0.28 •• -0.33••North–south aspect 0.10 0.10East–west aspect 0.09 -0.08••• = P < 0.001; •• = P < 0.01; • = P < 0.05TABLE 5Latitude504000050300005020000<strong>Mt</strong> Hood50100005000000499000049800004970000570000 580000 590000 600000 610000 620000 630000PC1 score < –2.57PC1 score ≥ –2.57 and < –0.51PC2 CLASSDeparturePC1 score ≥ –0.51 and < 2.68PC1 score > 2.685060000Amounts of <str<strong>on</strong>g>variati<strong>on</strong></str<strong>on</strong>g> am<strong>on</strong>g locati<strong>on</strong>s (percentage of total sums-of-squares)expla<str<strong>on</strong>g>in</str<strong>on</strong>g>ed by geographic, topographic, and climatic variables for 2 pr<str<strong>on</strong>g>in</str<strong>on</strong>g>cipal comp<strong>on</strong>ents.PC Independent variable (sign of coefficient) (%)Latitude50500005040000503000050200005010000<strong>Mt</strong> Hood50000001 Intercept 2.2Annual precipitati<strong>on</strong> (+) 14.4Grow<str<strong>on</strong>g>in</str<strong>on</strong>g>g degree-days (+) 12.8Frost-free days (-) 5.1Annual precip x east–west aspect (-) 2.4Latitude (+) 2.3East–west aspect (+) 2.0Full model (adjusted for number of variables) 46.72 Intercept 2.9Grow<str<strong>on</strong>g>in</str<strong>on</strong>g>g degree-days (-) 5.7Elevati<strong>on</strong> (-) 5.0Frost-free days (+) 4.6Departure (-) 4.6Full model (adjusted for number of variables) 34.0analysis revealed that moderate amounts of <strong>the</strong> <str<strong>on</strong>g>variati<strong>on</strong></str<strong>on</strong>g> <str<strong>on</strong>g>in</str<strong>on</strong>g>PC1 could be expla<str<strong>on</strong>g>in</str<strong>on</strong>g>ed by climatic, geographic, and topographicvariables (Table 5). Total precipitati<strong>on</strong> and grow<str<strong>on</strong>g>in</str<strong>on</strong>g>gdegree-days were <strong>the</strong> most important <str<strong>on</strong>g>in</str<strong>on</strong>g>dependent variables,account<str<strong>on</strong>g>in</str<strong>on</strong>g>g for approximately 28% and 25% of <strong>the</strong> modelsums-of-squares, respectively. As <strong>on</strong>e would expect, PC1 score(or plant size and vigor) <str<strong>on</strong>g>in</str<strong>on</strong>g>creased as precipitati<strong>on</strong> and grow<str<strong>on</strong>g>in</str<strong>on</strong>g>gdays <str<strong>on</strong>g>in</str<strong>on</strong>g>creased, and as aspect became more favorable (eastor nor<strong>the</strong>ast). Of <strong>the</strong> source <str<strong>on</strong>g>variati<strong>on</strong></str<strong>on</strong>g> <str<strong>on</strong>g>in</str<strong>on</strong>g> PC2, 34% could beexpla<str<strong>on</strong>g>in</str<strong>on</strong>g>ed by frost-free period, grow<str<strong>on</strong>g>in</str<strong>on</strong>g>g degree-days, departure,and elevati<strong>on</strong>, each account<str<strong>on</strong>g>in</str<strong>on</strong>g>g for approximately 25% of<strong>the</strong> model sums-of-squares.499000049800004970000570000 580000 590000PC1 score < –1.34PC1 score ≥ –1.34 and < 0.30600000 610000 620000 630000DeparturePC1 score ≥ 0.30 and < 1.38PC1 score > 1.38Figure 4. Pr<str<strong>on</strong>g>in</str<strong>on</strong>g>cipal comp<strong>on</strong>ent scores (PC), divided <str<strong>on</strong>g>in</str<strong>on</strong>g>to 4 classes, plotted by latitudeand departure. Pr<str<strong>on</strong>g>in</str<strong>on</strong>g>cipal comp<strong>on</strong>ent 1 (top). Pr<str<strong>on</strong>g>in</str<strong>on</strong>g>cipal comp<strong>on</strong>ent 2 (bottom).Results of analyses <strong>on</strong> watershed and plant associati<strong>on</strong>series classificati<strong>on</strong> models are shown <str<strong>on</strong>g>in</str<strong>on</strong>g> Table 6. All levels ofwatershed subdivisi<strong>on</strong> were significant effects for PC1 andPC2 account<str<strong>on</strong>g>in</str<strong>on</strong>g>g for 61% and 57% of <strong>the</strong> sums of squares forsources, respectively. The rema<str<strong>on</strong>g>in</str<strong>on</strong>g><str<strong>on</strong>g>in</str<strong>on</strong>g>g source <str<strong>on</strong>g>variati<strong>on</strong></str<strong>on</strong>g>, or lackof fit, was significant for both comp<strong>on</strong>ents, signify<str<strong>on</strong>g>in</str<strong>on</strong>g>g <strong>the</strong>rewere o<strong>the</strong>r important variables, such as aspect or soil type, not<str<strong>on</strong>g>in</str<strong>on</strong>g>cluded <str<strong>on</strong>g>in</str<strong>on</strong>g> <strong>the</strong> model. Interest<str<strong>on</strong>g>in</str<strong>on</strong>g>gly, elevati<strong>on</strong> was not a significanteffect <str<strong>on</strong>g>in</str<strong>on</strong>g> classificati<strong>on</strong> models, nor <str<strong>on</strong>g>in</str<strong>on</strong>g> <strong>the</strong> regressi<strong>on</strong>model for PC1. Source locati<strong>on</strong> effects were c<strong>on</strong>sistentlysmaller <str<strong>on</strong>g>in</str<strong>on</strong>g> <strong>the</strong> watershed model, <str<strong>on</strong>g>in</str<strong>on</strong>g>dicat<str<strong>on</strong>g>in</str<strong>on</strong>g>g it expla<str<strong>on</strong>g>in</str<strong>on</strong>g>ed genetic<str<strong>on</strong>g>variati<strong>on</strong></str<strong>on</strong>g> better than <strong>the</strong> plant associati<strong>on</strong> model.In <strong>the</strong> plant associati<strong>on</strong> models, associati<strong>on</strong>s were significant<strong>on</strong>ly for PC2, as were elevati<strong>on</strong> bands. Source effects weresignificant and large for both PCs, and because <strong>the</strong> watershedmodels had c<strong>on</strong>sistently less lack-of-fit, plant associati<strong>on</strong>models were not explored any fur<strong>the</strong>r.The stepwise selecti<strong>on</strong> procedure selected 8 traits to use <str<strong>on</strong>g>in</str<strong>on</strong>g> <strong>the</strong>discrim<str<strong>on</strong>g>in</str<strong>on</strong>g>ant functi<strong>on</strong>: 1) <strong>the</strong> amount of red color <str<strong>on</strong>g>in</str<strong>on</strong>g> flowers atWRN; 2) <strong>the</strong> amount of red color <str<strong>on</strong>g>in</str<strong>on</strong>g> flowers at PMC; 3) <strong>the</strong>45DAVID L DOEDE NATIVEPLANTS | SPRING 2005
46TABLE 6Comparis<strong>on</strong> of watershed and plant associati<strong>on</strong> classificati<strong>on</strong> models used toexpla<str<strong>on</strong>g>in</str<strong>on</strong>g> <str<strong>on</strong>g>variati<strong>on</strong></str<strong>on</strong>g> am<strong>on</strong>g sources <str<strong>on</strong>g>in</str<strong>on</strong>g> 2 pr<str<strong>on</strong>g>in</str<strong>on</strong>g>cipal comp<strong>on</strong>ents.Effect Number Proporti<strong>on</strong> of sourceclasses<str<strong>on</strong>g>variati<strong>on</strong></str<strong>on</strong>g> (%) zPC1 PC2Watershed ModelFourth field watershed 4 12.3 ••• 12.5 •••Fifth field watershed 13 28.6 ••• 23.0 ••Elevati<strong>on</strong> 5 2.0 6.7Sixth field watershed 24 20.1 • 21.9 ••Source 84 37.0 ••• 35.9 ••Plant Associati<strong>on</strong> ModelPlant Associati<strong>on</strong> 6 2.8 20.9 ••Elevati<strong>on</strong> 5 25.4 •• 22.3 ••Source 84 71.8 ••• 56.8 •••z Percentage of sums of squares for sources.••• = P < 0.001; •• = P < 0.01; • = P < 0.05amount of blue color at PMC; 4) ratios of first-year crownheight and diameter at WRN; 5) <strong>the</strong> same ratios at PMC; 6) sec<strong>on</strong>d-yearcrown height at PMC; 7) sec<strong>on</strong>d-year crown diameterat PMC; and 8) <strong>the</strong> amount of fall regrowth at PMC. Probabilitiesof correct classificati<strong>on</strong> were very high (probabilities were100% for 74 of 84 sources), however <strong>the</strong> discrim<str<strong>on</strong>g>in</str<strong>on</strong>g>ant analysiswas not able to reflect <strong>the</strong> same variability <str<strong>on</strong>g>in</str<strong>on</strong>g> cytotype with<str<strong>on</strong>g>in</str<strong>on</strong>g>sources as was seen <str<strong>on</strong>g>in</str<strong>on</strong>g> <strong>the</strong> isozyme analysis. C<strong>on</strong>sequently thiswas not pursued fur<strong>the</strong>r. If variability <str<strong>on</strong>g>in</str<strong>on</strong>g> cytotype is noted for aspecies, any future studies <str<strong>on</strong>g>in</str<strong>on</strong>g> genetic <str<strong>on</strong>g>variati<strong>on</strong></str<strong>on</strong>g> for that speciesshould quantify or score <strong>the</strong> cytotype of <str<strong>on</strong>g>in</str<strong>on</strong>g>dividual plants, asstudies <str<strong>on</strong>g>in</str<strong>on</strong>g> o<strong>the</strong>r herbaceous species have shown chromosomenumber to be of some adaptive importance (Burt<strong>on</strong> and Husband1999, 2000; Cr<strong>on</strong>n 2004).DISCUSSIONThis study found significant amounts of source-related genetic<str<strong>on</strong>g>variati<strong>on</strong></str<strong>on</strong>g> <str<strong>on</strong>g>in</str<strong>on</strong>g> broadleaf lup<str<strong>on</strong>g>in</str<strong>on</strong>g>e, and fur<strong>the</strong>rmore, that patterns ofgenetic <str<strong>on</strong>g>variati<strong>on</strong></str<strong>on</strong>g> am<strong>on</strong>g sources corresp<strong>on</strong>d to patterns <str<strong>on</strong>g>in</str<strong>on</strong>g>envir<strong>on</strong>mental and geographic <str<strong>on</strong>g>variati<strong>on</strong></str<strong>on</strong>g>.The pattern<str<strong>on</strong>g>in</str<strong>on</strong>g>g of source <str<strong>on</strong>g>variati<strong>on</strong></str<strong>on</strong>g>, particularly <str<strong>on</strong>g>in</str<strong>on</strong>g> PC1,al<strong>on</strong>g moisture and precipitati<strong>on</strong> gradients suggests that plantperformance is related to local c<strong>on</strong>diti<strong>on</strong>s at <strong>the</strong> seed source,and that n<strong>on</strong>local seed sources may or may not perform as wellas <strong>the</strong> local seed source. This means that seeds should not bemoved <str<strong>on</strong>g>in</str<strong>on</strong>g>discrim<str<strong>on</strong>g>in</str<strong>on</strong>g>ately, and some level of c<strong>on</strong>trol should beexercised <strong>on</strong> seed transfers. At <strong>the</strong> same time, <strong>the</strong> levels ofwith<str<strong>on</strong>g>in</str<strong>on</strong>g> family and family <str<strong>on</strong>g>variati<strong>on</strong></str<strong>on</strong>g> with<str<strong>on</strong>g>in</str<strong>on</strong>g> each source show<strong>the</strong>re is abundant genetic <str<strong>on</strong>g>variati<strong>on</strong></str<strong>on</strong>g> with<str<strong>on</strong>g>in</str<strong>on</strong>g> sources, and somedegree of transfer should be acceptable.Under natural regenerati<strong>on</strong>, many seeds will drop to <strong>the</strong>ground and sprout for each mature plant that develops. Forexample, Campbell (1979) estimated that a Douglas-fir <str<strong>on</strong>g>in</str<strong>on</strong>g> anold-growth forest is probably selected from more than 2000seedl<str<strong>on</strong>g>in</str<strong>on</strong>g>gs. A certa<str<strong>on</strong>g>in</str<strong>on</strong>g> amount of natural reproducti<strong>on</strong> will be maladapteddue to <str<strong>on</strong>g>in</str<strong>on</strong>g>breed<str<strong>on</strong>g>in</str<strong>on</strong>g>g, migrati<strong>on</strong>, drift, and recomb<str<strong>on</strong>g>in</str<strong>on</strong>g>ati<strong>on</strong>dur<str<strong>on</strong>g>in</str<strong>on</strong>g>g meiosis. Some reproducti<strong>on</strong>, possibly more than half, willdie by chance, buried by fall<str<strong>on</strong>g>in</str<strong>on</strong>g>g debris, mov<str<strong>on</strong>g>in</str<strong>on</strong>g>g soil, predati<strong>on</strong>,and so <strong>on</strong>. Never<strong>the</strong>less, natural th<str<strong>on</strong>g>in</str<strong>on</strong>g>n<str<strong>on</strong>g>in</str<strong>on</strong>g>g between seedl<str<strong>on</strong>g>in</str<strong>on</strong>g>g andmature plant results <str<strong>on</strong>g>in</str<strong>on</strong>g> a large amount of natural selecti<strong>on</strong> act<str<strong>on</strong>g>in</str<strong>on</strong>g>gto produce <str<strong>on</strong>g>variati<strong>on</strong></str<strong>on</strong>g> am<strong>on</strong>g and with<str<strong>on</strong>g>in</str<strong>on</strong>g> sourcesImplicati<strong>on</strong>s for Seed TransferRelative seed transfer risk was quantified by compar<str<strong>on</strong>g>in</str<strong>on</strong>g>g <strong>the</strong>phenotypic <str<strong>on</strong>g>variati<strong>on</strong></str<strong>on</strong>g> with<str<strong>on</strong>g>in</str<strong>on</strong>g> a def<str<strong>on</strong>g>in</str<strong>on</strong>g>ed seed z<strong>on</strong>e to <strong>the</strong> averagegenetic <str<strong>on</strong>g>variati<strong>on</strong></str<strong>on</strong>g> with<str<strong>on</strong>g>in</str<strong>on</strong>g> a source locati<strong>on</strong>. What c<strong>on</strong>stitutes anacceptable level of risk will probably vary depend<str<strong>on</strong>g>in</str<strong>on</strong>g>g <strong>on</strong> <strong>the</strong>objectives for seedl<str<strong>on</strong>g>in</str<strong>on</strong>g>g outplant<str<strong>on</strong>g>in</str<strong>on</strong>g>g, availability of seeds andresources, and <strong>the</strong> philosophy of <strong>the</strong> organizati<strong>on</strong>. Sorensen andWeber (1994) suggested an upper limit for risk of 0.51 for reforestati<strong>on</strong>practices, based <strong>on</strong> f<str<strong>on</strong>g>in</str<strong>on</strong>g>al desired crop density adjustedfor mortality occurr<str<strong>on</strong>g>in</str<strong>on</strong>g>g throughout <strong>the</strong> life span of <strong>the</strong> plant<str<strong>on</strong>g>in</str<strong>on</strong>g>g.Follow<str<strong>on</strong>g>in</str<strong>on</strong>g>g a similar methodology, I arrived at an upper level forrisk of 0.61. Assumpti<strong>on</strong>s <str<strong>on</strong>g>in</str<strong>on</strong>g>cluded a f<str<strong>on</strong>g>in</str<strong>on</strong>g>al crop density of 47 840plants/ha (19 360/ac) <strong>on</strong> a 46-cm (18-<str<strong>on</strong>g>in</str<strong>on</strong>g>) spac<str<strong>on</strong>g>in</str<strong>on</strong>g>g; 76 289 seeds/kg(34 699/lb); broadcast sow<str<strong>on</strong>g>in</str<strong>on</strong>g>g at 22.4 kg/ha (20 lb/ac); 80% germ<str<strong>on</strong>g>in</str<strong>on</strong>g>ati<strong>on</strong>rate; and 90% fall-down (10% success) because of<str<strong>on</strong>g>in</str<strong>on</strong>g>correct plant<str<strong>on</strong>g>in</str<strong>on</strong>g>g depth, desiccati<strong>on</strong>, predati<strong>on</strong>, and fungalpathogens (Darris 2004). These assumpti<strong>on</strong>s resulted <str<strong>on</strong>g>in</str<strong>on</strong>g> aneed for 35% of <strong>the</strong> seeds sown to become established(47 840/[7620 • 22.4 • 0.8 • 0.1] = 0.349), and 65% expendable.The difference between an R of 0.61 and <strong>the</strong> 65% that can be lostprovides an additi<strong>on</strong>al small cushi<strong>on</strong> for <strong>the</strong> unexpected.Transfer risk was estimated for several different seed z<strong>on</strong>estrategies (Table 7). The strategies were chosen to display arange of opti<strong>on</strong>s for limit<str<strong>on</strong>g>in</str<strong>on</strong>g>g seed transfer effects and weresuggested by results of regressi<strong>on</strong> and classificati<strong>on</strong> analyses.While climatic variables, such as grow<str<strong>on</strong>g>in</str<strong>on</strong>g>g degree-days andannual precipitati<strong>on</strong>, were important explanatory variables <str<strong>on</strong>g>in</str<strong>on</strong>g>regressi<strong>on</strong> analyses, this data is not comm<strong>on</strong>ly available tofield pers<strong>on</strong>nel. C<strong>on</strong>sequently geographic land divisi<strong>on</strong>s, suchas <strong>the</strong> watershed del<str<strong>on</strong>g>in</str<strong>on</strong>g>eati<strong>on</strong>s, were used as a c<strong>on</strong>venient, readilyavailable method for c<strong>on</strong>struct<str<strong>on</strong>g>in</str<strong>on</strong>g>g z<strong>on</strong>es. It should bestressed that <strong>the</strong> calculated risks are relative, have not beenfield-tested, and <strong>the</strong> utility of <strong>the</strong>se estimates is primarily <str<strong>on</strong>g>in</str<strong>on</strong>g>compar<str<strong>on</strong>g>in</str<strong>on</strong>g>g <strong>the</strong> effectiveness of different strategies.When seeds are collected from and freely moved aboutwith<str<strong>on</strong>g>in</str<strong>on</strong>g> <strong>the</strong> entire <strong>Mt</strong> Hood Nati<strong>on</strong>al Forest, <strong>the</strong> proporti<strong>on</strong> ofNATIVEPLANTS | SPRING 2005GENETIC VARIATION IN BROADLEAF LUPINE
TABLE 7Relative risk (R) estimates for seed transfer z<strong>on</strong>es for Lup<str<strong>on</strong>g>in</str<strong>on</strong>g>us <str<strong>on</strong>g>latifolius</str<strong>on</strong>g> <strong>on</strong> <strong>the</strong> <strong>Mt</strong>Hood Nati<strong>on</strong>al Forest.Effect R for PC1 R for PC2 Comb<str<strong>on</strong>g>in</str<strong>on</strong>g>ed RNo subdivisi<strong>on</strong> 0.048 0.035 0.66Fourth field watersheds 0.040 0.031 0.059Fifth field watersheds 0.033 0.024 0.049Sixth field watersheds 0.027 0.020 0.042a seedlot outside <strong>the</strong> genetic distributi<strong>on</strong> at <strong>the</strong> plant<str<strong>on</strong>g>in</str<strong>on</strong>g>g locati<strong>on</strong>is 66%. Look<str<strong>on</strong>g>in</str<strong>on</strong>g>g at it ano<strong>the</strong>r way, 34% of <strong>the</strong> seed populati<strong>on</strong>is still with<str<strong>on</strong>g>in</str<strong>on</strong>g> <strong>the</strong> genetic distributi<strong>on</strong> at <strong>the</strong> plant<str<strong>on</strong>g>in</str<strong>on</strong>g>glocati<strong>on</strong>, attest<str<strong>on</strong>g>in</str<strong>on</strong>g>g to <strong>the</strong> significant amounts of genetic <str<strong>on</strong>g>variati<strong>on</strong></str<strong>on</strong>g>with<str<strong>on</strong>g>in</str<strong>on</strong>g> local populati<strong>on</strong>s of this species.The most c<strong>on</strong>servative strategy, collect<str<strong>on</strong>g>in</str<strong>on</strong>g>g and deploy<str<strong>on</strong>g>in</str<strong>on</strong>g>gseeds with<str<strong>on</strong>g>in</str<strong>on</strong>g> a sixth field watershed (<strong>the</strong> smallest watersheddivisi<strong>on</strong>), had a relative risk of 0.42. This strategy would berelatively expensive, and necessitate us<str<strong>on</strong>g>in</str<strong>on</strong>g>g 87 seed z<strong>on</strong>es for<strong>the</strong> entire <strong>Mt</strong> Hood Nati<strong>on</strong>al Forest. However, if <strong>the</strong> objectivefor outplant<str<strong>on</strong>g>in</str<strong>on</strong>g>g was to mimic exist<str<strong>on</strong>g>in</str<strong>on</strong>g>g patterns of genetic <str<strong>on</strong>g>variati<strong>on</strong></str<strong>on</strong>g>,this gives an idea of <strong>the</strong> amount of mismatch <strong>the</strong>rewould be <str<strong>on</strong>g>in</str<strong>on</strong>g> a collecti<strong>on</strong> area this size.Us<str<strong>on</strong>g>in</str<strong>on</strong>g>g fifth field watersheds is very similar to <strong>the</strong> exist<str<strong>on</strong>g>in</str<strong>on</strong>g>gseed collecti<strong>on</strong> and deployment policy of <strong>the</strong> USDA ForestService. Risk associated with mov<str<strong>on</strong>g>in</str<strong>on</strong>g>g seeds with<str<strong>on</strong>g>in</str<strong>on</strong>g> <strong>the</strong>se del<str<strong>on</strong>g>in</str<strong>on</strong>g>eati<strong>on</strong>sis 0.49, fairly c<strong>on</strong>servative when compared to <strong>the</strong> 0.61allowable risk calculated us<str<strong>on</strong>g>in</str<strong>on</strong>g>g <strong>the</strong> procedure outl<str<strong>on</strong>g>in</str<strong>on</strong>g>ed above.It would result <str<strong>on</strong>g>in</str<strong>on</strong>g> 31 seed z<strong>on</strong>es to cover <strong>the</strong> entire forest.Fourth field watersheds are recommended for seed z<strong>on</strong>esfor this species <strong>on</strong> <strong>the</strong> <strong>Mt</strong> Hood Nati<strong>on</strong>al Forest (Figure 1).Risk for this level of geographic subdivisi<strong>on</strong> is 0.59, below <strong>the</strong>upper allowable transfer risk of 0.61. This strategy wouldrequire <strong>on</strong>ly 4 seed z<strong>on</strong>es, and provides a reas<strong>on</strong>able compromisebetween ma<str<strong>on</strong>g>in</str<strong>on</strong>g>ta<str<strong>on</strong>g>in</str<strong>on</strong>g><str<strong>on</strong>g>in</str<strong>on</strong>g>g many locally adapted seedlots andkeep<str<strong>on</strong>g>in</str<strong>on</strong>g>g management costs for collecti<strong>on</strong> and ma<str<strong>on</strong>g>in</str<strong>on</strong>g>tenancelow. Seeds should be collected from several sites (10 to 16) tosample with<str<strong>on</strong>g>in</str<strong>on</strong>g>-z<strong>on</strong>e <str<strong>on</strong>g>variati<strong>on</strong></str<strong>on</strong>g>, but a large number of sitesshould not be necessary because of moderate amounts ofwith<str<strong>on</strong>g>in</str<strong>on</strong>g>-source <str<strong>on</strong>g>variati<strong>on</strong></str<strong>on</strong>g> found <str<strong>on</strong>g>in</str<strong>on</strong>g> this study and <str<strong>on</strong>g>in</str<strong>on</strong>g> allozymes(Wils<strong>on</strong> and Hipk<str<strong>on</strong>g>in</str<strong>on</strong>g>s 2002). With<str<strong>on</strong>g>in</str<strong>on</strong>g> a source, many plants,perhaps as many as 30 to 50, should be collected from to adequatelysample with<str<strong>on</strong>g>in</str<strong>on</strong>g>-source genetic <str<strong>on</strong>g>variati<strong>on</strong></str<strong>on</strong>g>.ACKNOWLEDGMENTSJoan Tr<str<strong>on</strong>g>in</str<strong>on</strong>g>dle and Dale Darris provided excellent field andtechnical assistance, and Caitl<str<strong>on</strong>g>in</str<strong>on</strong>g> Cray coord<str<strong>on</strong>g>in</str<strong>on</strong>g>ated <strong>the</strong> field47DAVID L DOEDE NATIVEPLANTS | SPRING 2005
collecti<strong>on</strong>s. All are gratefully acknowledged. Frank Sorensen,Nancy Mandel, and Rich Cr<strong>on</strong>n provided valuable <str<strong>on</strong>g>in</str<strong>on</strong>g>sights andcomments throughout <strong>the</strong> entire project, thank you. This projectwas funded by <strong>the</strong> USDA Forest Service.REFERENCESBurt<strong>on</strong> TL, Husband BC. 1999. Populati<strong>on</strong> cytotype structure <str<strong>on</strong>g>in</str<strong>on</strong>g> <strong>the</strong> polyploidGalax urceolata (Diapensiaceae). Heredity 82:381–390.Burt<strong>on</strong> TL, Husband BC. 2000. Fitness differences am<strong>on</strong>g diploids, tetraploids, and<strong>the</strong>ir triploid progeny <str<strong>on</strong>g>in</str<strong>on</strong>g> Chameri<strong>on</strong> angustifolium:mechanisms of <str<strong>on</strong>g>in</str<strong>on</strong>g>viability andimplicati<strong>on</strong>s for polyploid evoluti<strong>on</strong>. Evoluti<strong>on</strong> 54(4):1182–1191.Campbell RK. 1975. Adaptati<strong>on</strong>al requirements of plant<str<strong>on</strong>g>in</str<strong>on</strong>g>g stock. In: Globalforestry and <strong>the</strong> western role, 1975 Permanent Associati<strong>on</strong> CommitteesProceed<str<strong>on</strong>g>in</str<strong>on</strong>g>gs. Portland (OR):Western Forestry and C<strong>on</strong>servati<strong>on</strong> Associati<strong>on</strong>.p 103–107.Campbell RK. 1979. Genecology of Douglas-fir <str<strong>on</strong>g>in</str<strong>on</strong>g> a watershed <strong>on</strong> <strong>the</strong> Oreg<strong>on</strong>Cascades. Ecology 60:1036–1050.Campbell RK. 1986. Mapped genetic <str<strong>on</strong>g>variati<strong>on</strong></str<strong>on</strong>g> to guide seed transfer <str<strong>on</strong>g>in</str<strong>on</strong>g> southwestOreg<strong>on</strong>. Silvae <str<strong>on</strong>g>Genetic</str<strong>on</strong>g>a 35:85–96.Campbell RK, Sorensen FC. 1978. Effect of test envir<strong>on</strong>ment <strong>on</strong> expressi<strong>on</strong> ofcl<str<strong>on</strong>g>in</str<strong>on</strong>g>es and <strong>on</strong> delimitati<strong>on</strong> of seed z<strong>on</strong>es <str<strong>on</strong>g>in</str<strong>on</strong>g> Douglas-fir. Theoretical andApplied <str<strong>on</strong>g>Genetic</str<strong>on</strong>g>s 51:233–246.Campbell RK, Sugano AI. 1979. Genecology of bud-burst phenology <str<strong>on</strong>g>in</str<strong>on</strong>g> Douglas-fir:resp<strong>on</strong>se to flush<str<strong>on</strong>g>in</str<strong>on</strong>g>g temperature and chill<str<strong>on</strong>g>in</str<strong>on</strong>g>g. Botanical Gazette140(2):223–231.Cr<strong>on</strong>n R. 2004. Pers<strong>on</strong>al communicati<strong>on</strong>. Corvallis (OR): USDA Forest ServicePacific Northwest Research Stati<strong>on</strong>. Plant <str<strong>on</strong>g>Genetic</str<strong>on</strong>g>ist.Daly C, Niels<strong>on</strong> RP, Phillips DL. 1994.A statistical-topographic model for mapp<str<strong>on</strong>g>in</str<strong>on</strong>g>gclimatological precipitati<strong>on</strong> over mounta<str<strong>on</strong>g>in</str<strong>on</strong>g>ous terra<str<strong>on</strong>g>in</str<strong>on</strong>g>. Journal ofApplied Meteorology 33:140–158.Darris D. 2004. Pers<strong>on</strong>al communicati<strong>on</strong>. Corvallis (OR): USDA NaturalResources C<strong>on</strong>servati<strong>on</strong> Service Plant Materials Center. C<strong>on</strong>servati<strong>on</strong>Agr<strong>on</strong>omist.Hall FC. 1998. Pacific Northwest ecoclass codes for seral and potential naturalcommunities. Portland (OR). USDA Forest Service, Pacific NorthwestResearch Stati<strong>on</strong>. General Technical Report PNW-GTR-418. 290 p.Kittels<strong>on</strong> PM, Mar<strong>on</strong> JL. 2001. F<str<strong>on</strong>g>in</str<strong>on</strong>g>e-scale genetically based differentiati<strong>on</strong> oflife-history traits <str<strong>on</strong>g>in</str<strong>on</strong>g> <strong>the</strong> perennial shrub Lup<str<strong>on</strong>g>in</str<strong>on</strong>g>us arboreus. Evoluti<strong>on</strong>55(12):2429–2438.Knapp EE, Rice KJ. 1994. Start<str<strong>on</strong>g>in</str<strong>on</strong>g>g from seed, genetic issues <str<strong>on</strong>g>in</str<strong>on</strong>g> us<str<strong>on</strong>g>in</str<strong>on</strong>g>g nativegrasses for restorati<strong>on</strong>. Restorati<strong>on</strong> and Management Notes 12(1):40–45.M<strong>on</strong>talvo AM, Ellstrand NC. 2000.Transplantati<strong>on</strong> of <strong>the</strong> subshrub Lotus scoparius:test<str<strong>on</strong>g>in</str<strong>on</strong>g>g <strong>the</strong> home-site advantage hypo<strong>the</strong>sis. C<strong>on</strong>servati<strong>on</strong> Biology14(4):1034–1045.Millar CI, Libby WJ. 1989. Disneyland or native ecosystem: genetics and <strong>the</strong>restorati<strong>on</strong>ist. Restorati<strong>on</strong> and Management Notes 7(1):18–24.Phillips LL. 1957. Chromosome numbers <str<strong>on</strong>g>in</str<strong>on</strong>g> Lup<str<strong>on</strong>g>in</str<strong>on</strong>g>us. Madr<strong>on</strong>o 14:30–36.Rehfeldt GE. 1978. <str<strong>on</strong>g>Genetic</str<strong>on</strong>g> differentiati<strong>on</strong> of Douglas-fir from <strong>the</strong> nor<strong>the</strong>rnRocky Mounta<str<strong>on</strong>g>in</str<strong>on</strong>g>s. Ecology 59(6):1264–1270.Rehfeldt GE. 1984. Microevoluti<strong>on</strong> of c<strong>on</strong>ifers <str<strong>on</strong>g>in</str<strong>on</strong>g> <strong>the</strong> nor<strong>the</strong>rn Rocky Mounta<str<strong>on</strong>g>in</str<strong>on</strong>g>s:a view from comm<strong>on</strong> gardens. In: Lanner RM, editor. Symposium proceed<str<strong>on</strong>g>in</str<strong>on</strong>g>gsof <strong>the</strong> 8th North American forest biology workshop; 1984;Logan, UT. Logan (UT): Utah State University, Department of ForestResources. p 132–146.SAS Institute Inc. 1999. SAS/STAT user’s guide, versi<strong>on</strong> 8. Cary (NC): SASInstitute Inc.Sorensen FC,Weber JC. 1994. <str<strong>on</strong>g>Genetic</str<strong>on</strong>g> <str<strong>on</strong>g>variati<strong>on</strong></str<strong>on</strong>g> and seed transfer guidel<str<strong>on</strong>g>in</str<strong>on</strong>g>esfor p<strong>on</strong>derosa p<str<strong>on</strong>g>in</str<strong>on</strong>g>e <str<strong>on</strong>g>in</str<strong>on</strong>g> <strong>the</strong> Ochoco and Malhuer Nati<strong>on</strong>al Forests of centralOreg<strong>on</strong>. Portland (OR): USDA Forest Service, Pacific NorthwestResearch Stati<strong>on</strong>. Research Paper PNW-RP-468. 30 p.[USDA NRCS] USDA Natural Resources C<strong>on</strong>servati<strong>on</strong> Service. 2004. ThePLANTS database, versi<strong>on</strong> 3.5. URL: http://plants.usda.gov (accessed 12Apr 2004). Bat<strong>on</strong> Rouge (LA) Nati<strong>on</strong>al Plant Data Center.[USDI] US Department of <strong>the</strong> Interior, Geological Survey. 1976. State of Oreg<strong>on</strong>,Hydrologic Unit Map. US Water Resources Council. Rest<strong>on</strong> (VA): USGeological Survey.Wils<strong>on</strong> BL, Hipk<str<strong>on</strong>g>in</str<strong>on</strong>g>s VD. 2002. <str<strong>on</strong>g>Genetic</str<strong>on</strong>g> diversity <str<strong>on</strong>g>in</str<strong>on</strong>g> broadleaf lup<str<strong>on</strong>g>in</str<strong>on</strong>g>e (Lup<str<strong>on</strong>g>in</str<strong>on</strong>g>us <str<strong>on</strong>g>latifolius</str<strong>on</strong>g>)accessi<strong>on</strong>s from <strong>the</strong> <strong>Mt</strong>. Hood Nati<strong>on</strong>al Forest. Placerville (CA):Nati<strong>on</strong>al Forest Gel Electrophoresis Laboratory.A UTHOR INFORMATIONDavid L DoedeArea <str<strong>on</strong>g>Genetic</str<strong>on</strong>g>istUSDA Forest ServiceGifford P<str<strong>on</strong>g>in</str<strong>on</strong>g>chot Nati<strong>on</strong>al Forest<strong>Mt</strong> Adams Ranger District2455 Hwy 141Trout Lake,WA 98650ddoede@fs.fed.us48NATIVEPLANTS | SPRING 2005GENETIC VARIATION IN BROADLEAF LUPINE