The BRICS Securities and Derivatives Markets - Hong Kong ...
The BRICS Securities and Derivatives Markets - Hong Kong ...
The BRICS Securities and Derivatives Markets - Hong Kong ...

You also want an ePaper? Increase the reach of your titles
YUMPU automatically turns print PDFs into web optimized ePapers that Google loves.
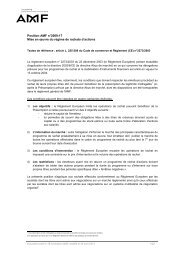
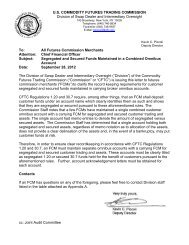
US$ billionNYSE Euronext (US)NASDAQ OMX (US)LSE Group (UK & Italy)Tokyo SENYSE Euronext (Europe)HKExShanghai SETMX GroupDeutsche BoerseASX (Australia)BSE (Mumbai)SIX Swiss ExchangeBM&FBOVESPAKorea ExchangeShenzhen SESpanish ExchangesNASDAQ OMX(Nordic)Johannesburg SEMoscow ExchangeSingapore Exchange<strong>The</strong> <strong>BRICS</strong> <strong>Securities</strong> <strong>and</strong> <strong>Derivatives</strong> <strong>Markets</strong>(WFE) statistics, exchanges from these five countries are among the top 20 in terms of marketvalue of domestic listed companies <strong>and</strong> contract volume of financial derivatives (see Figures1-1 <strong>and</strong> 1-2).CountryTable 1-1. GDP in <strong>BRICS</strong> countries (2002 vs 2011)GDP (current prices, US$ billion)% of global GDP2002 2011 % change 2002 2011China 1,454 7,298 402% 4.4% 10.4%Brazil 506 2,493 393% 1.5% 3.6%Russia 345 1,850 436% 1.0% 2.6%India 510 1,827 258% 1.5% 2.6%South Africa 111 409 267% 0.3% 0.6%<strong>BRICS</strong> 2,926 13,877 374% 8.8% 19.9%Rest of the world 30,428 56,022 84% 91.2% 80.1%All countries 33,355 69,899 110% 100.0% 100.0%Source: International Monetary Fund (IMF), World Economic Outlook Database, October 2012Figure 1-1. Top 20 exchanges in terms of market value of domestic listed companiesTop 20 exchanges by market (end of value October of domestic 2012) listed shares (October 2012)16,00014,00013,62512,00010,0008,0006,0004,0004,5263,526 3,2752,677 2,6332,314 2,0441,392 1,348 1,203 1,176 1,162 1,114 1,098 964 933 835 767 7412,0000<strong>BRICS</strong> marketsSource: WFE monthly statistics- 2 - Research & Corporate Development, HKEx31 December 2012