The BRICS Securities and Derivatives Markets - Hong Kong ...
The BRICS Securities and Derivatives Markets - Hong Kong ...
The BRICS Securities and Derivatives Markets - Hong Kong ...

You also want an ePaper? Increase the reach of your titles
YUMPU automatically turns print PDFs into web optimized ePapers that Google loves.
THE <strong>BRICS</strong> SECURITIES AND DERIVATIVESMARKETSBy Research & Corporate Development 31 December 2012<strong>The</strong> <strong>BRICS</strong> Exchange Alliance was announced in October 2011. Member exchangeshave begun cross-listing their respective benchmark equity index derivatives, <strong>and</strong> areplanning to develop new equity index products together. This paper briefly describes eachmarket in the alliance – the key exchanges <strong>and</strong> their market segments, product offerings,<strong>and</strong> latest international cooperation initiatives.<strong>The</strong> <strong>BRICS</strong> 1 acronym refers to the five developing countries — Brazil, Russia, India, China<strong>and</strong> South Africa — which have attracted attention because of their growth potential. InOctober 2011, <strong>Hong</strong> <strong>Kong</strong> Exchanges <strong>and</strong> Clearing Limited (HKEx) in the Chinese economy<strong>and</strong> exchanges from the other <strong>BRICS</strong> countries — BM&FBOVESPA from Brazil, MoscowInterbank Currency Exchange (MICEX, now Moscow Exchange MICEX-RTS) from Russia,BSE Limited (BSE) <strong>and</strong> the National Stock Exchange of India (NSE) from India, <strong>and</strong> theJohannesburg Stock Exchange (JSE) from South Africa — announced the formation of<strong>BRICS</strong> Exchange Alliance.<strong>The</strong> alliance’s first initiative was the cross-listing of benchmark equity index derivatives onone another’s trading platforms in March 2012. <strong>The</strong> initiative enables member exchanges toexp<strong>and</strong> their product offerings beyond their own markets <strong>and</strong> their investors to gain exposureto the dynamic, emerging, <strong>and</strong> increasingly important <strong>BRICS</strong> economics. <strong>The</strong> alliance iscontinuing to work on possible new product initiatives.This article gives a brief description of each <strong>BRICS</strong> country’s securities <strong>and</strong> derivativesmarkets (focusing on financial derivatives), profiling their respective positions in the worldeconomy <strong>and</strong> exchange markets. An overview is given of each market, followed by anintroduction to the key exchanges’ market segments <strong>and</strong> product offerings, <strong>and</strong> their otherinternational cooperation initiatives.1. <strong>BRICS</strong> IN THE WORLD ECONOMY AND EXCHANGE MARKETSAccording to the World Bank, the <strong>BRICS</strong> countries are middle-income economies 2 ; the 108middle-income economies in aggregate constituted one-third of the world’s Gross DomesticProduct (GDP) in 2011 3 . <strong>The</strong> five <strong>BRICS</strong> economies enjoyed spectacular growth, more thanquadrupling their GDP from 2002 to 2011 in nominal terms while the rest of the world’s GDPgrew 84%. <strong>The</strong> <strong>BRICS</strong> economies accounted for one-fifth of global GDP in 2011(compared with 9% in 2002) (see Table 1-1). Based on the World Federation of Exchanges123<strong>The</strong> acronym, BRIC, was coined by Jim O’Neill of Goldman Sachs in 2001 to refer to the rising emergingeconomies in Brazil, Russia, India <strong>and</strong> China. Since 2008, the BRIC leaders have met annually to discussissues of global significance, such as development, peace <strong>and</strong> security, energy <strong>and</strong> climate change, <strong>and</strong> socialissues. In 2011, the leaders invited South Africa to join, thus becoming the <strong>BRICS</strong>.<strong>Hong</strong> <strong>Kong</strong> is classified as a high-income economy.Source: International Monetary Fund (IMF) statistics <strong>and</strong> World Bank classification.- 1 -
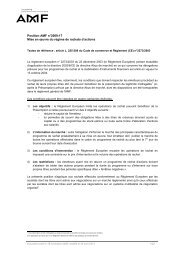
US$ billionNYSE Euronext (US)NASDAQ OMX (US)LSE Group (UK & Italy)Tokyo SENYSE Euronext (Europe)HKExShanghai SETMX GroupDeutsche BoerseASX (Australia)BSE (Mumbai)SIX Swiss ExchangeBM&FBOVESPAKorea ExchangeShenzhen SESpanish ExchangesNASDAQ OMX(Nordic)Johannesburg SEMoscow ExchangeSingapore Exchange<strong>The</strong> <strong>BRICS</strong> <strong>Securities</strong> <strong>and</strong> <strong>Derivatives</strong> <strong>Markets</strong>(WFE) statistics, exchanges from these five countries are among the top 20 in terms of marketvalue of domestic listed companies <strong>and</strong> contract volume of financial derivatives (see Figures1-1 <strong>and</strong> 1-2).CountryTable 1-1. GDP in <strong>BRICS</strong> countries (2002 vs 2011)GDP (current prices, US$ billion)% of global GDP2002 2011 % change 2002 2011China 1,454 7,298 402% 4.4% 10.4%Brazil 506 2,493 393% 1.5% 3.6%Russia 345 1,850 436% 1.0% 2.6%India 510 1,827 258% 1.5% 2.6%South Africa 111 409 267% 0.3% 0.6%<strong>BRICS</strong> 2,926 13,877 374% 8.8% 19.9%Rest of the world 30,428 56,022 84% 91.2% 80.1%All countries 33,355 69,899 110% 100.0% 100.0%Source: International Monetary Fund (IMF), World Economic Outlook Database, October 2012Figure 1-1. Top 20 exchanges in terms of market value of domestic listed companiesTop 20 exchanges by market (end of value October of domestic 2012) listed shares (October 2012)16,00014,00013,62512,00010,0008,0006,0004,0004,5263,526 3,2752,677 2,6332,314 2,0441,392 1,348 1,203 1,176 1,162 1,114 1,098 964 933 835 767 7412,0000<strong>BRICS</strong> marketsSource: WFE monthly statistics- 2 - Research & Corporate Development, HKEx31 December 2012
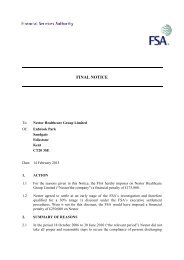
Contracts (million)CME GroupKorea ExchangeNSE of IndiaEUREXBM&FBOVESPAChicago Board OptionsExchangeMoscow ExchangeNYSE Euronext (US)NASDAQ OMX (US)NYSE.Liffe EuropeInternational <strong>Securities</strong>ExchangeBSE (India)Osaka SEASX <strong>Derivatives</strong>TradingTAIFEXHKExOMX Nordic ExchangeASX SFE <strong>Derivatives</strong>TradingSingapore ExchangeJohannesburg SE<strong>The</strong> <strong>BRICS</strong> <strong>Securities</strong> <strong>and</strong> <strong>Derivatives</strong> <strong>Markets</strong>2,000Figure 1-2.Top 20 exchanges in terms of contract volume of financial derivatives(January-October 2012)Top 20 exchanges by financial derivatives contract volume (January-October 2012)1,8001,773 1,712 1,6701,3561,6001,4001,2001,1411,000800600946876825 8207835934002000194 168132 126 99 92 85 65 63<strong>BRICS</strong> marketsSource: WFE monthly statistics2. BRAZILIn Brazil, BM&FBOVESPA is the only exchange operator of securities <strong>and</strong> derivativesmarkets. It is a publicly listed company created in 2008 through the integration of the SãoPaulo Stock Exchange (BOVESPA) <strong>and</strong> the Brazilian Mercantile & Futures Exchange(BM&F). <strong>The</strong> Brazilian financial market is under the regulation <strong>and</strong> monitoring of threeauthorities — the National Monetary Council (CMN), the Brazilian Central Bank (BCB)<strong>and</strong> the Brazilian <strong>Securities</strong> <strong>and</strong> Exchange Commission (CVM).CVM is the direct regulator of BM&FBOVESPA; it directly regulates <strong>and</strong> oversees theBrazilian capital markets, including the exchange markets <strong>and</strong> the organised over-the-counter(OTC) markets, <strong>and</strong> the market participants. CMN is responsible for formulating monetary<strong>and</strong> credit policies for the financial <strong>and</strong> capital markets. BCB is responsible for theimplementation of CMN’s policies. BCB also oversees the operation of financial institutionsin Brazil.BM&FBOVESPA itself has incorporated a specific entity for self-regulation —BM&FBOVESPA Market Supervision (BSM). <strong>The</strong> main responsibility of BSM is tosupervise the markets managed by BM&FBOVESPA to ensure compliance with applicablelaws, rules <strong>and</strong> regulations by market participants <strong>and</strong> by the exchange itself.- 3 - Research & Corporate Development, HKEx31 December 2012
<strong>The</strong> <strong>BRICS</strong> <strong>Securities</strong> <strong>and</strong> <strong>Derivatives</strong> <strong>Markets</strong>2.1 Market segmentsBM&FBOVESPA operates two major market segments — BOVESPA <strong>and</strong> BM&F — forsecurities <strong>and</strong> derivatives trading. Products traded on BOVESPA comprise: (1) equities —including shares, Brazilian Depository Receipts (BDRs) representing shares of domestic <strong>and</strong>foreign issuers, exchange-traded funds (ETFs) <strong>and</strong> warrants; (2) equity derivatives — mainlystock options <strong>and</strong> index options; <strong>and</strong> (3) corporate debt securities. <strong>The</strong> BM&F segmentprovides trading for commodity derivatives (agricultural, gold <strong>and</strong> energy), financialderivatives (currency, interest rate <strong>and</strong> equity indices), spot foreign exchange (forex) <strong>and</strong>public debt securities.Besides exchange-traded products, BM&FBOVESPA runs the Organised OTC Market (theonly one in Brazil) for the trading of equities <strong>and</strong> derivatives. <strong>Derivatives</strong> products includeflexible options, forwards <strong>and</strong> swaps on equity indices, commodities, forex <strong>and</strong> interest rates.For equities, there is a special trading segment of the Organised OTC Market, BOVESPAMais (meaning “BOVESPA Plus”), which provides a stepping stone for companies registeredwith CVM to move to the listing segment. In addition, unsponsored BDRs 4 , which do notinvolve the foreign companies that issue the shares underlying the BDRs, are available fortrading on the Organised OTC Market.In Brazil, there is a Brazilian Commodities Exchange (BBM) which centralises the trading ofagricultural commodities <strong>and</strong> OTC agribusiness securities. It is a private mutualised entityin which BM&FBOVESPA holds a majority membership interest.<strong>The</strong> clearing <strong>and</strong> settlement of securities <strong>and</strong> derivatives are h<strong>and</strong>led by BM&FBOVESPA’sfour clearing houses for different product types, which are in the process of integration, bothentity-wise <strong>and</strong> technology-wise. <strong>The</strong> post-trade process is integrated with BM&FSettlement Bank (a wholly-owned subsidiary of BM&FBOVESPA), which providessettlement, depository, registration <strong>and</strong> custody services to clearing houses <strong>and</strong> participants.<strong>The</strong> existing four trading systems for the different securities <strong>and</strong> derivatives products are alsoto be integrated. <strong>The</strong> trading system for BM&F derivatives <strong>and</strong> spot forex — PUMATrading System, which is jointly developed by BM&FBOVESPA <strong>and</strong> CME Group — willreplace the other three trading systems for securities <strong>and</strong> other derivatives products.2.2 <strong>Securities</strong> marketBOVESPA has three special listing segments in addition to the traditional market — NovoMercado (meaning “New Market”), Corporate Governance (CG) Level 1 <strong>and</strong> CG Level 2.<strong>The</strong>se segments were launched in 2000 <strong>and</strong> adopt additional <strong>and</strong> more stringent corporategovernance requirements. BM&FBOVESPA itself is listed in Novo Mercado, which adoptsthe highest corporate governance st<strong>and</strong>ards among all listing segments.Brazil has the largest stock market in Latin America by market value, with 373 listedcompanies <strong>and</strong> a total market capitalisation of US$1,223 billion at the end of 2011.Currently, more than 80 BDRs are available for trading <strong>and</strong> 70 of them are unsponsoredBDRs on foreign stocks which include big names such as Coca-Cola, Exxon Mobil, General4BDRs can be classified into sponsored <strong>and</strong> unsponsored BDRs. Sponsored BDRs involve the issuer ofunderlying shares which has an agreement with the depository bank.- 4 - Research & Corporate Development, HKEx31 December 2012
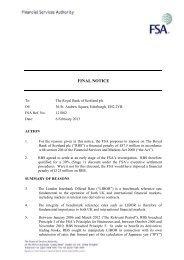
Market capitalisation / share trading value (US$bn)No. of listed companies<strong>The</strong> <strong>BRICS</strong> <strong>Securities</strong> <strong>and</strong> <strong>Derivatives</strong> <strong>Markets</strong>Electric <strong>and</strong> Microsoft. In 2011, the total value of share trading was US$931 billion (seeFigure 2-1) <strong>and</strong> the average daily trading value was US$3.7 billion. Almost all securitiestrading came from stocks (95% in 2011); options exercise contributed another 4%; otherproducts such as investment funds, structured products <strong>and</strong> fixed-income securitiescontributed only 1% of the total trading value (see Figure 2-2).Figure 2-1. DomesticDomesticstockstock marketmarketcapitalisation,capitalisation,annual shareannualtrading valueshare<strong>and</strong>trading value <strong>and</strong>no. of listed no. of listed companies on on BM&FBOVESPA (2002 -(2002 2011) – 2011)1,6001,400No. of listed companiesMarket capitalisationShare trading value1,3991,3411,5426005251,2001,00080060040020003994041,223393 385 381369373358343 350869 93175072360748258864534123416612410568276462002 2003 2004 2005 2006 2007 2008 2009 2010 2011Sources: Sources: BM&FBOVESPA monthly & World operational Federation data of Exchanges <strong>and</strong> WFE (WFE) monthly statistics450375300225150750Trading value by security type on BOVESPA segment (2011)(excluding equity derivatives)Figure 2-2. Trading value by security type on BOVESPA (2011) (excluding equity derivatives)Others0.04%Investment funds1%Options exercise4%Stocks95%Notes:(1) Numbers may not add up to 100% due to rounding.Notes:(2) Trading in round-lot market, odd-lot market <strong>and</strong> auction market is classified as trading in “Stocks”.(1) Numbers may not add up to 100% due to rounding.(3) “Others”(2)includesTradingstructuredin round-lotproducts,market, odd-lotinvestmentsmarketcertificates<strong>and</strong> auction<strong>and</strong>marketfixed-incomeis classifiedsecurities.as "Stocks".Source: BM&FBOVESPA (3) "Others" includes annual structured statistics products, investments certificates <strong>and</strong> fixed-income securities.Source: BM&FBOVESPA- 5 - Research & Corporate Development, HKEx31 December 2012
IPO funds raised (US$bn)No. of newly listed companies<strong>The</strong> <strong>BRICS</strong> <strong>Securities</strong> <strong>and</strong> <strong>Derivatives</strong> <strong>Markets</strong><strong>The</strong> significant growth of market capitalisation over the past decade shown in Figure 2-1,however, was not accompanied by a corresponding increase in number of listings. In fact,primary market activities were not very active except in 2007. In 2011, BOVESPA saw 24new listings <strong>and</strong> US$4 billion of funds raised through initial public offerings (IPOs),compared to the peak levels of 71 new listings <strong>and</strong> US$30 billion IPO funds raised in 2007(see Figure 2-3).3228Figure 2-3. IPO funds raised <strong>and</strong> no. of newly listed companiesIPO funds raised on BM&FBOVESPA <strong>and</strong> no. of newly listed companies (2002 on – BM&FBOVESPA 2011) (2002 - 2011)IPO funds raisedNo. of newly listed companies30240210241802015016127113120908765442 3820111562149 130242002 2003 2004 2005 2006 2007 2008 2009 2010 2011Note: IPO funds raised figures for 2002 <strong>and</strong> 2003 are not Note: IPO funds raised figures for 2002 <strong>and</strong> 2003 are available.Source: BM&FBOVESPASource: BM&FBOVESPA monthly operational data603002.3 Financial derivatives marketBoth market segments of BOVESPA <strong>and</strong> BM&F offer trading in financial derivatives. <strong>The</strong>key products on BOVESPA are stock (including ETF) options <strong>and</strong> IBOVESPA options (theonly index options offered by BOVESPA segment). BM&F offers a much wider range offinancial derivatives, including futures <strong>and</strong> options (F&O) on interest rates, forex <strong>and</strong> equityindices, <strong>and</strong> futures on sovereign debt securities. Of all product types on BM&FBOVESPA,stock options are the dominant volume contributor, accounting for 56% of the total derivativestrading volume (including OTC contracts) in 2011. <strong>The</strong>y are followed by F&O on interestrates (32%) <strong>and</strong> on forex (8%). Other derivatives (including agricultural <strong>and</strong> energyproducts) account for only a small fraction (4%). In terms of open interest, the top three arestill interest rate derivatives (64%), stock options (26%), <strong>and</strong> forex derivatives (8%). (SeeFigure 2-4.)- 6 - Research & Corporate Development, HKEx31 December 2012
IBOVESPA daily closing (points)Futures trading volume (mil contracts)<strong>The</strong> <strong>BRICS</strong> <strong>Securities</strong> <strong>and</strong> <strong>Derivatives</strong> <strong>Markets</strong>Figure 2-4. <strong>Derivatives</strong> trading volume <strong>and</strong> open interest by product typeon BM&FBOVESPA (2011)BM&FBOVESPA — <strong>Derivatives</strong> market open interest by product type (2011)BM&FBOVESPA — <strong>Derivatives</strong> market trading volume by product type (2011)(a) Trading volume(b) Open interestBOVESPA stockoptions56%BOVESPA stockoptions26%Other derivatives4%BM&F forex F&O8%BM&F interest rateF&O32%Other derivatives2%BM&F forex F&O8%BM&F interest rateF&O64%Notes:Notes:(1) Numbers may not add up to 100 per cent due to rounding.(2) “Other derivatives” comprise: (i) BOVESPA options on ETFs <strong>and</strong> IBOVESPA; <strong>and</strong> (ii) BM&F F&O on equity indic(2) “Other derivatives” comprise: (i) BOVESPA options on ETFs <strong>and</strong> IBOVESPA; <strong>and</strong> (ii) BM&F F&O on equity indices,Notes:(1) Numbers may not add up to 100 per cent due to rounding.(1) Numbers may not add up to 100% due to rounding.gold, agricultural products <strong>and</strong> energy.gold, agricultural (2) “Other products derivatives” <strong>and</strong> energy. comprise: (i) BOVESPA options on ETFs <strong>and</strong> IBOVESPA; <strong>and</strong> (ii) BM&F F&O on equity indices,Source: Futures Industry Association (FIA)gold, agricultural products <strong>and</strong> energy.Source: Futures Industry Association (FIA) monthly statisticsSource: Futures Industry Association (FIA)Total: 1.5 billion contractsTotal: 52 million contractsIn the <strong>BRICS</strong> Exchange Alliance, futures on IBOVESPA, the benchmark index of theBrazilian stock market, is the cross-listed product. <strong>The</strong> monthly trading volume ofIBOVESPA futures on BM&FBOVESPA has been quite stable over the past decade. <strong>The</strong>average daily contract volume was the lowest (in terms of the current contract size) at 42,775contracts in September 2002 <strong>and</strong> reached a high of 151,119 contracts in August 2007. (SeeFigure 2-5.) <strong>The</strong> average daily volume for the year 2011 was 86,948 contracts.Figure 2-5. IBOVESPA daily closing <strong>and</strong> monthly trading volume of IBOVESPA futuresIBOVESPA daily on closing BM&FBOVESPA <strong>and</strong> monthly trading volume (2002 of – IBOVESPA 2011) futures (2002 - 2011)80,00070,000IBOVESPA futures monthly volumeIBOVESPA daily closing73516 (2008/05/20)161460,0001250,0001040,00056754 (2011/12/29)830,00013872 (2002/01/02)620,0008370(2002/10/16)29435 (2008/10/27)410,0002002002/01 2003/01 2004/01 2005/01 2006/01 2007/01 2008/01 2009/01 2010/01 2011/01Year/monthNote: <strong>The</strong> Note: contract <strong>The</strong> contract size size of of IBOVESPA futures was reduced to one-third to since since 17 April 172006. April For 2006. comparison, For comparison, the trading the tradingvolumes volumes of IBOVESPA of IBOVESPA futures futures from FIA for Jan 2002 to to Apr Apr 2006 2006 were were multiplied multiplied by 3. by 3.Sources: Reuters <strong>and</strong> Futures Industry Association (FIA)Sources: Reuters <strong>and</strong> FIA- 7 - Research & Corporate Development, HKEx31 December 2012
<strong>The</strong> <strong>BRICS</strong> <strong>Securities</strong> <strong>and</strong> <strong>Derivatives</strong> <strong>Markets</strong>2.4 Other international cooperation initiativesBM&FBOVESPA partnered with CME Group in the development of the PUMA TradingSystem <strong>and</strong> a derivatives order routing arrangement. This routing arrangement allowsBM&FBOVESPA customers to trade CME Group’s products through the PUMA system.Similarly, customers of CME Group can access the Brazilian derivatives market through theCME Globex platform. This was further strengthened by the signing of a cross-listingagreement in March 2012 involving S&P 500 Index futures <strong>and</strong> BOVESPA Index futures, thebenchmark futures products of the two exchanges. Besides CME Group, NASDAQ OMXhas provided technologies to BM&FBOVESPA for market data <strong>and</strong> market surveillance.Separately, BM&FBOVESPA formed an alliance with Chi-X Global in 2012 to launchChi-FX Brazil, a new trading platform for overseas investors to trade BM&FBOVESPA-listedstocks in their local currencies.Furthermore, BM&FBOVESPA has signed memor<strong>and</strong>a of underst<strong>and</strong>ing (MOU) with anumber of exchanges, including the Toronto Stock Exchange (TSX, now part of TMX Group),the Santiago Stock Exchange in Chile, the Colombian Stock Exchange (BVC), the MexicanExchange (BMV), the Shanghai Stock Exchange (SHSE) <strong>and</strong> the Shenzhen Stock Exchange(SZSE).3. RUSSIAIn Russia, the principal exchange operator is Moscow Exchange MICEX-RTS (“MoscowExchange”). It was formed in December 2011 when the two principal exchange operators atthat time — MICEX Group <strong>and</strong> RTS Group — merged. Besides the Moscow-basedexchange, the group has exchange centres in regions like Ural, Volga <strong>and</strong> Siberia.<strong>The</strong>re are a few regional exchanges which are not part of the Moscow Exchange Group.<strong>The</strong>se include the St. Petersburg Currency Exchange, the Samara Currency InterbankExchange <strong>and</strong> the St. Petersburg Exchange (in which Moscow Exchange has a minorityshareholding). <strong>The</strong> first two exchanges, as implied by their names, focus on currencytrading while the St. Petersburg Exchange mainly trades commodities <strong>and</strong> related derivatives.<strong>The</strong> principal regulator of the exchanges <strong>and</strong> the capital market in Russia is the FederalService for Financial <strong>Markets</strong> (FFMS). <strong>The</strong> Central Bank of Russia (CBR) is responsiblefor regulating Russia’s banking industry <strong>and</strong> forex market <strong>and</strong> is the organiser of thegovernment securities market. <strong>The</strong> Federal Anti-monopoly Service (FAS) <strong>and</strong> the Ministryof Finance (MOF) are two other important supervisory bodies in Russia’s regulatoryframework, with authority over the maintenance of competition in the financial market <strong>and</strong>the issuance of public debt securities respectively.- 8 - Research & Corporate Development, HKEx31 December 2012
<strong>The</strong> <strong>BRICS</strong> <strong>Securities</strong> <strong>and</strong> <strong>Derivatives</strong> <strong>Markets</strong>3.1 Market segmentsProducts of Moscow Exchange can be classified into forex, corporate securities, governmentsecurities <strong>and</strong> derivatives (financial <strong>and</strong> commodity). Moscow Exchange also extends itsoffering of commodity products through its associate, National Mercantile Exchange(NAMEX). Besides on-exchange products, Moscow Exchange operates an OTC marketwhich has several systems for reporting OTC trades. One function of the OTC market is tofacilitate trading in securities of foreign issuers, including depository receipts (DRs) on thesesecurities.<strong>The</strong> post-trade processing of transactions on Moscow Exchange is h<strong>and</strong>led by its fivesubsidiaries — National Clearing Centre (NCC), RTS Clearing Centre (RTS-CC), NationalSettlement Depository (NSD), Depository Clearing Company (DCC) <strong>and</strong> RTS SettlementChamber (RTS-SC) — for different securities market sectors (see below) <strong>and</strong> asset classes.NCC <strong>and</strong> RTS-CC are the clearing houses for the forex market <strong>and</strong> derivatives marketrespectively. <strong>The</strong>y also provide clearing services for different sectors of the securitiesmarket. Settlement <strong>and</strong> depository services for the securities market are provided by NSD<strong>and</strong> DCC. RTS-SC is a non-banking credit institution which provides settlement services totrading participants on Moscow Exchange. As the post-trade facilities of a merged exchange,these five institutions are in the process of integration.3.2 Forex marketForex trading is a significant business segment of Moscow Exchange, given that MICEX wasfounded in 1992 as a currency exchange. In 2011, total trading volume on the on-exchangecurrency market reached RUB86.8 trillion (US$3 trillion), representing 29% of the aggregateturnover on the regulated markets of Moscow Exchange. <strong>The</strong> electronic currency tradingsystem of MICEX supports trading (including currency swaps) in US dollar, euro, Ukrainianhryvnia, Kazakhstan tenge, Belarusian rouble <strong>and</strong>, since December 2010, Chinese renminbi(RMB). Similar to the global market, forex trading on MICEX has been dominated by USdollar <strong>and</strong> euro, which account for almost 100% of the trading volume.3.3 <strong>Securities</strong> marketsCorporate securities listed on Moscow Exchange comprise equities (including Russi<strong>and</strong>epository receipts (RDRs)), corporate debt securities <strong>and</strong> investment funds, <strong>and</strong> are traded onthree sectors — Main Market (formerly under MICEX), St<strong>and</strong>ard, <strong>and</strong> Classica (formerlyunder RTS-SE). <strong>The</strong> Main Market is the most liquid sector, accounting for over 80% ofequity turnover <strong>and</strong> more than 99% of bond trading volume in the Russian securities market.Figure 3-1 shows the market capitalisation of domestic listed companies <strong>and</strong> the annualsecurities turnover on MICEX from 2002 to 2011.- 9 - Research & Corporate Development, HKEx31 December 2012
Market capitalisation / Turnover (US$ bil)<strong>The</strong> <strong>BRICS</strong> <strong>Securities</strong> <strong>and</strong> <strong>Derivatives</strong> <strong>Markets</strong>Figure 3-1. Domestic stock market capitalisation <strong>and</strong> annual securities turnover of MICEX(2002 – 2011)1,4001,200Domestic stock market capitalisation <strong>and</strong> annual securities turnover of MICEX (2002 - 2011)Market capitalisation<strong>Securities</strong> turnover*1,2221,0008879498007367716004002664206244273374744435392000138 1535936 73100 1142002 2003 2004 2005 2006 2007 2008 2009 2010 2011* Comprising stocks, RDRs <strong>and</strong> investment funds* TurnoverSources:of stocks,MoscowRDRsExchange<strong>and</strong><strong>and</strong>investmentWorld Federationfundsof Exchanges (WFE)Sources: Moscow Exchange <strong>and</strong> WFE<strong>Securities</strong> that have gone through the listing procedure are admitted to trading on any one ofthe five quotation lists — A1, A2, B, V <strong>and</strong> I — depending on the requirements satisfied bythe securities (A1 has the most stringent requirements while V <strong>and</strong> I have the least).Alternatively, securities can go through a simplified procedure for admission to tradingwithout being listed. In 2011, both MICEX <strong>and</strong> RTS-SE had two newly listed companiesthrough IPOs, raising capital of US$2 billion in total 5 .Moscow Exchange operates the Innovation <strong>and</strong> Investment Market (IIM), created jointlywith the Russian State Corporation of Nanotechnologies (ROSNANO), to help growthtechnology companies attract investment. This sector consists of three segments: (1) theInnovation <strong>and</strong> Growth Companies (IGC) sector to allow IPOs of eligible companies; (2) aprivate placement platform; <strong>and</strong> (3) the IPOBoard (an online information <strong>and</strong> trading system)to facilitate fund raising by non-public technology companies.<strong>Securities</strong> trading constituted 51% of total cash market trading value of MICEX in 2011. Ofthis, about half was in bonds <strong>and</strong> bond repurchase agreements (repos) (see Figure 3-2) inwhich government securities play an important role. GKO, OFZ (two types of governmentbonds — zero-coupon treasury bills <strong>and</strong> coupon-bearing bonds respectively) <strong>and</strong> CBR bondsare the main instruments of this segment. MICEX calculates the Russian Government BondIndices (RGBI) <strong>and</strong> yield indicators based on the prices of these instruments. Notably, repotrading on stocks is also popular, constituting 17% of total cash market trading of MICEX.5Figures are from WFE annual statistics, which may include dual-listings.- 10 - Research & Corporate Development, HKEx31 December 2012
<strong>The</strong> <strong>BRICS</strong> <strong>Securities</strong> <strong>and</strong> <strong>Derivatives</strong> <strong>Markets</strong>Trading volume of securities, bonds <strong>and</strong> currencies on MICEX (2011)Figure 3-2. Trading volume of securities, bonds <strong>and</strong> currencies on MICEX (2011)Stocks, investmentfunds <strong>and</strong> RDRs9%Currency49%Bond repos22%Stock repos17%Bonds3%Total: US$5,909 billionSource: Moscow Exchange3.4 Financial derivatives market<strong>Derivatives</strong> products of Moscow Exchange are traded on FORTS <strong>and</strong> MICEX <strong>Derivatives</strong>.FORTS (abbreviation for “Futures <strong>and</strong> Options on RTS”) is the main derivatives market ofMoscow Exchange in terms of volume (99% of the total in 2011). Products on FORTS arefutures on shares (including RDRs), stock indices, bonds, currencies, interest rates <strong>and</strong>commodities, <strong>and</strong> options on futures (except interest rates). MICEX <strong>Derivatives</strong> offersfinancial futures on currencies, interest rates, a stock index (MICEX Index) <strong>and</strong> Russianstocks with fewer contract types than FORTS.Figure 3-3 shows that financial derivatives are the dominant products on Moscow Exchange’sderivatives market in terms of both trading volume <strong>and</strong> open interest. In 2011, index futures,stock futures <strong>and</strong> forex futures are the most actively traded products, contributing 35%, 33%<strong>and</strong> 24% of the total derivatives trading volume respectively.Commodity F&O*4%Forex options0.1%Stock options0.8%Index options3%Interest rate futures0.7%Source: Moscow ExchangeFigure 3-3. <strong>Derivatives</strong> trading volume <strong>and</strong> open interest by product typeon Moscow Exchange (2011)MICEX-RTS derivatives trading volume by product type (2011)(a) Trading volumeForex futures24%Index futures35%Stock futures33%Forex options2%Stock options2%Index options7%Interest rate futures5%MICEX-RTS derivatives open interest by product type (2011)Commodity F&O*3%(b) Open interestIndex futures12%Forex futures45%Stock futures23%Total no. of contracts: 1,099 millionTotal no. of contracts: 3.2 million* Agricultural products, energy <strong>and</strong> metalsNote: Numbers do not add up to 100% due to roundingSource: FIA* Agricultural products, energy <strong>and</strong> metalsNote: Numbers do not add up to 100% due to roundingSource: Futures Industry Association (FIA)* Agricultural products, energy <strong>and</strong> metalsNote: Numbers do not add up to 100% due to roundingSource: Futures Industry Association (FIA)- 11 - Research & Corporate Development, HKEx31 December 2012
MICEX Index weekly closing (points)Futures trading volume (mil contracts)<strong>The</strong> <strong>BRICS</strong> <strong>Securities</strong> <strong>and</strong> <strong>Derivatives</strong> <strong>Markets</strong><strong>The</strong> first cross-listed product of Moscow Exchange for the <strong>BRICS</strong> Alliance is futures on theMICEX Index, the benchmark index of the Russian stock market. Trading in MICEX Indexfutures in the local market was relatively inactive in the first two years after launch in 2007<strong>and</strong> the monthly volume even dropped to zero in November 2008. In early 2009, MICEXintroduced a number of measures to boost the liquidity in its equity derivatives market,including reduction of the minimum price fluctuation, commission fee <strong>and</strong> margin depositrates for this product. Subsequently, the trading volume picked up rapidly <strong>and</strong> reached thepeak of 46,990 contracts on an average daily basis in October 2010. (See Figure 3-4.) <strong>The</strong>average daily volume for the year 2011 was 10,805 contracts, compared to 1,523,571contracts for the most active RTS Index futures.Figure 3-4. MICEX Index weekly closing <strong>and</strong> monthly trading volume of MICEX IndexMICEX Index weekly closing <strong>and</strong> monthly trading volume of MICEX Index futuresfutures on Moscow Exchange (2002 – 2011)2,5002,000MICEX Index futures monthly volumeMICEX Index weekly closing(2002 - 2011)1943 (2008/05/18)2.01.61,5001.21,0001402(2011/12/30)0.8500256 (2002/01/06)0.4513 (2008/10/26)02002/01 2003/01 2004/01 2005/01 2006/01 2007/01 2008/01 2009/01 2010/01 2011/01Year/monthNote: MICEX Note: Index MICEX futures Index futures were launched were launched in in June 2007Sources: Reuters <strong>and</strong> Futures Industry Association (FIA)Sources: Reuters <strong>and</strong> FIA0.03.5 Other international cooperation initiativesBefore merging with RTS Group, MICEX Group signed memor<strong>and</strong>a of cooperation with anumber of overseas counterparts, including Chicago Mercantile Exchange (CME), DeutscheBörse (DB), HKEx, the London Stock Exchange (LSE), NASDAQ Stock Market, the NewYork Stock Exchange (NYSE), the SHSE, the SZSE <strong>and</strong> Tokyo Stock Exchange (TSE). Inaddition, NASDAQ OMX is a partner of both MICEX Group <strong>and</strong> RTS Group in the area ofmarket data services.Moscow Exchange also has several joint ventures in Ukraine <strong>and</strong> Kazakhstan. In 2008, RTSGroup cooperated with a group of brokers in Ukraine to establish the Ukrainian Exchange,<strong>and</strong> provided the new exchange with equity <strong>and</strong> derivatives trading systems. Currently,Moscow Exchange has a 43% stake in the Ukrainian Exchange. Moscow Exchange wasalso the majority shareholder in the PFTS Stock Exchange in Ukraine <strong>and</strong> the EvraziyskaiaTrading System (ETS) Commodity Exchange in Kazakhstan as at the end of 2011.- 12 - Research & Corporate Development, HKEx31 December 2012
<strong>The</strong> <strong>BRICS</strong> <strong>Securities</strong> <strong>and</strong> <strong>Derivatives</strong> <strong>Markets</strong>4. INDIA<strong>The</strong>re are over 20 stock exchanges <strong>and</strong> over 20 commodity exchanges in India. Among thestock exchanges, the National Stock Exchange of India (NSE) <strong>and</strong> BSE Limited (BSE) arethe most prominent. <strong>The</strong>se two exchanges offer trading in stocks, ETFs, bonds <strong>and</strong> financialderivatives. <strong>The</strong> commodity exchanges offer trading in commodity futures while trading incommodity options is still prohibited. Among them, Multi Commodity Exchange of India(MCX), which became India’s first exchange to get listed on the BSE in March 2012, has thelion’s share by trading volume.<strong>The</strong> principal regulator in the Indian securities market (in legislative terms, “securities”includes financial derivatives) is the <strong>Securities</strong> Board of India (SEBI). It regulates stockexchanges, market intermediaries <strong>and</strong> other service providers <strong>and</strong> their activities, <strong>and</strong>promotes investor education <strong>and</strong> training of market intermediaries. <strong>The</strong> market for domesticgovernment securities (G-secs), which are traded both OTC <strong>and</strong> on exchange, is developed<strong>and</strong> managed by the Reserve Bank of India (RBI), the nation’s central bank. It also issuesG-secs on behalf of the Indian Government.At the policy level, the Ministry of Finance (MOF) is responsible for formulating polices <strong>and</strong>administering the relevant Acts for the regulation <strong>and</strong> development of the securities market;<strong>and</strong> the Ministry of Corporate Affairs (MCA) is primarily responsible for administering theActs governing the corporate sector.4.1 Key exchanges<strong>The</strong> NSE <strong>and</strong> the BSE are the most prominent stock exchanges in India — almost all cashmarket trading (equities <strong>and</strong> other securities, excluding financial derivatives) is done on thetwo exchanges, with the NSE having the lion’s share (81% in 2011/12 6 ). <strong>The</strong>se twoexchanges are also the only exchanges in India offering equity derivatives, in which tradingvolume is also dominated by the NSE (97%). Currently, only the NSE, MCX StockExchange (MCX-SX) <strong>and</strong> the United Stock Exchange of India (USE) offer currencyderivatives, in which the NSE has again the largest share by trading volume (47% in 2011/12),followed by MCX-SX (37%). (See Figure 4-1.)<strong>The</strong> NSE offers the trading of shares, warrants, mutual funds (including ETFs), fixed incomesecurities (include G-sec), futures <strong>and</strong> options contracts on equities, equity indices <strong>and</strong>currencies, <strong>and</strong> interest rate futures. <strong>The</strong> National <strong>Securities</strong> Clearing Corporation Limited(NSCCL), the NSE’s wholly-owned subsidiary, clears <strong>and</strong> settles the transactions of equity<strong>and</strong> financial derivatives.<strong>The</strong> BSE’s product offering is similar to the NSE’s except that the BSE does not offer tradingof interest rate futures <strong>and</strong> has suspended the trading of currency futures since April 2010.BOI Shareholding Limited (BOISL, 49% owned by the BSE) is the BSE’s clearing house forfunds <strong>and</strong> securities while Indian Clearing Corporation Limited (ICCL), the BSE’ssubsidiary, provides clearing <strong>and</strong> settlement services for the BSE’s mutual funds <strong>and</strong>corporate debt segments.6<strong>The</strong> financial year in India is from April to March the following year (the same convention is used for thisIndia section of the article).- 13 - Research & Corporate Development, HKEx31 December 2012
Market capitalisation / cash market turnover (US$ billion)Market capitalisation / cash market turnover (US$ billion)No. of listed companiesNo. of listed companies<strong>The</strong> <strong>BRICS</strong> <strong>Securities</strong> <strong>and</strong> <strong>Derivatives</strong> <strong>Markets</strong>4.2 Cash marketFigure 4-2 shows the growth of the cash markets operated by the NSE <strong>and</strong> the BSE in the pastdecade. Although the BSE has a much larger number of listed companies than the NSE(5,133 vs 1,646 as at the end of March 2012), they have similar equity market capitalisation(US$1,192 billion for the NSE vs US$1,215 billion for the BSE) given that most of thecompanies listed on the NSE are dual-listed on the BSE. NSE’s total cash market turnoverhas grown to 4 times that of BSE by 2011/12 (US$549 billion vs US$130 billion).Figure 4-2. Market capitalisation, turnover value <strong>and</strong> number of listed companiesin the NSE’s <strong>and</strong> the BSE’s cash market segment (2002/03 – 2011/12)NSE1,8001,6001,4001,2001,000800600400200Preiod-end Market capitalisation, cash market trunover <strong>and</strong> no. of listed companies on NSE (2002/03 - 2011/12)818130No. of listed companiesMarket capitalisationCash market turnover909258970362253 2611,0691,228631 7733524461,3811,2158881,4325685401,4701,5741,331 1,5019178011,6461,1925491,8001,6001,4001,2001,00080060040020001132002/03 2003/04 2004/05 2005/06 2006/07 2007/08 2008/09 2009/10 2010/11 2011/120Reporting yearPreiod-end Market capitalisation, cash market trunover <strong>and</strong> no. of listed companies on BSE (2002/03 - 2011/12)BSE1,8001,6001,4001,2001,0008006004002000No. of listed companies5,650Market capitalisation1,5325,528Cash market turnover1,3661,2851,2155,1335,0674,9758134,9294,887677 4,8214,7314,78160638827739512030521918321624766 116 1191302002/03 2003/04 2004/05 2005/06 2006/07 2007/08 2008/09 2009/10 2010/11 2011/125,8005,6005,4005,2005,0004,8004,6004,4004,200Reporting yearNotes:(1) Market capitalisation <strong>and</strong> turnover are converted to USD using period-end exchange rates (source: RBI).(2) <strong>The</strong> reporting year covers April each year to March the following year.(3) <strong>The</strong> significant decrease in the number of listed companies in the BSE from 2003/04 to 2004/05 is partlydue to the delisting of 552 companies in July 2004 because of their non-compliance with the BSE’s listingagreements.Sources: NSE statistics <strong>and</strong> SEBI Bulletins- 15 - Research & Corporate Development, HKEx31 December 2012
<strong>The</strong> <strong>BRICS</strong> <strong>Securities</strong> <strong>and</strong> <strong>Derivatives</strong> <strong>Markets</strong>4.3 Financial derivatives market<strong>The</strong> NSE is not only the largest exchange in India in terms of contract volume of financialderivatives but also a prominent derivatives exchange in the world. It ranked 3 rd in terms ofaggregate derivatives volume in 2011, behind Korea Exchange (KRX) <strong>and</strong> CME Group 7 .Among the various product types, index options are the most actively traded, surpassingcurrency futures in 2011/12 — contributing 40% of the NSE’s total derivatives volume,compared to 32% for currency futures (see Figure 4-3). In respect of trading activity byunderlying, option contracts on the S&P CNX Nifty Index were the most active in the year2011, contributing 39% of the total 8 . It was followed by futures contracts on US dollar (US$)against Indian Rupee (32%), option contracts on US$ against Indian Rupee (11%) <strong>and</strong> futurescontracts on the S&P CNX Nifty Index (6%). Stock futures <strong>and</strong> stock options accountedfor 7.3% <strong>and</strong> 1.5% respectively of the total (see Table 4-1).Table 4-1. Top 5 derivatives products by contract volume on NSE (2011)Rank <strong>Derivatives</strong> Contract volume % of total1 S&P CNX Nifty Index Options 868,684,582 39.5%2 US Dollar/Indian Rupee Futures 697,825,411 31.7%3 US Dollar/Indian Rupee Options 252,807,126 11.5%4 S&P CNX Nifty Index Futures 123,144,880 5.6%5 EUR/Indian Rupee Futures 18,065,186 0.8%- All individual stock futures 160,878,260 7.3%- All individual stock options 33,172,963 1.5%- Others 45,788,242 2.1%All NSE products 2,200,366,650 100.0%Source: FIA statisticsAlthough the BSE is the first exchange to offer equity derivatives in India (SENSEX futuresin 2000), it captured only a 1%-3% market share in equity derivatives each year in the pastdecade. In view of this lacklustre performance, the BSE introduced a series of LiquidityEnhancement Incentive Programmes (LEIPS) in late September 2011 to boost lastingliquidity in the segment. As a result, total trading volume in the BSE derivatives marketincreased from 6,000 contracts in 2010/11 to 32 million contracts in 2011/12 contributedmainly by equity derivatives — 77% in 2011/12 by index options <strong>and</strong> 22% by index futuresproducts (mainly SENSEX Index futures). (See Figure 4-3.)78Source: FIA statistics. It should be noted that the contract sizes of the NSE’s products are much smallerthan the US st<strong>and</strong>ards. For example, the multiplier of the NSE’s S&P CNX Nifty Index futures/options isINR100 (US$1.9 as of end-2011) per index point, with a contract size of US$8,324, compared with US$50per index point for CME’s E-mini S&P 500 Index futures, with a contract size of US$62,880 as of end-2011;the contract size of the NSE’s US dollar/Indian Rupee futures/options is US$1,000, compared with €125,000(US$162,156) for CME’s Euro FX futures.Source: FIA statistics- 16 - Research & Corporate Development, HKEx31 December 2012
Number of contracts (million)Number of contracts (million)<strong>The</strong> <strong>BRICS</strong> <strong>Securities</strong> <strong>and</strong> <strong>Derivatives</strong> <strong>Markets</strong>Figure 4-3.NSEContract volume of all financial derivatives on the NSE <strong>and</strong> the BSE(2002/03 – 2011/12)2,5002,0001,5001,0005000[ ] Total contract volume( ) % share[17] [57] [77]Contract volume of financial derivatives in NSE (2002/03 - 2011/12)[690]33212[425](31%)[219] 55222[158]204(48%)81 10581 157[1,058]33379(36%)341(32%)[1,784]3714712(40%)651(36%)36[2,179]272(12%)701(32%)864(40%)(32%) 146 186 158210(30%)178 165 1462002/03 2003/04 2004/05 2005/06 2006/07 2007/08 2008/09 2009/10 2010/11 2011/12Reporting yearIndex Futures Stock Futures Index OptionsBSE3530Stock Options Currency Futures Currency OptionsContract volume of financial derivatives in BSE (2002/03 - 2011/12)[ ] Total contract volume( ) % share[32]252025(77%)151050[0.1] [0.4] [0.5] [0.0002][1.8]2[7.5]7(96%)[0.7][0.009] [0.006]7(22%)2002/03 2003/04 2004/05 2005/06 2006/07 2007/08 2008/09 2009/10 2010/11 2011/12Reporting yearIndex Futures Stock Futures Index Options Currency FuturesNotes:(1) <strong>The</strong> reporting year covers April each year to March the following year.(2) Contract volume figures of the NSE’s interest rate futures <strong>and</strong> the BSE’s stock options are too small to beidentifiable in the chart.(3) <strong>The</strong> volume of the BSE’s products grew very strongly in 2011/12 after the launch of a series of LiquidityEnhancement Incentive Programmes in late September 2011.Sources: NSE statistics <strong>and</strong> SEBI BulletinsIn the <strong>BRICS</strong> Exchange Alliance, futures on SENSEX, one of the benchmark indices of theIndian stock market, is the cross-listed product. Figure 4-4 shows the monthly tradingvolume of SENSEX Index futures on the BSE from January 2011 to June 2012 (where data isavailable) <strong>and</strong> the daily closing of the underlying index for the past decade. <strong>The</strong> averagedaily volume was 57,433 contracts in 2012 up to June.- 17 - Research & Corporate Development, HKEx31 December 2012
SENSEX Index daily closing (points)Future trading volume (million contracts)<strong>The</strong> <strong>BRICS</strong> <strong>Securities</strong> <strong>and</strong> <strong>Derivatives</strong> <strong>Markets</strong>Figure 4-4.Daily closing of SENSEX Index <strong>and</strong> monthly trading volume ofSENSEX Index futures on the BSE (2002 – 2012H1)SENSEX daily closing <strong>and</strong> monthly volume of SENSEX Index futures (2002 - 2012H1)25,0004SENSEX Index futures monthly volumeSENSEX Index daily closing21005 (2010/11/05)17430 (2012/06/29)20,000315,000210,0005,0003264 (2002/01/01)12834 (2002/10/28)02002 2003 2004 2005 2006 2007 2008 2009 2010 2011 20120Note: Volume figures of SENSEX Index Futures are available since January 2011 <strong>and</strong> those before late 2011are too small to be identifiable in the chart.Sources: Reuters <strong>and</strong> FIA4.4 Other international cooperation initiativesAlliances that the Indian exchanges have reached with their overseas counterparts are mainlyin the area of derivatives product development.<strong>The</strong> NSE has established a cross-listing relationship with CME Group for the listing of futurescontracts on the NSE’s S&P CNX Nifty Index in the US <strong>and</strong> futures <strong>and</strong> options contracts onthe two US indices S&P 500 Index (S&P 500) <strong>and</strong> Dow Jones Industrial Average (DJIA) inIndia. <strong>The</strong> NSE has also partnered with Singapore Exchange (SGX) in the listing of futures<strong>and</strong> options contracts on S&P CNX Nifty Index in Singapore. Launched in 2000, SGX’sS&P CNX Nifty Index futures achieved a significant trading volume — 14.7 million contractsin 2011, representing 20% of SGX’s total derivatives volume. On the other h<strong>and</strong>, themini-futures contracts on the index launched by CME Group in 2010 had only about 46,000contracts traded in 2011.Reciprocally, the NSE launched S&P 500 futures <strong>and</strong> options <strong>and</strong> DJIA futures in August2011, which achieved average daily volumes of 1,846 contracts, 99 contracts <strong>and</strong> 2,464contracts respectively in the first half of 2012. <strong>The</strong> next attempt of the NSE to offer tradingof futures <strong>and</strong> options on foreign indices in India was made in May 2012 when it partneredwith FTSE Group (part of LSE Group) to launch FTSE 100 Index futures <strong>and</strong> optionscontracts. <strong>The</strong>se products achieved average daily volumes of 5,064 contracts <strong>and</strong> 830contracts respectively up to June 2012. <strong>The</strong> NSE, which has signed a “letter of support” onthe <strong>BRICS</strong> Exchange Alliance, has not joined the other alliance members in the cross-listingof benchmark equity index products.- 18 - Research & Corporate Development, HKEx31 December 2012
<strong>The</strong> <strong>BRICS</strong> <strong>Securities</strong> <strong>and</strong> <strong>Derivatives</strong> <strong>Markets</strong><strong>The</strong> BSE, whose shareholders include DB <strong>and</strong> SGX (5% each), partnered with Eurex of theDB Group to launch SENSEX Index futures <strong>and</strong> options in Germany in October 2010.However, little or no trading has been recorded since then. In addition, the BSE agreed withthe US International <strong>Securities</strong> Exchange (ISE) of the DB Group for the introduction ofderivatives based on ISE’s indices in India. However, such products are not yet launched.Separately, the BSE signed a MOU with the Osaka <strong>Securities</strong> Exchange (OSE) in April 2011for the development of financial markets in India <strong>and</strong> Japan.To promote sustainable investment practices in its market, the BSE joined in October 2012 theSustainable Stock Exchange Initiative which is promoted by five global exchanges —NASDAQ OMX, BM&FBOVESPA, the JSE, Egyptian Exchange <strong>and</strong> the Istanbul StockExchange.5. CHINA/HONG KONGMainl<strong>and</strong> China <strong>and</strong> <strong>Hong</strong> <strong>Kong</strong> operate independent securities <strong>and</strong> derivatives markets,under different rules <strong>and</strong> regulations <strong>and</strong> with different market infrastructure. In Mainl<strong>and</strong>China, there are two stock exchanges ― the Shanghai Stock Exchange (SHSE) <strong>and</strong> theShenzhen Stock Exchange (SZSE); one financial derivatives exchange ― China FinancialFutures Exchange (CFFEX); <strong>and</strong> three commodities exchanges ― Shanghai FuturesExchange (SHFE), Dalian Commodity Exchange (DCE) <strong>and</strong> Zhengzhou CommodityExchange (ZCE) which offer futures trading on commodities. Apart from that, there is anational off-exchange (over-the-counter) trading system ― the Agency Share Transfer System― for the trading of delisted stocks <strong>and</strong> for technology growth companies. 9 In <strong>Hong</strong> <strong>Kong</strong>,HKEx is the dominant exchange operating both the securities <strong>and</strong> the derivatives market.This section focuses on the stock exchanges <strong>and</strong> the financial derivatives exchanges in theChina/<strong>Hong</strong> <strong>Kong</strong> markets, although the Mainl<strong>and</strong> exchanges are not yet members of the<strong>BRICS</strong> Exchange Alliance.<strong>The</strong> China <strong>Securities</strong> Regulatory Commission (CSRC) is the securities <strong>and</strong> futures marketregulator in Mainl<strong>and</strong> China. It regulates the exchanges <strong>and</strong> clearing houses, marketintermediaries, investment fund companies <strong>and</strong> other service providers in the market. <strong>The</strong>People’s Bank of China (PBOC, the Central Bank) <strong>and</strong> the China Banking RegulatoryCommission (CBRC) are responsible for the regulation of the banks which provide servicesfor the securities <strong>and</strong> futures market. <strong>The</strong> China Insurance Regulatory Commission (CIRC)is responsible for regulating the insurance companies, including their scope <strong>and</strong> degree ofparticipation in the securities <strong>and</strong> futures markets. In the process of gradual market opening,the CSRC works with the other two regulators <strong>and</strong> other government authorities, including theState Administration of Foreign Exchange, in formulating related policies <strong>and</strong> regulations.9<strong>The</strong>re are also numerous local equity or property rights exchanges in the Mainl<strong>and</strong>, which provide tradingvenues for the shares <strong>and</strong> assets of non-listed companies. <strong>The</strong>se are outside the scope of the current article.- 19 - Research & Corporate Development, HKEx31 December 2012
<strong>The</strong> <strong>BRICS</strong> <strong>Securities</strong> <strong>and</strong> <strong>Derivatives</strong> <strong>Markets</strong>In <strong>Hong</strong> <strong>Kong</strong>, the <strong>Securities</strong> <strong>and</strong> Futures Commission (SFC) is the securities <strong>and</strong>derivatives market regulator while the <strong>Hong</strong> <strong>Kong</strong> Monetary Authority (HKMA) is thefrontline regulator of banks which conduct securities <strong>and</strong> futures businesses.5.1 <strong>Securities</strong> marketOf the exchanges in the China/<strong>Hong</strong> <strong>Kong</strong> markets, only HKEx is currently a member of the<strong>BRICS</strong> Exchange Alliance. It operates a Main Board <strong>and</strong> the Growth Enterprise Market(GEM). Listed securities include equities, equity warrants, derivative warrants, CallableBull/Bear Contracts (CBBCs) 10 , debt securities <strong>and</strong> funds (including ETFs). Clearing <strong>and</strong>settlement is performed by the <strong>Hong</strong> <strong>Kong</strong> <strong>Securities</strong> Clearing Company (HKSCC) on animmobilised basis. <strong>Securities</strong> registration is performed at the share registrars.On the Mainl<strong>and</strong>, the SHSE operates a Main Board while the SZSE operates a Main Board, aSmall <strong>and</strong> Medium sized Enterprise (SME) Board (launched on 24 June 2004) under the MainBoard, <strong>and</strong> a separate board, ChiNext, for growth enterprises (launched on 30 October 2009).Listed securities on the SHSE <strong>and</strong> SZSE include equities, government bonds, corporate bonds(including convertibles), equity warrants, investment funds (including ETFs) <strong>and</strong> bondrepurchases. <strong>Securities</strong> clearing, settlement <strong>and</strong> registration is performed by the China<strong>Securities</strong> Depository & Clearing Corporation (SD&C) 11 in electronic book-entry form asthe Mainl<strong>and</strong> securities market is already dematerialised.<strong>The</strong> Mainl<strong>and</strong> securities market is partly opened to foreign investors through the QualifiedForeign Institutional Investor (QFII) scheme for investment in A shares <strong>and</strong> through thespecialised equity product, B shares, which are traded in foreign currencies. <strong>The</strong> investmentof QFIIs is subject to authorised investment quota controlled by the Mainl<strong>and</strong> Government.B shares were originally designed for foreign investors but were subsequently opened todomestic residents in February 2001. <strong>The</strong> <strong>Hong</strong> <strong>Kong</strong> market, on the other h<strong>and</strong>, is an openmarket without restriction on investor participation <strong>and</strong> fund flows.<strong>The</strong> <strong>Hong</strong> <strong>Kong</strong> market <strong>and</strong> the Shanghai market have comparable market size by value oflisted companies while the Mainl<strong>and</strong> markets have higher turnover value. Figure 5-1 showsthe trend in market capitalisation <strong>and</strong> turnover for the three markets in the past decade. As atthe end of 2011, the market capitalisation of HKEx was US$2,258 billion <strong>and</strong> that of theSHSE was US$2,355 billion. Among the three, the SHSE has the largest average dailyturnover value (US$30 billion in 2011 vs US$13 billion for the SZSE <strong>and</strong> US$9 billion forHKEx) while the SZSE has the highest equity turnover ratio (227% in 2011 vs 160% forSHSE & 69% for HKEx).1011CBBCs are a kind of structured product issued by a third party, usually an investment bank, that tracks theperformance of an underlying asset without requiring investors to pay the full price required to own theactual asset.SD&C is the securities central clearing house established by the two exchanges, which operates two branchcompanies in Shanghai <strong>and</strong> Shenzhen to serve the respective markets.- 20 - Research & Corporate Development, HKEx31 December 2012
Equity market capitalisation (MC)Total market turnover value (TV)<strong>The</strong> <strong>BRICS</strong> <strong>Securities</strong> <strong>and</strong> <strong>Derivatives</strong> <strong>Markets</strong>US$bn4,0003,500Figure 5-1.Equity market capitalisation <strong>and</strong> total market turnover valueon SHSE, SZSE (2002 <strong>and</strong> - 2011) HKEx (2002 - 2011)Equity market capitalisation <strong>and</strong> total market turnover value on SHSE, SZSE & HKEx7,215US$bn8,0007,0003,0006,0002,5002,0001,5001,0002,3552,2583,0662,2091,0545,0004,0003,0002,0005001,00002002 2003 2004 2005 2006 2007 2008 2009 2010 2011SHSE TV SZSE TV HKEx TVSHSE MC SZSE MC HKEx MC0Source: Monthly statistics of SHSE amd SZSE, HKEx Fact Books 2002-2011.Figure 5-2 shows the trading composition by type of security on the markets. <strong>Securities</strong>trading on the SHSE is contributed almost equally by equities <strong>and</strong> debt securities while thaton the SZSE is dominated by equities. A significant proportion of HKEx’s securities tradingis contributed by structured products including derivative warrants <strong>and</strong> CBBCs.Trading composition by security type on SHSE, SZSE <strong>and</strong> HKEx(2011)Figure 5-2. Trading composition by security type on SHSE, SZSE <strong>and</strong> HKEx (2011)US$55 bn (1%)US$46 bn (1%)US$55 bn(2%)US$89 bn(3%)US$577 bn(26%)US$3,770 bn(52%)US$2,922 bn(95%)US$1,554 bn(70%)Total (US$bn)SHSE 7,215SZSE 3,066HKEx 2,209US$77 bn(4%)US$3,344 bn(46%)Equities Debt securities Funds Structured productsSource: Monthly statistics of the respective exchanges.- 21 - Research & Corporate Development, HKEx31 December 2012
Funds raised (FR) by NLCsNo. of newly listed companies (NLC)<strong>The</strong> <strong>BRICS</strong> <strong>Securities</strong> <strong>and</strong> <strong>Derivatives</strong> <strong>Markets</strong>Figure 5-3 shows the new listing activities on the markets. SZSE, which offers a listingplatform for smaller companies, has attracted the most number of listings since 2007. Fundsraised by newly listed companies on HKEx has been the highest among the three exchangessince 2009.Figure 5-3.Number of <strong>and</strong> funds raised by newly listed companies (NLC) onSHSE, SZSE <strong>and</strong> HKEx (2002 - 2011)Number of <strong>and</strong> funds raised by newly listed companies on SHSE, SZSE & HKEx(2002 - 2011)US$bn703213506060.357.83005042.945.52432504037.52003032.028.728.733.51502010010118.41018915.1907116.162 846910.78.5 9.2525.9352.14.4392526136 92002 2003 2004 2005 2006 2007 2008 2009 2010 2011SHSE FR by NLC SZSE FR by NLC HKEx FR by NLCSHSE NLC SZSE NLC HKEx NLC100500Source: Monthly statistics of the respective exchanges.5.2 Financial derivatives marketHKEx, a member of the <strong>BRICS</strong> Exchange Alliance, offers trading in various products,comprising equity index futures <strong>and</strong> options, single-stock futures <strong>and</strong> options, <strong>and</strong> otherproducts 12 on its derivatives market. In the Mainl<strong>and</strong>, CFFEX is the only exchangeoffering financial derivatives. <strong>The</strong> only product currently available for trading is the CSI300Index futures, which started trading since 16 April 2010. In February 2012, CFFEXcommenced simulated trading in government bond futures which has been suspended sinceMay 1995 after serious market malpractices. In 2011, the average daily contract volume onHKEx <strong>and</strong> CFFEX was 572,275 contracts <strong>and</strong> 206,606 contracts respectively.Figure 5-4 shows the trading composition by product type on the two exchanges.<strong>Derivatives</strong> trading on HKEx in terms of number of contracts is dominated by optionsproducts, mainly stock options (53% in 2011). Equity index futures contributed 36% —16% by Hang Seng Index futures st<strong>and</strong>ard contracts, the cross-listed product in the <strong>BRICS</strong>Exchange Alliance. Figure 5-5 shows the monthly trading volume of this contract on HKExover the past decade. <strong>The</strong> average daily trading volume for the product was 94,036 contractsin 2011, 4 times that ten years ago.12Other products are interest rate futures, fixed income futures <strong>and</strong> gold futures.<strong>The</strong>ir volumes are minimal.- 22 - Research & Corporate Development, HKEx31 December 2012
HSI daily closing (points)Trading volume (mil contracts)<strong>The</strong> <strong>BRICS</strong> <strong>Securities</strong> <strong>and</strong> <strong>Derivatives</strong> <strong>Markets</strong>Figure Trading 5-4. Trading composition composition by derivatives by derivatives product product type on type CFFEX on CFFEX <strong>and</strong> HKEx <strong>and</strong> HKEx(No. of of contracts) (2011)74.3m(53%)50.4m(100%)50.3 m(36%)ContractsHKEx 140,493,472CFFEX 50,411,86015.4 m(11%)0.4(0%)Equity index futures Equity index options Single-stock futures Single-stock optionsSource: Annual statistics of CFFEX, HKEx Fact Book 2011.Figure 5-5. Hang Seng Index (HSI) daily closing <strong>and</strong> monthly trading volumeof HSI futures on HKEx (2002 - 2011)Hang Seng Index (HSI) daily closing <strong>and</strong> monthly trading volume of HSI futures (2002 - 2011)3500030000HSI futures monthly volumeHSI daily closing31638.22 (2007/10/30)872500018434.39 (2011/12/30)62000051500011350.85 (2002/01/02)11015.84 (2008/10/27)431000050008409.01(2003/04/25)2102002/01 2003/01 2004/01 2005/01 2006/01 2007/01 2008/01 2009/01 2010/01 2011/01Year/month0Sources: Reuters <strong>and</strong> HKEx Fact Book, 2002-2011Source: Reuters <strong>and</strong> HKEx Fact Books 2002-2011.- 23 - Research & Corporate Development, HKEx31 December 2012
Equity market capitalisation / Equtiy turnover (US$bn)<strong>The</strong> <strong>BRICS</strong> <strong>Securities</strong> <strong>and</strong> <strong>Derivatives</strong> <strong>Markets</strong>6.1 Market segments<strong>The</strong> JSE provides issuance, trading <strong>and</strong> post-trade services across the markets of equities,interest rate products <strong>and</strong> derivatives. Equity products include ordinary <strong>and</strong> preferenceshares, ETFs, warrants, real estate investment trusts (REITs), South African DepositoryReceipts (SADRs) on foreign shares <strong>and</strong> some less typical products (Krugerr<strong>and</strong> gold coins<strong>and</strong> carbon credit notes). <strong>The</strong> interest rate market offers spot trading <strong>and</strong> repo trading incorporate <strong>and</strong> government bonds <strong>and</strong> their related futures products. Other derivativesavailable are futures <strong>and</strong> options on equities, currencies <strong>and</strong> commodities (including metals,crude oil <strong>and</strong> agricultural products) which are traded on the Yield-X business segment of theJSE. Yield-X is in the process of merging its interest rate product segment with BESA afterthe JSE’s acquisition of the latter in 2009.Equity market trading is conducted on the LSE’s latest technology platform, MillenniumExchange. Interest rate <strong>and</strong> derivatives products are traded on the Nutron Trading System.<strong>The</strong> equity clearing system is the Broker Deal Accounting (BDA) System, the back-officesystem that JSE members must use for maintaining their accounting <strong>and</strong> client records.Electronic securities settlement is conducted on a T+5 cycle by Strate for dematerialised orimmobilised securities, including bonds. <strong>Derivatives</strong> products are cleared by the SAFEXClearing Company (SAFCOM), a wholly owned clearing house of the JSE.6.2 Equity market<strong>The</strong> JSE’s equity products are traded on two markets — Main Board <strong>and</strong> AlternativeExchange (AltX). <strong>The</strong> latter caters for smaller companies which are not yet able to list onthe Main Board. <strong>The</strong>re was a third market — Africa Board — for the listing of Africancompanies domiciled outside South Africa but it was closed in April 2012, with the listingsmoved to the Main Board. Over 70 Main Board-listed companies are also dually listed onoverseas exchanges, including Australian Stock Exchange (ASX), the LSE, Nasdaq StockMarket <strong>and</strong> the NYSE. Figure 6-1 shows the growth in market capitalisation of all listedcompanies <strong>and</strong> annual turnover on the JSE equity markets in the past decade.Figure 6-1. Equity market capitalisation <strong>and</strong> turnover on JSE (2002 – 2011)1,2001,000Equity market capitalisation <strong>and</strong> turnover on JSE (2002 - 2011)Equity turnover valueEquity market capitalisation1,0138007158348058566005654002684563014364863493804524072001889611318320202002 2003 2004 2005 2006 2007 2008 2009 2010 2011Sources: Monthly statistics of JSE <strong>and</strong> WFESources: Monthly statistics of JSE <strong>and</strong> WFE- 25 - Research & Corporate Development, HKEx31 December 2012
Capital raised (US$m)No. of newly listed companies<strong>The</strong> <strong>BRICS</strong> <strong>Securities</strong> <strong>and</strong> <strong>Derivatives</strong> <strong>Markets</strong>Figure 6-2 shows key statistics on the JSE’s primary market activities in the same period.During this period, there were not many newly listed companies — the largest number oflistings, 62, was observed in 2007 before the global financial crisis. Alongside, equitycapital raised through means that require publication of a prospectus (including IPOs) wasrarely recorded — the biggest amount was recorded in 2003 (17% of total capital raised).Figure 6-2. Equity capital raised <strong>and</strong> number of newly listed companies on JSE (2002 – 2011)20,000Equity capital raised <strong>and</strong> number of newly listed companies on JSE (2002 - 2011)Capital raised via prospectusCapital raised via other meansNo of newly listed companies[18,268][ ] : Total capital raised16015,000[14,528]120[11,988][12,953][12,405][12,222][10,844]10,00080[7,424]62[8,200]5,000[3,395]9 817 1937231014 164002002 2003 2004 2005 2006 2007 2008 2009 2010 2011Source: JSE monthly statisticsSource: JSE monthly statistics06.3 Interest rate marketVarious types of cash debt instruments, including vanillas, commercial papers, consumer priceindex (CPI)-linked instruments, credit-linked notes <strong>and</strong> equity structured notes, are availableon the JSE’s interest rate market. Compared to the equity market, the bond market is muchmore active in terms of turnover — constituting 87% of total market turnover value in 2011(see Figure 6-3) — despite a much smaller market capitalisation (some 20% that of equities).As at the end of September 2011 (the latest available statistics), there were 1,137 bonds listedon the JSE, with a total market capitalisation of ZAR1,414 billion (US$176 billion). <strong>The</strong>majority of these bonds were issued by corporates (mostly by banks) but in value terms it wasdominated by government <strong>and</strong> public organisation issues (see Figure 6-4). In 2011, therewere 733 newly issued bonds, with a nominal value of ZAR378 billion (US$47 billion).- 26 - Research & Corporate Development, HKEx31 December 2012
<strong>The</strong> <strong>BRICS</strong> <strong>Securities</strong> <strong>and</strong> <strong>Derivatives</strong> <strong>Markets</strong>Figure 6-3. Market share of equity products, bonds <strong>and</strong> bond reposMarket share of equity products, bonds <strong>and</strong> bond repos in turnover value on JSE (2011)in turnover value on JSE (2011)Equity products*13%Bond repos58%Bonds29%* Equity products include ordinary shares, debentures, DRs, ETFs, ETNs, funds, warrants <strong>and</strong> REITs.Source: JSE monthly statisticsFigure 6-4.Distribution in number <strong>and</strong> market capitalisation of bond listingson JSE by type (Sep 2011)(a) No. of listingsTotal turnover value: US$3,216,719m* Equity products include ordinary shares, debentures, depository receipts, ETFs, ETNs, funds, warrants <strong>and</strong> REITs.Source: JSE monthly statisticsNo. of bond listings on JSE by type (Sep 2011)Market capitalisation of bond listings on JSE by type (Sep 2011)(b) Market capitalisationWater authorities1%State-owned enterprises4%Municipal government1%Central government7%Corporates57%SPVs*27%Municipal government1%Water authorities2%State-ownedenterprises13%Corporates19%Central government60%SPVs*6%Others^1%Others^3%Total: 1,137Total no. of listings: 1,137Total: US$176 billion Total market cap: US$176 billion* SPVs are special purpose vehicles, which are backed by single assets or pools of assets.^ “Others” includes bonds issued by non-resident organisations.Note: Numbers may not add up to 100% due to rounding.* Special purpose vehicles (SPVs) are backed by single assets or pools of assets.^ Others include bonds issued by non-resident organisations.Source: JSE Quarterly Review of Interest Rate MarketSource: JSE Quarterly Review of Interest Rate Market, 2011Q36.4 Financial derivatives market* Special purpose vehicles (SPVs) are backed by single assets or pools of assets.^ Others include bonds issued by non-resident organisations.Note: Numbers do not add up to 100% due to rounding.Source: JSE Quarterly Review of Interest Rate Market<strong>The</strong> JSE derivatives market is dominated by financial derivatives, the underlying assets ofwhich are equities, currencies <strong>and</strong> interest rates. Among them, equity derivatives are themost actively traded. Almost 99% of the total derivatives trading volume <strong>and</strong> open interestin 2011 came from financial derivatives <strong>and</strong> over 88% is attributable to equity derivatives.Single-stock futures <strong>and</strong> options (available for both domestic <strong>and</strong> foreign stocks) had a 57%dominant share in equity derivatives trading volume, in which single-stock futures had abigger share than single-stock options (49% vs 8%). Notably, single-stock dividend futures- 27 - Research & Corporate Development, HKEx31 December 2012
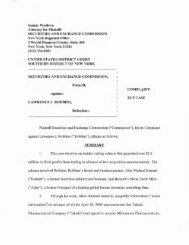
<strong>The</strong> <strong>BRICS</strong> <strong>Securities</strong> <strong>and</strong> <strong>Derivatives</strong> <strong>Markets</strong>also had a substantial share (27%). Index futures (including volatility index futures) <strong>and</strong>options accounted for only 15% of the equity derivatives trading volume with the majority(9%) came from a single product — futures on the FTSE/JSE Top 40 Index, the benchmarkindex of the South African stock market. (See Figure 6-5.)Although the JSE does not operate an OTC market, it seeks to incorporate the flexibility ofOTC derivatives into listed derivatives by introducing “Can-Do” futures <strong>and</strong> options, whichallow investors to negotiate the contract terms in respect of the underlying asset <strong>and</strong> expirydate. <strong>The</strong> underlying asset may be a single stock, an index or a basket of shares. Similar tomany OTC derivatives, Can-Do futures <strong>and</strong> options are not suitable for general retailinvestors given the considerable minimum contract size of ZAR10 million. <strong>The</strong>ycontributed only 1% of the equity derivatives trading volume in 2011.Figure 6-5.Distribution of JSE derivatives trading volume <strong>and</strong> open interestby product type (2011)<strong>Derivatives</strong> market trading volume of JSE by product type (2011)(a) Trading volume<strong>Derivatives</strong> market open interest of JSE by product type (2011)(b) Open interestCommodities F&O*2%Interest rate F&O1%Commodities F&O*1%Interest rate F&O4%Currencies F&O9%Equity options10%Equity futures79%Currencies F&O6%Equity options17%Equity futures72%Total no. of contracts: 167,503,211 Total no. of contracts: 167,503,211Total no. of contracts: 13,321,940Total no. of contracts: 13,321,940* Agricultural products, crude oil <strong>and</strong> metalsNote: Numbers do not add up to 100% due to roundingSource: JSE monthly statistics(c) Trading volume of equity derivatives* Agricultural by underlying products, crude asset oil <strong>and</strong> metalsEquity derivatives trading volume of JSE by underlying asset (2011)Source: JSE monthly statisticsCan-do F&O1%Other index F&O6%Single-stock futures^49%FTSE/JSE Top 40 Indexfutures9%Single-stock dividendfutures^27%Single-stock options8%Total no. of contracts: 148,821,912 Total no. of contracts: 148,821,912* Agricultural products, crude oil <strong>and</strong> metals^ Including ^ International Including International <strong>Derivatives</strong> (IDX), which which are futures are on futures internationally internationally listed shares listed sharesSource: JSE monthly statisticsNote: Numbers may not add up to 100% due to rounding.Source: JSE monthly statistics- 28 - Research & Corporate Development, HKEx31 December 2012
Daily index closing (points)Futures trading volume (mil contracts)<strong>The</strong> <strong>BRICS</strong> <strong>Securities</strong> <strong>and</strong> <strong>Derivatives</strong> <strong>Markets</strong>Futures contract on FTSE/JSE Top 40 Index is the first cross-listed product of the JSE for the<strong>BRICS</strong> Alliance. This index was launched in June 2002 by the JSE <strong>and</strong> FTSE (now part ofLSE Group) to replace JSE’s benchmark index at that time. Figure 6-6 shows the dailyclosing <strong>and</strong> the monthly futures trading volume of this index from 2002 to 2011. Since theindex futures is a quarter-month contract, it assumes a 3-month pattern of exceptionally highvolume at quarter-end months when roll-over takes place. In 2011, this futures productconstituted 72% of the total trading volume of all index futures on the JSE, with an averagedaily trading volume of 53,070 contracts.Figure 6-6.3500030000Daily closing <strong>and</strong> monthly futures trading volume of FTSE/JSE Top 40 IndexDaily closing <strong>and</strong> monthly futures trading volume of FTSE/JSE Top40 Indexon JSE (2002 – 2011)Monthly index futures volumeDaily index closing(2002 - 2011)31315(2008/05/22)762500052000028469(2011/12/30)41500010336(2002/01/02)15905(2008/11/20)31000050006763(2003/04/25)2102002/01 2003/01 2004/01 2005/01 2006/01 2007/01 2008/01 2009/01 2010/01 2011/01Year/monthSources: Reuters <strong>and</strong> <strong>and</strong> FIA FIA06.5 Other international cooperation initiatives<strong>The</strong> JSE is one of the ten member exchanges of the Committee of SADC Stock Exchanges(COSSE). SADC is the Southern African Development Community, the aim of which is tocreate a community providing for regional peace <strong>and</strong> security, <strong>and</strong> an integrated regionaleconomy. COSSE seeks to contribute to the establishment of a regional common market byfacilitating regional integration in the finance <strong>and</strong> investment field. To enhance regionalcooperation, the JSE has signed MOU on cooperation with a number of regional exchanges,including exchanges in Namibia, Kenya, Nigeria, Ghana, Mauritius <strong>and</strong> Egypt. In Asia, theJSE signed a MOU with the TWSE in 2003.LSE Group has been an important technology <strong>and</strong> business partner of the JSE since 2002when the latter launched the SETS trading system provided by LSE Group. <strong>The</strong> JSE’s SETSsystem was replaced by another LSE platform — TradElect — in April 2007. In July 2012,the system was further upgraded to the Millennium Exchange platform of LSE Group. <strong>The</strong>LSE <strong>and</strong> JSE also reached an agreement in 2002 on dual listing, remote access <strong>and</strong> marketing- 29 - Research & Corporate Development, HKEx31 December 2012
<strong>The</strong> <strong>BRICS</strong> <strong>Securities</strong> <strong>and</strong> <strong>Derivatives</strong> <strong>Markets</strong>activities. As for the cooperation on derivatives products, the JSE has signed licensingagreements with CME Group to launch futures on corn, precious metals <strong>and</strong> crude oil.Before BESA was acquired by the JSE, it formed a partnership with NASDAQ OMX tolaunch BondClear, a new clearing house for OTC interest rate derivatives in South Africa.NASDAQ OMX initially had a 20% stake in BondClear but the stake was subsequently soldto the JSE. BondClear is now wholly owned by the JSE <strong>and</strong> is awaiting a clearing houselicence from the FSB.<strong>The</strong> JSE has been an active promoter of socially responsible investment (SRI) among SouthAfrican listed companies. A further step was taken in June 2012 when the JSE, NASDAQOMX, BM&FBOVESPA, Istanbul Stock Exchange <strong>and</strong> Egyptian Stock Exchange announcedtheir joint commitment to promote long-term sustainable investment <strong>and</strong> improvedenvironmental, social <strong>and</strong> corporate governance disclosure <strong>and</strong> performance among theirlisted companies.* * *Disclaimer<strong>The</strong> analysis <strong>and</strong> framework of this paper are developed by Research & Corporate Development Departmentbased on the information derived from sources believed to be reliable. Any views <strong>and</strong> comments in this papercaptured within the framework do not necessarily represent those of HKEx.- 30 - Research & Corporate Development, HKEx31 December 2012