Changes in soil bacterial community profiles associated with ...
Changes in soil bacterial community profiles associated with ...
Changes in soil bacterial community profiles associated with ...

You also want an ePaper? Increase the reach of your titles
YUMPU automatically turns print PDFs into web optimized ePapers that Google loves.
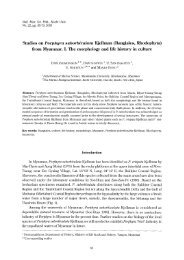
Soil <strong>bacterial</strong> communities reflect<strong>in</strong>g land degradation45AntibioticAmpicill<strong>in</strong>ChloramphenicolDapsonErythromyc<strong>in</strong>Kanamyc<strong>in</strong> sulfateLasalocidNafcill<strong>in</strong>Nalidixic acidNeomyc<strong>in</strong>∙HClNovobioc<strong>in</strong>Penicill<strong>in</strong> GSpect<strong>in</strong>omyc<strong>in</strong>∙2HClStreptomyc<strong>in</strong> sulfateSulfamethoxazoleTetracycl<strong>in</strong>eTrimethoprimMixture 1Mixture 2Bare ground 1Bare ground 2AntibioticAmpicill<strong>in</strong>ChloramphenicolDapsonErythromyc<strong>in</strong>Kanamyc<strong>in</strong> sulfateLasalocidNafcill<strong>in</strong>Nadixic acidNeomyc<strong>in</strong>∙HClNovobioc<strong>in</strong>Penicill<strong>in</strong> GSpect<strong>in</strong>omyc<strong>in</strong>∙2HClStreptomyc<strong>in</strong> sulfateSulfamethoxazoleTetracycl<strong>in</strong>eTrimethoprimMixture 1Mixture 2Dry evergreenforest 10 0.1 0.2 0 0.1 0.2Relative susceptibilityDry evergreenforest 2Relative susceptibilityFig. 3. Profiles of the <strong>soil</strong> samples based on susceptibility of the <strong>soil</strong> <strong>bacterial</strong> communities to theantibiotics. The error bars <strong>in</strong>dicate standard deviations (n=3). The horizontal axes <strong>in</strong>dicatethe relative susceptibility of the <strong>bacterial</strong> <strong>community</strong> to each antibiotic determ<strong>in</strong>ed by the ratiotransformation (see text).than that from DEF 2.Susceptibility patterns of the <strong>bacterial</strong> communities also reflected effects of deforestation (Fig. 3). The <strong>bacterial</strong><strong>community</strong> <strong>in</strong> the BG <strong>soil</strong> had high susceptibility to novobioc<strong>in</strong>, penicill<strong>in</strong>, spect<strong>in</strong>omyc<strong>in</strong>, streptomyc<strong>in</strong>, sulfamethoxazole,tetracycl<strong>in</strong>e and tetracycl<strong>in</strong>e-trimethoprim mixture (mixture 2). The DEF <strong>bacterial</strong> <strong>community</strong> showed high susceptibility topenicill<strong>in</strong>, sulfamethoxazole and the two mixtures. The DEF <strong>soil</strong> samples suggested differences <strong>in</strong> <strong>bacterial</strong> <strong>community</strong>susceptibility patterns between them: the DEF 1 sample had high susceptibility to dapson, while the DEF 2 sample tonovobioc<strong>in</strong> and streptomyc<strong>in</strong>.Fig2,3PCAMethod 1 discrim<strong>in</strong>ated between the sample groups as shown <strong>in</strong> Fig. 4a. The first and second PCs expla<strong>in</strong>ed more than halfof the variation; 44 and 13%, respectively. The sample groups were separated by the first PC axis. The second PC axis didnot separate the sampl<strong>in</strong>g po<strong>in</strong>ts under each of the vegetative types.Method 2 also discrim<strong>in</strong>ated between the <strong>soil</strong> sample groups (Fig. 4b). The first and second PCs expla<strong>in</strong>ed 30 and 19%