Templates and Guidelines for PowerPoint - Rieter
Templates and Guidelines for PowerPoint - Rieter
Templates and Guidelines for PowerPoint - Rieter
You also want an ePaper? Increase the reach of your titles
YUMPU automatically turns print PDFs into web optimized ePapers that Google loves.
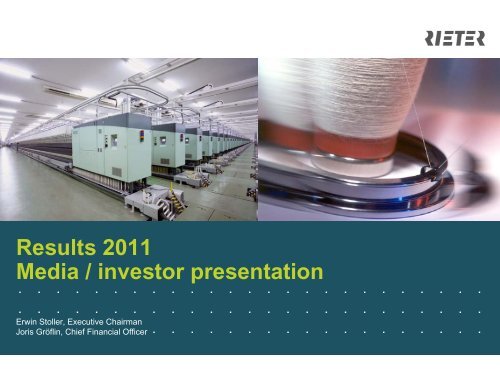
Results 2011<br />
Media / investor presentation<br />
. . . . . . . . . . . . . . . . . . . . . . . . .<br />
. . . . . . . . . . . . . . . . . . . . . . . . .<br />
Erwin Stoller, Executive Chairman<br />
Joris Gröflin, Chief Financial Officer<br />
. . . . . . . . . . . . . . . . . . . . . . . . .
Agenda<br />
. . . . .<br />
. . . . .<br />
. . . . .<br />
. . . . .<br />
. . . . .<br />
. . . . .<br />
. . . . .<br />
. . . . .<br />
. . . . .<br />
Results 2011 March 2012<br />
1. Introduction <strong>and</strong> summary of 2011 Erwin Stoller<br />
2. Financial results 2011 Joris Gröflin<br />
3. Strategic focus Erwin Stoller<br />
4. Outlook Joris Gröflin<br />
2
2011: Key messages today<br />
“<strong>Rieter</strong> is now focused on textile machinery <strong>and</strong> components after a smooth<br />
separation <strong>and</strong> achieved major steps in the implementation of its strategy. Sales<br />
<strong>and</strong> profitability have been increased significantly. <strong>Rieter</strong> returns to the policy of<br />
paying cash dividends – a dividend of 6 CHF per share has been proposed <strong>for</strong><br />
2011.”<br />
Erwin Stoller<br />
Executive Chairman<br />
Results 2011 March 2012<br />
3
<strong>Rieter</strong> – Highlights 2011<br />
Clear focus on profitable growth in textile machinery <strong>and</strong> components<br />
Strategic<br />
Operational<br />
Financial<br />
Dividend<br />
policy<br />
Results 2011 March 2012<br />
• Clear focus on textile machinery <strong>and</strong> components since May 13, 2011, through<br />
separation of <strong>for</strong>mer Division Automotive<br />
• Market position both in machinery <strong>and</strong> components strengthened<br />
• Increased flexibility through divestments of Lakshmi (LMW) shares <strong>and</strong> Czech<br />
production facilities<br />
• Innovations realized in all end-spinning <strong>and</strong> spinning preparation technologies – both in<br />
components <strong>and</strong> machinery<br />
• Success with local products in China <strong>and</strong> India<br />
• Expansion in China <strong>and</strong> India on track<br />
• Significant sales growth of 22% to 1061 million CHF achieved. Order intake with 958<br />
million CHF at a good level resulting in an order backlog of above 600 million CHF at<br />
year-end<br />
• Significant increase in profitability to an EBIT margin of 10.8% of corporate output<br />
• Strong free cash flow of 79.5 million CHF generated<br />
• Dividend of 6 CHF per share out of reserves from capital contributions proposed<br />
• Dividend proposal results in dividend yield of 4.25%<br />
4
<strong>Rieter</strong> – Operational Highlights 2011<br />
Progress in Asia <strong>and</strong> in innovations, process improvements started<br />
Expansion in Asia<br />
Example:<br />
Plant in China (Changzhou)<br />
Results 2011 March 2012<br />
Innovation Process improvements<br />
Example:<br />
Airjet J 20 <strong>and</strong> Rotor Box S 60<br />
Example:<br />
Lean manufacturing <strong>and</strong> global<br />
process improvement<br />
5
<strong>Rieter</strong> – At a glance<br />
<strong>Rieter</strong> is a leading supplier of short staple textile machinery <strong>and</strong> components<br />
• <strong>Rieter</strong> – an industrial group based in Winterthur, CH, operating on a global scale<br />
• Formed in 1795, <strong>and</strong> a leading supplier of short-staple spinning machinery <strong>and</strong><br />
technology components<br />
• Widest product range in this industrial sector worldwide<br />
• Global presence in 9 countries with 18 manufacturing facilities <strong>and</strong> a work<strong>for</strong>ce of about<br />
4 700 employees worldwide (28% of work<strong>for</strong>ce is based in Switzerl<strong>and</strong>)<br />
• <strong>Rieter</strong> – a strong br<strong>and</strong> with a long tradition<br />
• <strong>Rieter</strong>’s innovative momentum has been a powerful driving <strong>for</strong>ce <strong>for</strong> industrial progress.<br />
• Products <strong>and</strong> solutions are ideally tailored to its customers’ needs <strong>and</strong> are increasingly<br />
also produced in customers’ markets.<br />
• <strong>Rieter</strong> aspires to achieve sustained growth in enterprise value <strong>for</strong> the benefit of<br />
shareholders, customers <strong>and</strong> employees<br />
• Seeking to maintain continuous growth in sales <strong>and</strong> profitability<br />
• Primarily by organic growth, but also through strategic alliances <strong>and</strong> acquisitions<br />
• The company comprises two Business Groups:<br />
• Spun Yarn Systems (SYS) develops <strong>and</strong> manufactures machinery <strong>and</strong> systems <strong>for</strong><br />
processing natural <strong>and</strong> man-made fibers <strong>and</strong> their blends into yarns<br />
• Premium Textile Components (PTC) supplies technology components <strong>and</strong> service<br />
offerings to spinning mills <strong>and</strong> also to machinery manufacturers<br />
Results 2011 March 2012<br />
6
<strong>Rieter</strong> – Broadest global systems supplier<br />
Legend<br />
Sales<br />
Service<br />
R&D<br />
Production<br />
Americas<br />
Results 2011 March 2012<br />
Global supplier… …of spinning machinery <strong>and</strong> components<br />
Europe<br />
Full-liner…<br />
From bale… …to yarn<br />
Asia<br />
Preparation<br />
[Pic] [Pic]<br />
…covering preparation <strong>and</strong><br />
all four spinning technologies<br />
High/import segment<br />
Mid/local segment<br />
Ring conventional (1)<br />
Ring compact (2)<br />
Rotor (3)<br />
Air-Jet (4)<br />
7
Management team <strong>and</strong> Board of Directors<br />
Spun Yarn Systems (SYS)<br />
Peter Gnägi<br />
Results 2011 March 2012<br />
General Counsel<br />
Thomas Anw<strong>and</strong>er<br />
Board of Directors<br />
Erwin Stoller, Chairman<br />
This E. Schneider, Dieter Spälti,<br />
Jakob Baer, Michael Pieper,<br />
Hans-Peter Schwald, Peter Spuhler<br />
Executive Chairman of the<br />
Board<br />
Erwin Stoller<br />
Premium Textile<br />
Components (PTC)<br />
Werner Strasser<br />
Chief Financial Officer<br />
Joris Gröflin<br />
8
Agenda<br />
. . . . .<br />
. . . . .<br />
. . . . .<br />
. . . . .<br />
. . . . .<br />
. . . . .<br />
. . . . .<br />
. . . . .<br />
. . . . .<br />
Results 2011 March 2012<br />
1. Introduction <strong>and</strong> summary of 2011 Erwin Stoller<br />
2. Financial results 2011 Joris Gröflin<br />
3. Strategic focus Erwin Stoller<br />
4. Outlook Joris Gröflin<br />
9
Financial Results 2011<br />
. . . . . . . . . . . . . . . . . . . . . . . . .<br />
. . . . . . . . . . . . . . . . . . . . . . . . .<br />
. . . . . . . . . . . . . . . . . . . . . . . . .<br />
Joris Gröflin, Chief Financial Officer
<strong>Rieter</strong> – Financial Highlights 2011<br />
Significant growth of sales by 22% <strong>and</strong> EBIT by 49% in 2011<br />
Sales<br />
Order intake<br />
Profitability<br />
Net profit<br />
Investments /<br />
Innovation<br />
Free cash<br />
flow<br />
Dividend<br />
policy<br />
Results 2011 March 2012<br />
• Significant sales growth of 22% to 1061 million CHF achieved<br />
• Spun Yarn Systems grew by 28%, Premium Textile Components by 4%<br />
• Good order intake in 2011 at 958 million CHF across all important regions<br />
• Order backlog at above 600 million CHF at year-end<br />
• EBIT margin significantly increased to 10.8% of corporate output (CO)<br />
• Spurn Yarn Systems with 9.4% of CO, Premium Textile Components with 12.9% of CO<br />
• Net profit margin from continued operations at strong 11.4% of corporate output (CO)<br />
• Return on net assets (RONA) increased to 19.8%<br />
• Capital expenditure increase to 57.3 million CHF mainly driven by investments in Asia<br />
• R&D expenditure intensified by 21% to 39.5 Mio CHF (or 3.8% of CO)<br />
• Strong free cash flow of 79.5 million CHF generated<br />
• Net liquidity at solid 159.0 million CHF<br />
• Earnings per share of 25.86 CHF<br />
• Dividend of 6 CHF per share from reserves from capital contributions proposed<br />
11
<strong>Rieter</strong> – Financial key figures<br />
Results 2011 March 2012<br />
Development of key figures by half-year<br />
CHF million FY 2011 H2 2011 H1 2011<br />
Order Intake (1) 958.3<br />
Sales 1060.8<br />
Corporate Output (CO) 1042.5<br />
EBIT (2) 112.6<br />
EBIT margin (of CO) 10.8%<br />
Net profit (3) 119.0<br />
R&D expenditures 39.5<br />
Capex 57.3<br />
287.0 671.3<br />
523.0<br />
490.6<br />
42.0<br />
8.6%<br />
28.0<br />
20.2<br />
42.9<br />
537.8<br />
551.9<br />
70.6<br />
12.8%<br />
91.0<br />
19.3<br />
14.4<br />
FY 2010<br />
1454.6<br />
870.4<br />
841.4<br />
75.7<br />
9.0%<br />
(1) Including cancellations of 113 million CHF in H2 2011, prior cancellations: order intake of 400 million CHF in HY2<br />
(2) Including investments <strong>for</strong> growth of around 10 million CHF <strong>and</strong> investments into process improvements of around<br />
10 million CHF mainly in HY2<br />
(3) Continued operations<br />
82.9<br />
32.5<br />
25.8<br />
12
Orders by Business Group<br />
Good order intake in 2011, down versus peak in 2010 by 34%<br />
CHF million<br />
1.500<br />
1.000<br />
500<br />
0<br />
511<br />
138<br />
344<br />
29<br />
2009<br />
Premium Textile Components<br />
Spun Yarn Systems<br />
Results 2011 March 2012<br />
1.455<br />
235<br />
1.218<br />
2<br />
2010<br />
-34%<br />
Other<br />
958<br />
183<br />
775<br />
2011<br />
• 34% lower orders triggered by both<br />
Business Groups<br />
• SYS: -36% (local currency -34%)<br />
• PTC: -22% (local currency -17%)<br />
• Order intake has been impacted by<br />
cancellations 2011 in HY2 of 113 million<br />
CHF, thereof<br />
• SYS: 108 million CHF<br />
• PTC: 5 million CHF<br />
• Solid order backlog of above 600 million<br />
CHF at year-end<br />
13
Order intake development <strong>and</strong> currency impact<br />
Premium Textile Components business in general less cyclical<br />
CHF million<br />
1.453<br />
Orders<br />
received 2010<br />
Results 2011 March 2012<br />
-40<br />
Premium<br />
Textile<br />
Components<br />
2010 adjusted <strong>for</strong> divestiture<br />
-413<br />
In local currencies<br />
Spun Yarn<br />
Systems<br />
-42<br />
Currency<br />
effects<br />
958<br />
Orders<br />
received 2011<br />
• HY2 drops 57% against<br />
strong HY1<br />
• SYS: -60%<br />
• PTC: -45%<br />
• HY2 order intake adjusted by<br />
cancellations of 113 million<br />
CHF equals 400 million CHF<br />
14
Sales by Business Group<br />
Sales significantly increased by 22% against 2010 to 1061 million CHF<br />
CHF million<br />
1.100<br />
1.000<br />
900<br />
800<br />
700<br />
600<br />
500<br />
400<br />
300<br />
200<br />
100<br />
0<br />
532<br />
128<br />
394<br />
10<br />
2009<br />
Premium Textile Components<br />
Spun Yarn Systems<br />
Results 2011 March 2012<br />
870<br />
191<br />
674<br />
5<br />
2010<br />
+22%<br />
Other<br />
1.061<br />
199<br />
862<br />
2011<br />
• <strong>Rieter</strong> increased sales by 22%<br />
• Spun Yarn Systems (SYS) substantially<br />
increased sales by 28% (in local<br />
currency +32%)<br />
• Premium Textile Components (PTC)<br />
increased sales against already good<br />
previous year by 4% (in local currency<br />
+11%)<br />
15
Sales development <strong>and</strong> currency impact<br />
Currency impacted sales by -5%<br />
CHF million<br />
865<br />
Sales 2010<br />
Results 2011 March 2012<br />
21<br />
Premium<br />
Textile<br />
Components<br />
2010 adjusted <strong>for</strong> divestiture<br />
217<br />
In local currencies<br />
Spun Yarn<br />
Systems<br />
-42<br />
Currency<br />
effects<br />
1.061<br />
Sales 2011<br />
16
Sales distribution <strong>and</strong> development by region<br />
Sales <strong>and</strong> growth are well-distributed across the relevant markets<br />
2011, sales distribution in %<br />
Rest of<br />
Asia<br />
Americas<br />
24%<br />
Results 2011 March 2012<br />
12%<br />
Turkey<br />
Africa<br />
2%<br />
20%<br />
12%<br />
Europe<br />
14%<br />
China<br />
16%<br />
India<br />
2011, sales growth in %<br />
4<br />
46<br />
Europe China<br />
20<br />
India<br />
78<br />
12<br />
Turkey Rest<br />
of Asia<br />
-3<br />
Americas<br />
-21<br />
Africa<br />
17
Operating result (EBIT)<br />
EBIT margin significantly increased to 10.8% of corporate output<br />
In % of CO 9.0%<br />
10.8%<br />
CHF million<br />
120<br />
100<br />
80<br />
60<br />
40<br />
20<br />
0<br />
-20<br />
76<br />
30<br />
42<br />
4<br />
2010<br />
Results 2011 March 2012<br />
+49%<br />
Premium Textile Components<br />
113<br />
35<br />
81<br />
-4<br />
2011<br />
Spun Yarn Systems<br />
• EBIT increased by 49% to 112.6 million CHF in<br />
2011<br />
• Both Business Groups contributed to profitability<br />
increase, mainly through volume growth in the<br />
machinery business (Business Group SYS)<br />
• Increase of R&D to 39.5 million CHF or 3.8% of<br />
corporate output (2010: 32.6 million CHF)<br />
• Margin negatively impacted in second half year by<br />
• market-driven volume slow-down in the highly<br />
profitable components business (PTC)<br />
• pricing pressure on Swiss franc denominated<br />
sales<br />
• Majority of increased investments into expansion in<br />
China <strong>and</strong> India <strong>and</strong> innovation of ~ 10 million CHF<br />
<strong>and</strong> process improvements of ~ 10 million in<br />
second half year<br />
Other / Corporate Functions<br />
18
Net Profit (continued operations) <strong>and</strong> RONA<br />
Net profit margin at strong 11.4% of corporate output<br />
In % of CO 9.9% 11.4%<br />
CHF million<br />
140 +36<br />
120<br />
100<br />
80<br />
60<br />
40<br />
20<br />
0<br />
83<br />
2010<br />
Results 2011 March 2012<br />
119<br />
2011<br />
EPS in CHF 17.81 25.86<br />
RONA in % 17.4% 19.8%<br />
• Sale of LMW shares contributed 47.3 million CHF<br />
to net profit from continued operations<br />
• Financial result negatively impacted by<br />
extraordinary reclassification of currency<br />
differences on a loan to a subsidiary (-7.3 million<br />
CHF) <strong>and</strong> an impairment on assets held available<br />
<strong>for</strong> sale (-2.9 million CHF)<br />
• Return on net assets from continued operations of<br />
19.8% (13.1% be<strong>for</strong>e gain from sale of Lakshmi<br />
shares) exceeded cost of capital<br />
• Earnings per share from continued operations<br />
increased to 25.86 CHF (be<strong>for</strong>e gain from sale of<br />
Lakshmi shares of 15.63 CHF)<br />
• Board of Directors proposes a dividend of 6.0 CHF<br />
per share out of the reserve from capital<br />
contributions (dividend yield of 4.25%)<br />
19
Changes in work<strong>for</strong>ce<br />
Total work<strong>for</strong>ce reduced by 4% through reduction in temporaries<br />
Temporaries<br />
in %<br />
FTE 1)<br />
7.000<br />
6.000<br />
5.000<br />
4.000<br />
3.000<br />
2.000<br />
1.000<br />
0<br />
4.353<br />
267<br />
4.086<br />
2009<br />
Temporaries<br />
Results 2011 March 2012<br />
6.1% 28.2% 19.8%<br />
Fix<br />
6.125<br />
1.730<br />
4.395<br />
2010<br />
1) Excluding apprentices, including temporary employees<br />
-4%<br />
5.852<br />
1.157<br />
4.695<br />
2011<br />
• 22% sales growth <strong>and</strong> intensification of<br />
product development <strong>and</strong> process<br />
improvements led to inrease of fix<br />
employees by 7% mainly in<br />
Switzerl<strong>and</strong>, Czech Republic <strong>and</strong><br />
Germany followed by China<br />
• Shift of production to <strong>Rieter</strong> India <strong>and</strong><br />
subsequent divestment of Joint Venture<br />
with Lakshmi lead to overall decrease in<br />
India<br />
• Adjustments of temporary personnel<br />
due to dem<strong>and</strong> slow-down in second<br />
half year<br />
• Hiring freeze initiated in second half<br />
year <strong>for</strong> indirect personnel<br />
20
Balance sheet<br />
Increase of both net liquidity to 159.0 million CHF <strong>and</strong> equity ratio to 35%<br />
CHF million<br />
Results 2011 March 2012<br />
31.12.<br />
2011<br />
Total assets 1111.4<br />
Non-current assets 322.0<br />
Net working capital 53.3<br />
Liquid funds 415.6<br />
Net liquidity 159.0<br />
Short-term financial debt 3.1<br />
Long-term financial debt 253.5<br />
Shareholders’ equity 387.7<br />
in % of total assets 35%<br />
30.06.<br />
2011<br />
1135.5<br />
301.2<br />
65.6<br />
428.5<br />
149.8<br />
6.0<br />
272.7<br />
360.4<br />
32%<br />
31.12.<br />
2010<br />
1969.1<br />
802.2<br />
89.7<br />
359.0<br />
-3.5<br />
66.2<br />
296.3<br />
627.6<br />
32%<br />
• 2011 balance sheets after spin-off of<br />
automotive business (Autoneum), 2010<br />
figures are prior to spin-off<br />
• Net liquidity of 159.0 million CHF<br />
positively impacted by strong free cash<br />
flow of 79.5 million CHF<br />
• Shareholders‘ equity ratio at 35%<br />
• Bond of 250 million CHF (2010 – 2015,<br />
4.5%) secures financing of business<br />
development<br />
21
Net working capital<br />
Net working capital decrease in HY2 to 53.3 million CHF<br />
CHF million<br />
Results 2011 March 2012<br />
31.12.<br />
2011<br />
Inventories 234.8<br />
Trade receivables 84.1<br />
Other receivables 54.9<br />
Trade payables -86.4<br />
Advance payments -89.8<br />
Other current liabilities -144.3<br />
30.06.<br />
2011<br />
251.0<br />
90.4<br />
64.4<br />
-74.2<br />
-83.7<br />
-182.3<br />
31.12.<br />
2010<br />
328.4<br />
381.5<br />
98.0<br />
-315.8<br />
-110.9<br />
-291.5<br />
Net working capital 53.3 65.6 89.7<br />
• 2011 net working capital after spin-off of<br />
automotive business (Autoneum), 2010<br />
figures are prior to spin-off<br />
• Decrease in corporate output led to<br />
lower inventories compared to first half<br />
year 2011<br />
• Advance payments from customers<br />
continue to partially finance inventories<br />
22
Capital expenditures<br />
Capital expenditures mainly driven by expansion in China <strong>and</strong> India<br />
CHF million<br />
70<br />
60<br />
50<br />
40<br />
30<br />
20<br />
10<br />
0<br />
4<br />
6<br />
Results 2011 March 2012<br />
2<br />
2009<br />
Premium Textile Components<br />
Spun Yarn Systems<br />
26<br />
5<br />
21<br />
2010<br />
+122%<br />
57<br />
10<br />
47<br />
2011<br />
• Capital expenditure into expansion in<br />
China <strong>and</strong> India amount to 27.0 million<br />
CHF (2010: 12.3 million CHF)<br />
• Maintenance capital expenditure at<br />
2.9% of corporate output<br />
23
Free cash flow (continuing operations)<br />
Strong free cash flow of 79.5 million CHF generated<br />
CHF million 2011 2010<br />
Net profit<br />
Results 2011 March 2012<br />
119.0 82.9<br />
Interest <strong>and</strong> tax expense (net) 29.2 -3.2<br />
Depreciation <strong>and</strong> amortization<br />
39.9<br />
+/- Reversal of disposal gains -53.5 -5.5<br />
+/- Change in net working capital -17.5 -33.5<br />
+/- Interest paid / received (net)<br />
33.9<br />
-7.3<br />
24.6<br />
+/- Taxes paid -23.4 -6.0<br />
+/- Capital expenditure, net -53.6 -25.8<br />
+/- Change in other financial assets 0.5 6.1<br />
+/- Sale LMW shares / divestments 52.2 -0.8<br />
Free cash flow<br />
79.5<br />
78.7<br />
• Strong free cash flow of 79.5 million<br />
CHF (2010: 78.7 million CHF)<br />
• Sale of LMW shares <strong>and</strong> divestment of<br />
<strong>Rieter</strong> Lakshmi Machine Works share<br />
contributed further 52.2 million CHF to<br />
free cash flow<br />
• Free cash flow be<strong>for</strong>e divestments at<br />
27.3 million CHF despite higher capital<br />
expenditures<br />
24
Net liquidity<br />
Net liquidity positively impacted by strong free cash flow<br />
CHF million<br />
-4<br />
Net liquidity<br />
31.12.2010<br />
Results 2011 March 2012<br />
94<br />
Impact of<br />
spin-off (debt<br />
repayment et<br />
al.)<br />
91<br />
Net liquidity<br />
post<br />
separation<br />
27<br />
Free cash<br />
flow be<strong>for</strong>e<br />
divestments<br />
52<br />
Free cash flow:<br />
79.5 million CHF<br />
Sale LMW<br />
shares/<br />
divestments<br />
-11<br />
Other<br />
159<br />
Net liquidity<br />
31.12.2011<br />
25
Spun Yarn Systems 2011<br />
Leading systems supplier in the spinning process<br />
Results 2011 March 2012<br />
Br<strong>and</strong>:<br />
CHF million 2011 2010<br />
Order Intake 775.0 1217.9<br />
Sales 861.7 674.0<br />
Corporate Output 866.3 669.4<br />
EBIT 81.2 42.4<br />
• Customers / regions: Spinning mills in Turkey,<br />
India, China, South East Asia, North <strong>and</strong> Latin<br />
America, Africa<br />
• Market size: ~2‘800 million CHF (2010)<br />
• Product offering: Short staple spinning systems<br />
<strong>and</strong> machinery <strong>for</strong> natural <strong>and</strong> man-made fibers:<br />
Blowroom, Card, Drawframe, Comber, Flyer, Ring<br />
spin, Rotor spin, Compact spin, Airjet spin<br />
• Global sales <strong>and</strong> service presence in all yarn<br />
producing countries through own sales <strong>for</strong>ce or<br />
agents with production facilities in Switzerl<strong>and</strong>,<br />
Germany, Czech Republic, China <strong>and</strong> India<br />
• Main competitors: OC Oerlikon, LMW, Jingwei,<br />
Trützschler, Murata<br />
• Growth drivers: Population <strong>and</strong> GDP growth<br />
drives dem<strong>and</strong> in fibers <strong>and</strong> yarn; Trend to<br />
increasing yarn quality, fineness <strong>and</strong> automation;<br />
Replacement of existing installed capacity<br />
26
Spun Yarn Systems: Sales<br />
Striking increase of sales by 28%<br />
CHF million<br />
900 862<br />
800<br />
700<br />
600<br />
500<br />
400<br />
300<br />
200<br />
100<br />
0<br />
394<br />
2009<br />
Results 2011 March 2012<br />
674<br />
2010<br />
+28%<br />
2011<br />
• Sales in 2011 have been profiting from<br />
high order intake till end of first quarter<br />
2011<br />
• Regionally well diversified sales across<br />
45 countries<br />
• Product success with C 70 card <strong>and</strong><br />
products <strong>for</strong> the local markets in India<br />
<strong>and</strong> China (G 32 ring spin,<br />
R 923 semi-automatic rotor spin <strong>and</strong><br />
RSB D 22 drawframe) allowed<br />
strengthening of market position<br />
• Capacity constraints led to high delivery<br />
times, which were reduced till end of<br />
year<br />
27
Spun Yarn Systems: Operating result (EBIT)<br />
EBIT increased by 39 million CHF to good 9.4% of corporate output<br />
In % of CO -12.2% 6.3% 9.4%<br />
CHF million<br />
100<br />
50<br />
0<br />
-50<br />
-43<br />
2009<br />
Results 2011 March 2012<br />
42<br />
+39<br />
81<br />
2010 2011<br />
• Profitability increase mainly volumedriven<br />
thanks to high utilization of<br />
capacities <strong>and</strong> continuous improvement<br />
of manufacturing cost<br />
• Profitability in second half year<br />
negatively impacted by<br />
• Pressure on Swiss franc<br />
denominated prices<br />
• Increased investments in expansion<br />
in Asia (China <strong>and</strong> India), product<br />
development <strong>and</strong> process<br />
improvements<br />
28
Premium Textile Components 2011<br />
Leading supplier of premium textile components<br />
Results 2011 March 2012<br />
Br<strong>and</strong>s:<br />
CHF million 2011 2010<br />
Order Intake 183.3 235.2<br />
Sales 199.1 190.6<br />
Corporate Output 272.6 237.2<br />
EBIT 35.1 29.6<br />
• Customers / regions: Spinning mills <strong>and</strong> OEMS<br />
(<strong>Rieter</strong> <strong>and</strong> third) in India, China, Turkey, Europe,<br />
South East Asia, North <strong>and</strong> Latin America, Africa<br />
• Market size: ~1‘100 million CHF (2010)<br />
• Product offering: Durable <strong>and</strong> wear & tear<br />
components <strong>for</strong> short staple spinning machinery<br />
• Global sales <strong>and</strong> service presence in all yarn<br />
<strong>and</strong> machinery producing countries mainly<br />
through agents with production facilities in<br />
Switzerl<strong>and</strong>, EU, China, India<br />
• Main competitors: Oerlikon OTC, Trützschler,<br />
Lakshmi <strong>and</strong> various small competitors<br />
• Growth drivers: Population <strong>and</strong> GDP growth<br />
drives dem<strong>and</strong> in fibers <strong>and</strong> yarn; Trend to<br />
increasing yarn quality <strong>and</strong> fineness <strong>and</strong><br />
automation; Higher speeds<br />
29
Premium Textile Components: Sales<br />
Sales <strong>and</strong> corporate output increased by 4% <strong>and</strong> 15%, respectively<br />
CHF million<br />
250<br />
200<br />
150<br />
100<br />
50<br />
0<br />
128<br />
2009<br />
Results 2011 March 2012<br />
191<br />
2010<br />
+4%<br />
199<br />
2011<br />
• Sales of 199.1 million CHF in 2011<br />
have been profiting from high order<br />
intake till end of first quarter 2011 <strong>and</strong><br />
were at strong 112.7 million CHF in the<br />
first half year, but dropped due to the<br />
market slow-down to 86.4 million CHF<br />
in the second half of the year<br />
• Capacity constraints at mid-year<br />
volumes eased due to dem<strong>and</strong> slowdown<br />
• Corporate output increased by 15% to<br />
272.6 (2010: 237.2) million CHF,<br />
reflecting the importance of Premium<br />
Textile Components also as an internal<br />
supplier of key components to Spun<br />
Yarn Systems<br />
• Sales increased by 4% (in local<br />
currencies +11%), corporate output by<br />
15% against 2010<br />
30
Premium Textile Components: Operating result (EBIT)<br />
EBIT increased by 5 million CHF to good 12.9% of corporate output<br />
In % of CO -16.0% 12.5% 12.9%<br />
CHF million<br />
40<br />
30<br />
20<br />
10<br />
0<br />
-10<br />
-20<br />
-30<br />
-20<br />
2009<br />
Results 2011 March 2012<br />
30<br />
2010<br />
+19%<br />
35<br />
2011<br />
• Profitability increase mainly due to<br />
• Volume increase leading to high<br />
utilization of capacities in the first<br />
half year<br />
• Consequent adaptation to lower<br />
volumes in the second half year<br />
• Profitability in second half year<br />
negatively impacted by<br />
• Sales decrease in second half year<br />
2011<br />
• Pressure on Swiss franc<br />
denominated prices<br />
• Increased investments in product<br />
development, expansion in Asia<br />
(China <strong>and</strong> India) <strong>and</strong> process<br />
improvements<br />
31
Agenda<br />
. . . . .<br />
. . . . .<br />
. . . . .<br />
. . . . .<br />
. . . . .<br />
. . . . .<br />
. . . . .<br />
. . . . .<br />
. . . . .<br />
Results 2011 March 2012<br />
1. Introduction <strong>and</strong> summary of 2011 Erwin Stoller<br />
2. Financial results 2011 Joris Gröflin<br />
3. Strategic focus Erwin Stoller<br />
4. Outlook Joris Gröflin<br />
32
<strong>Rieter</strong> – Strategic intent<br />
Results 2011 March 2012<br />
Strategic intent<br />
Organic growth / growth by acquisitions<br />
• Stay No. 1 in the high segment, become at least No. 2 in the mid segment<br />
• Strengthen position in China <strong>and</strong> India<br />
• Close product gaps through innovation <strong>and</strong> external opportunities<br />
Innovation<br />
• Improve yarn quality<br />
• Increase fiber yield / productivity<br />
• Achieve cost <strong>and</strong> energy savings (<strong>for</strong> spinning mills)<br />
Cycle management<br />
• Maintain break-even focus<br />
• Generate free cash flow throughout the cycle<br />
• Keep key know-how<br />
33
Guidance over the cycle<br />
Sales<br />
EBIT margin<br />
Net result<br />
RONA<br />
Capex<br />
Dividend policy<br />
Results 2011 March 2012<br />
Over the cycle<br />
Sales growth of > 5%<br />
> 9% over the cycle,<br />
peak years > 12%<br />
> 6 % over the cycle,<br />
peak years > 8%<br />
peak years > 14%<br />
4 – 5 % of corporate output<br />
Target pay-out ratio of<br />
approx. 30% of net result<br />
34
<strong>Rieter</strong> – Strategy implementation organic growth (1/4)<br />
Expansion in Asia<br />
Results 2011 March 2012<br />
• Capacity expansion of production sites in<br />
• Changzhou (China)<br />
• Pune (India)<br />
35
<strong>Rieter</strong> – Strategy implementation organic growth (2/4)<br />
Innovation<br />
Results 2011 March 2012<br />
• Driving innovation <strong>and</strong> product pipeline<br />
• Continuation of localization of product<br />
portfolio<br />
36
<strong>Rieter</strong> – Strategy implementation organic growth (3/4)<br />
Process improvements<br />
Results 2011 March 2012<br />
• Increased focus on operational<br />
excellence in all locations<br />
• Process improvements in IT – supported<br />
global supply chain <strong>and</strong> administration<br />
37
<strong>Rieter</strong> – Strategy implementation organic growth (4/4)<br />
Continued intensity of strategy implementation in 2012 / 2013<br />
Results 2011 March 2012<br />
• Expansion in Asia: Capacity expansion of<br />
production sites in Changzhou (China) <strong>and</strong><br />
Pune (India)<br />
• Innovation: Driving innovation, product<br />
pipeline <strong>and</strong> continuation of localization of<br />
product portfolio<br />
• Process improvements: Increased focus on<br />
operational excellence in all locations <strong>and</strong><br />
process improvements in IT – supported<br />
global supply chain <strong>and</strong> administration<br />
Financing <strong>for</strong> investments in 2012 / 2013 is in place<br />
Additional<br />
Investments <strong>for</strong><br />
2012/2013:<br />
~ 90 million CHF<br />
Additional<br />
Investments <strong>for</strong><br />
2012/2013:<br />
~ 50 million CHF<br />
38
<strong>Rieter</strong> – Strategy implementation external growth<br />
Clear criterias <strong>for</strong> target selection<br />
Results 2011 March 2012<br />
• Selected acquisitions in the<br />
components business<br />
• Closing product gaps in the<br />
machinery business<br />
Criteria:<br />
• Strong br<strong>and</strong> in the<br />
respective segment<br />
• Improving market access or<br />
enhancing product portfolio<br />
• Allowing profitable growth<br />
AGM agenda item <strong>for</strong> authorized capital to increase financial flexibility<br />
39
Agenda<br />
. . . . .<br />
. . . . .<br />
. . . . .<br />
. . . . .<br />
. . . . .<br />
. . . . .<br />
. . . . .<br />
. . . . .<br />
. . . . .<br />
Results 2011 March 2012<br />
1. Introduction <strong>and</strong> summary of 2011 Erwin Stoller<br />
2. Financial results 2011 Joris Gröflin<br />
3. Strategic focus Erwin Stoller<br />
4. Outlook Joris Gröflin<br />
40
2012 Outlook<br />
. . . . . . . . . . . . . . . . . . . . . . . . .<br />
. . . . . . . . . . . . . . . . . . . . . . . . .<br />
. . . . . . . . . . . . . . . . . . . . . . . . .<br />
Joris Gröflin, Chief Financial Officer
Outlook 2012<br />
• <strong>Rieter</strong> will continue intensified investment activity through the 2012 financial year to lay the<br />
foundations <strong>for</strong> further profitable growth. To accelerate expansion in Asia <strong>and</strong> product<br />
innovation, <strong>Rieter</strong> plans investment activities totaling around 90 million CHF in 2012 <strong>and</strong><br />
2013, about half of which due in 2012. Investments totaling around 50 million CHF are<br />
planned in 2012/2013 <strong>for</strong> further improving global processes, just over half of which in the<br />
financial year 2012.<br />
• <strong>Rieter</strong> business activities are broadly based worldwide. Heterogeneous market<br />
development is expected <strong>for</strong> 2012. Due among other reasons to uncertain economic<br />
policies in major national markets, it is difficult to <strong>for</strong>ecast textile machinery industry<br />
developments <strong>for</strong> the current year. Further trends depend on various factors including<br />
currency exchange rate developments, consumer sentiment in Europe <strong>and</strong> North America,<br />
fiber consumption growth in Asia, <strong>and</strong> raw material prices.<br />
• Against this background <strong>Rieter</strong> currently reckons <strong>for</strong> this financial year with a sales decline<br />
in the high single-digit percentage range compared with prior year <strong>and</strong> a weaker trend in the<br />
first semester. The planned investment activity in growth projects will impact operating<br />
margin (EBIT) <strong>for</strong> 2012 <strong>and</strong> 2013 by about 1 percentage point, while investment activities in<br />
process improvement projects will reduce operating margin in these two years by another<br />
two percentage points. Disregarding these projects, <strong>Rieter</strong> expects volume-dependent<br />
profitability around the prior year level.<br />
Results 2011 March 2012<br />
42
. . . . .<br />
. . . . .<br />
. . . . .<br />
. . . . .<br />
. . . . .<br />
. . . . .<br />
. . . . .<br />
. . . . .<br />
. . . . .<br />
Results 2011 March 2012<br />
Appendix<br />
43
Key investment highlights of <strong>Rieter</strong><br />
Results 2011 March 2012<br />
Experienced<br />
Management team<br />
<strong>and</strong> Board of<br />
Directors<br />
Efficient cycle<br />
management <strong>and</strong><br />
value creation<br />
Long-term growth<br />
industry<br />
<strong>Rieter</strong><br />
Technology <strong>and</strong><br />
innovation<br />
leadership<br />
Broadest global<br />
systems supplier<br />
Leading market<br />
positions<br />
44
Long-term growth industry<br />
Textile Business will keep on growing – short staple as largest segment<br />
2<br />
1900 1950 2002 2016<br />
World population (billion)<br />
Short staple (cotton, viscose, synthetic)<br />
Per-capita consumption (kg/p)<br />
Non-wovens<br />
World fiber consumption (million t)<br />
Non-spun<br />
Filaments<br />
Long staple<br />
Source: PCI<br />
2<br />
3<br />
Results 2011 March 2012<br />
World population <strong>and</strong> fiber consumption growth<br />
3<br />
3<br />
9<br />
6<br />
9<br />
57<br />
7<br />
13<br />
92<br />
45
Textile sector growth<br />
Growth in GDP per capita – especially in China <strong>and</strong> India – is driving dem<strong>and</strong><br />
Fiber end-use consumption<br />
in kg per capita p.a.<br />
100<br />
40<br />
NA NA<br />
NA<br />
20<br />
China<br />
China WEU WEU<br />
WEU<br />
China<br />
10<br />
LA LA<br />
5<br />
LA<br />
India<br />
3 India<br />
India<br />
1<br />
Size = Population<br />
2000<br />
2008<br />
2016<br />
1'000 2'500 5'000 10'000 25'000 50'000 100'000<br />
Legend: NA = North America, LA = Latin America, WEU = Western Europe, China includes Hong Kong<br />
Results 2011 March 2012<br />
GDP <strong>and</strong> fiber consumption growth<br />
GDP per capita in USD (on purchasing power parity basis)<br />
46
Fibre consumption by type <strong>and</strong> growth<br />
<strong>Rieter</strong> covers both man-made <strong>and</strong> natural fibers in short staple segment<br />
Synthetic<br />
Cotton etc.<br />
Synthetic<br />
Wool, Jute etc.<br />
Cotton<br />
Viscose<br />
Synthetic<br />
Note: Estimates based on 2008 volumes<br />
Results 2011 March 2012<br />
Non-Wovens /<br />
Non-spun<br />
Filament<br />
Yarns<br />
Long Staple<br />
Yarns<br />
Short Staple<br />
Yarns<br />
100%<br />
15%<br />
33%<br />
7%<br />
45%<br />
100%<br />
8%<br />
17%<br />
75%<br />
Non-Wovens<br />
Technical<br />
Textiles<br />
Knitted /<br />
Woven<br />
47
Fiber processes in short-staple spinning<br />
Fiber (-mix) used in short staple spinning depends on final application<br />
Cotton<br />
(65-75%)<br />
Viscose<br />
fibers<br />
(5-10%)<br />
Synthetic<br />
fibers<br />
(25-30%)<br />
Results 2011 March 2012<br />
Spinning<br />
• Preparation<br />
• Ring<br />
• Compact<br />
• Rotor<br />
• Airjet<br />
• Weaving /<br />
Knitting<br />
• Finishing<br />
• Confectioning<br />
48
Leading market positions<br />
Ring<br />
Conventional<br />
Results 2011 March 2012<br />
Spun Yarn Systems<br />
(SYS)<br />
• Leading position in high segment <strong>for</strong> all fields of<br />
activity<br />
• Recognised as an innovation leader with<br />
superior products<br />
Ring<br />
Compact<br />
Transport Automation<br />
Preparation Preparation<br />
Rotor Air-Jet<br />
Monitoring<br />
Premium Textile Components<br />
(PTC)<br />
• Supply to 3 rd party OEMs underlines position in<br />
textile components<br />
• By far largest supplier of textile components <strong>for</strong><br />
spinning machines<br />
Ring<br />
Conventional<br />
Ring<br />
Compact<br />
Rotor Air-Jet<br />
49
Technology <strong>and</strong> innovation leadership<br />
Past break-through examples prove technology <strong>and</strong> innovation leadership<br />
Machines<br />
–SYS<br />
1795 2001 Foundation of PTC<br />
2011<br />
Components<br />
–PTC<br />
Results 2011 March 2012<br />
Com4 –<br />
compact<br />
spinning<br />
machine<br />
1997<br />
Titan ring<br />
1997<br />
Semiautomaticrotorspinner<br />
1998<br />
EliTe compacting<br />
unit <strong>for</strong><br />
ring<br />
spinning<br />
2002<br />
Widest,<br />
self<br />
sharpening<br />
card<br />
2001<br />
Novibra<br />
energy<br />
saving<br />
spindle<br />
2003<br />
Omega Lap<br />
(combing<br />
prep.)<br />
2003/2004<br />
Camel-wire<br />
<strong>for</strong> best<br />
carding<br />
results<br />
2009<br />
Doublehead<br />
autolevel.<br />
drawframe<br />
2009<br />
Primacomb<br />
9015<br />
2009<br />
New<br />
Air-Jet<br />
machine<br />
2010<br />
S-60<br />
Rotorbox<br />
2011<br />
50
Technology <strong>and</strong> innovation leadership: ITMA 2011<br />
Innovations across all spinning processes in both Business Groups<br />
Machines<br />
–SYS<br />
Components<br />
–PTC<br />
Results 2011 March 2012<br />
•New<br />
Vario Line<br />
Blowroom<br />
•New<br />
Metallic<br />
Card<br />
Clothing <strong>for</strong><br />
-staple<br />
yarns<br />
- nonwoven<br />
•New<br />
C70 High<br />
Per<strong>for</strong>mance<br />
Card<br />
Preparation<br />
•New<br />
RSB-D45<br />
Autoleveler<br />
Draw<br />
Frame<br />
Blowroom Card Drawframe Comber<br />
•New<br />
Spinning<br />
Rings <strong>and</strong><br />
Travellers<br />
•New<br />
Primacomb<br />
9030<br />
•New<br />
F14 Comb-<br />
Pro/Fixpro<br />
series<br />
Roving<br />
•New<br />
Version 6.0<br />
Spiderweb<br />
Mill<br />
Monitoring<br />
System<br />
Ring/<br />
Com<strong>for</strong>t<br />
•NewElite<br />
Compact<br />
EliVAC<br />
•NewRing<br />
Monitoring<br />
System<br />
•New<br />
R 60 Rotor<br />
Spinning<br />
Machine<br />
Winding<br />
•Newyarn<br />
clamping<br />
device<br />
“Crocodoff”<br />
•New<br />
J 20 Airjet<br />
Spinning<br />
Machine<br />
Rotor Air-Jet<br />
•NewRotor<br />
Spin Box<br />
51
Values <strong>and</strong> principles<br />
Results 2011 March 2012<br />
Delight<br />
your<br />
customers<br />
Com<strong>for</strong>t<br />
thanks to <strong>Rieter</strong><br />
Enjoy your<br />
work<br />
Fight <strong>for</strong><br />
profits<br />
<strong>Rieter</strong> is a publicly listed Swiss industrial group providing innovative<br />
solutions to the global textile industry.<br />
52
Disclaimer<br />
<strong>Rieter</strong> is making great ef<strong>for</strong>ts to include accurate <strong>and</strong> up-to-date in<strong>for</strong>mation in this document,<br />
however we make no representations or warranties, expressed or implied, as to the accuracy or<br />
completeness of the in<strong>for</strong>mation provided in this document <strong>and</strong> we disclaim any liability<br />
whatsoever <strong>for</strong> the use of it.<br />
The in<strong>for</strong>mation provided in this document is not intended nor may be construed as an offer or<br />
solicitation <strong>for</strong> the purchase or disposal, trading or any transaction in any <strong>Rieter</strong> securities.<br />
Investors must not rely on this in<strong>for</strong>mation <strong>for</strong> investment decisions.<br />
All statements in this report which do not reflect historical facts are statements related to the<br />
future which offer no guarantee with regard to future per<strong>for</strong>mance; they are subject to risks <strong>and</strong><br />
uncertainties including, but not limited to, future global economic conditions, exchange rates,<br />
legal provisions, market conditions, activities by competitors <strong>and</strong> other factors outside the<br />
company's control.<br />
Results 2011 March 2012<br />
53
Key Data per Share<br />
<strong>Rieter</strong> registered shares of 5 CHF nominal value<br />
Bloomberg: RIEN; Reuters: RITZn<br />
Shares outst<strong>and</strong>ing excl. own shares<br />
(end of period)<br />
Average shares (of period)<br />
Share price (end of period) CHF<br />
Market capitalization<br />
(end of period) million CHF<br />
Results 2011 March 2012<br />
31.12.2011 30.06.2011 31.12.2010<br />
4‘629‘335<br />
4‘625‘281<br />
141.10<br />
653<br />
* Source: Bloomberg – adjusted <strong>for</strong> distribution of special dividend (separation of Autoneum – AUTN)<br />
4‘629‘445<br />
4‘621‘782<br />
219.50<br />
1‘016<br />
4‘618‘869<br />
4‘640‘220<br />
242.95*<br />
1‘122*<br />
54
Agenda 2012<br />
Full year 2011 results analyst presentation / conference call:<br />
March 21, 2 p.m. CET<br />
Annual General Assembly:<br />
April 18, 2012<br />
HY1 2012 results publication:<br />
July 25, 2012<br />
Contact:<br />
Media: Investor relations:<br />
Erwin Stoller Joris Gröflin<br />
Executive Chairman Chief Financial Officer<br />
T: +41 52 208 70 15 T: +41 52 208 70 15<br />
media@rieter.com investor@rieter.com<br />
Results 2011 March 2012<br />
55


