Create successful ePaper yourself
Turn your PDF publications into a flip-book with our unique Google optimized e-Paper software.
<strong>Semi</strong>-<strong>Annual</strong> <strong>Report</strong> <strong>2012</strong>
2 <strong>Rieter</strong> . <strong>Semi</strong>-<strong>Annual</strong> <strong>Report</strong> <strong>2012</strong> . <strong>Rieter</strong> at a glance<br />
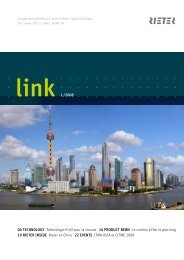
<strong>Rieter</strong> at a glance<br />
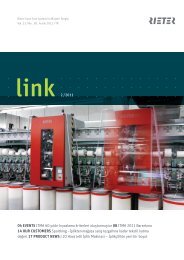
Orders received<br />
in CHF million<br />
800<br />
600<br />
400<br />
200<br />
CHF million<br />
<strong>Rieter</strong><br />
0<br />
HY1 11<br />
HY2 11<br />
HY1 12<br />
Sales<br />
in CHF million<br />
800<br />
600<br />
400<br />
200<br />
0<br />
Corporate output<br />
in CHF million<br />
January –<br />
June<br />
<strong>2012</strong><br />
July –<br />
December<br />
2011<br />
January –<br />
June<br />
2011<br />
Change 1<br />
Change<br />
in local<br />
currencies 1<br />
Orders received 404.1 287.0 671.3 – 40% – 40%<br />
Sales 487.3 523.0 537.8 – 9% – 9%<br />
Corporate output 441.4 490.6 551.9 – 20%<br />
Operating profit before strategic projects, interest and taxes 44.5 56.8 77.7<br />
• in % of corporate output 10.1% 11.6% 14.1%<br />
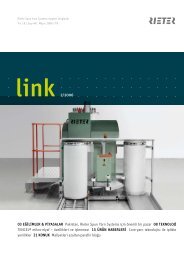
Operating profit before interest and taxes (EBIT) 32.0 42.0 70.6<br />
• in % of corporate output 7.2% 8.6% 12.8%<br />
Net profit 2 21.9 28.0 91.0<br />
• in % of corporate output 5.0% 5.7% 16.5%<br />
Earnings per share 2 CHF 5.17 6.22 19.64<br />
Capital expenditures on tangible and intangible assets 24.3 42.9 14.4 69%<br />
Number of employees at the end of the period (excluding<br />
temporary personnel)<br />
Business Group Spun Yarn Systems<br />
4 679 4 695 4 725 – 1%<br />
Orders received 330.0 222.3 552.7 – 40% – 41%<br />
Sales 400.6 436.6 425.1 – 6% – 6%<br />
Corporate output 365.4 416.9 449.4 – 19%<br />
Operating profit before interest and taxes (EBIT) 27.9 31.6 49.6<br />
• in % of corporate output<br />
Business Group Premium Textile Components<br />
7.6% 7.6% 11.0%<br />
Orders received 74.1 64.7 118.6 – 38% – 35%<br />
Sales 86.7 86.4 112.7 – 23% – 21%<br />
Corporate output 118.2 122.4 150.2 – 21%<br />
Operating profit before interest and taxes (EBIT) 9.3 13.2 21.9<br />
• in % of corporate output 7.9% 10.8% 14.6%<br />
1. Change January – June <strong>2012</strong> vs. January – June 2011.<br />
2. Continuing operations, incl. gain on sale of investments, which amounted to 42.3 million CHF in the first half year of 2011.<br />
HY1 11<br />
HY2 11<br />
HY1 12<br />
800<br />
600<br />
400<br />
200<br />
0<br />
HY1 11<br />
HY2 11<br />
HY1 12<br />
EBIT<br />
in CHF million<br />
80<br />
60<br />
40<br />
20<br />
0<br />
HY1 11<br />
HY2 11<br />
HY1 12
<strong>Rieter</strong>: good progress with strategic projects in a steady half year<br />
Higher order intake than in the second half of 2011 — lower<br />
sales, as expected — profitability reduced by lower volumes<br />
and the investment program — investment program<br />
<strong>2012</strong>/2013 on track<br />
Order intake amounted to 404.1 million CHF; this was 40%<br />
lower than the very strong figure for the first half of 2011.<br />
However, in the first half of <strong>2012</strong> <strong>Rieter</strong> received more orders<br />
than in the second half of 2011. Sales of 487.3 million CHF<br />
in the reporting period were 9% lower than in the same period<br />
of the previous year, as expected. The operating profit<br />
before interest and taxes declined from 70.6 million CHF to<br />
32.0 million CHF due to reduced volumes and higher investment<br />
activity. This figure corresponds to 7.2% of corporate<br />
output (12.8% in the first half of 2011). Net profit<br />
was 21.9 million CHF, equivalent to 5.0% of corporate output<br />
(91.0 million CHF or 16.5% in the first half of 2011,<br />
when a nonrecurring capital gain accounted for 42.3 million<br />
CHF of the total). In the period under review <strong>Rieter</strong><br />
completed major steps in the investment program <strong>2012</strong>/2013<br />
announced in the spring. The company has achieved the<br />
interim targets it aimed for and is on track with this program.<br />
Dear shareholder<br />
The first half of <strong>2012</strong> was characterized by widely diverging<br />
trends in the geographical markets of relevance for <strong>Rieter</strong>.<br />
Global economic uncertainties affected the markets for shortstaple<br />
fiber machinery and components in China and Turkey;<br />
in India, demand remained weak also due to industry-specific<br />
reasons. Yarn inventories, which were still very large last summer,<br />
continued to decline. The overall margin situation at spinning<br />
mills improved, although regional differences persist.<br />
Compared with the extraordinarily strong period in the previous<br />
year, orders received by <strong>Rieter</strong> declined in the first six<br />
months of <strong>2012</strong> by 40% to 404.1 million CHF. Both of <strong>Rieter</strong>’s<br />
business groups – Spun Yarn Systems (machinery, spare parts<br />
and service business) and Premium Textile Components (com-<br />
<strong>Rieter</strong> . <strong>Semi</strong>-<strong>Annual</strong> <strong>Report</strong> <strong>2012</strong> . Letter to the shareholders<br />
ponents business) – were affected by this downturn. However,<br />
order intake was higher than in the second half of 2011 and was<br />
broad-based in geographical terms. <strong>Rieter</strong> booked the most<br />
orders in China, Turkey and other Asian countries including Indonesia<br />
and Pakistan. Customers in the Near & Middle East<br />
and Africa placed further substantial orders for staple-fiber<br />
machinery and technology components. In contrast, order<br />
intake in the important Indian market remained at a very low<br />
level. Orders in hand, some of which will be reflected in sales<br />
in 2013, totaled more than 515 million CHF at the end of the<br />
first six months (over 840 million CHF at the end of the first<br />
half of 2011).<br />
The positive attributes of the product portfolios of both business<br />
groups enabled <strong>Rieter</strong> to further expand its strong market<br />
position worldwide, especially in China. Machinery and components<br />
from <strong>Rieter</strong> create competitive advantages for customers<br />
in the success factors of yarn quality, productivity, material<br />
utilization and energy efficiency.<br />
<strong>Rieter</strong>’s sales of 487.3 million CHF were 9% lower than a year<br />
earlier. <strong>Rieter</strong> booked the most sales in Turkey, followed by<br />
China and other Asian countries. Sales in China were 17% higher<br />
than in the previous year, but sales in India declined by<br />
more than half. Corporate output was 20% lower due to the decline<br />
in the order volume, and amounted to 441.1 million CHF.<br />
Compared with the first half of 2011, the operating profit before<br />
interest and taxes (EBIT) declined from 70.6 million CHF<br />
to 32.0 million CHF, equivalent to 7.2% of corporate output<br />
(12.8% in the first half of 2011). The operating profit before interest<br />
and taxes includes expenditures incurred in the reporting<br />
period for the steps completed in the investment program<br />
<strong>2012</strong>/2013. The expenditures amounted to 12.5 million CHF<br />
and reduced the EBIT margin by almost 3 percentage points.<br />
The operating profit before strategic projects, interest and<br />
taxes amounted to 44.5 million CHF or 10.1% of corporate output.<br />
Expenditure on research and development amounted to<br />
20.9 million CHF in the first half of <strong>2012</strong> (19.3 million CHF in the<br />
first half of 2011). Lower profitability is also attributable to<br />
lower volumes, the weakness of the Indian market and increased<br />
pressure on prices for business invoiced in Swiss francs. Major<br />
efforts to cut costs and enhance productivity at all locations<br />
partly compensated for this.<br />
3
4<br />
<strong>Rieter</strong> . <strong>Semi</strong>-<strong>Annual</strong> <strong>Report</strong> <strong>2012</strong> . Letter to the shareholders<br />
Net profit declined compared with the previous year’s outcome,<br />
amounting to 21.9 million CHF or 5.0% of corporate output<br />
(91.0 million CHF and 16.5% in the first half of 2011). This reduction<br />
was mainly due to the absence of the extraordinary<br />
capital gain of 42.3 million CHF arising from the sale of shares<br />
in Lakshmi Machine Works in India in the first half of 2011<br />
and the lower operating profit.<br />
<strong>Rieter</strong> employed a global workforce of 4 679 on June 30, <strong>2012</strong><br />
(4 725 on June 30, 2011). In response to the decline in orders<br />
<strong>Rieter</strong> reduced the number of temporary employees to 800<br />
(1 893 a year earlier).<br />
The seasonal increase in net working capital and the outflow of<br />
funds due to the investment program <strong>2012</strong>/2013, resulted<br />
in lower free cash flow (–15.5 million CHF) than in the strong<br />
equivalent period of the previous year. The payment of a dividend<br />
of 27.7 million CHF out of the reserves from capital contributions<br />
reduced net liquidity at mid-year to 107.4 million<br />
CHF. <strong>Rieter</strong> continues to have sound finances and an equity ratio<br />
of 35% after the dividend payment.<br />
Spun Yarn Systems Business Group<br />
Through its Spun Yarn Systems Business Group, <strong>Rieter</strong> is the<br />
world’s only supplier offering machinery and systems covering<br />
spinning preparation processes and all four final spinning<br />
processes established on the market.<br />
Orders received by Spun Yarn Systems totaled 330.0 million<br />
CHF in the reporting period. This figure was 40% lower than in<br />
the first half of 2011, but considerably higher than in the second<br />
half of 2011. Sales of 400.6 million CHF were 6% lower than<br />
in the comparative period of the previous year. The operating<br />
profit amounted to 27.9 million CHF or 7.6% of corporate output<br />
(49.6 million CHF or 11.0% in the first half of 2011). This<br />
includes the disposal gain of 6 million CHF arising from the sale<br />
of manufacturing capacity in the Czech Republic, which was<br />
announced last year and completed in the reporting period.<br />
Spun Yarn Systems presented mill-proven and new products<br />
at two major textile machinery trade shows in Turkey and China<br />
in the reporting period. <strong>Rieter</strong> machinery and systems met<br />
with an especially positive response from customers at the<br />
ITM Istanbul in April. The exhibits met the needs of the market<br />
especially well in the areas of productivity enhancement and<br />
the reduction of energy consumption. At the ITMA Asia, held<br />
in Shanghai in June, <strong>Rieter</strong> launched the E 80 comber as a new<br />
model in a very successful product family.<br />
Premium Textile Components Business Group<br />
Through its Premium Textile Components Business Group,<br />
<strong>Rieter</strong> is one of the world’s largest suppliers of components for<br />
short-staple spinning mills. Premium Textile Components<br />
supplies technology components both to spinning mills and<br />
also to various machinery manufacturers.<br />
In the first half of <strong>2012</strong>, the Premium Textile Components Business<br />
Group posted order intake of 74.1 million CHF. This was<br />
38% lower than in the first half of 2011, but the trend was positive<br />
compared to the second half of 2011. Business with spinning<br />
mill customers was more dynamic than that with machinery<br />
manufacturers in the reporting period. Sales by Premium<br />
Textile Components were 23% lower at 86.7 million CHF. The<br />
operating profit before interest and taxes was 9.3 million CHF<br />
or 7.9% of corporate output (21.9 million CHF or 14.6% in the<br />
first half of 2011).<br />
At the two major trade shows in China and Turkey, Premium<br />
Textile Components presented important new products by the<br />
Bräcker, Graf, Novibra and Suessen brands that attracted<br />
considerable interest from customers. These included, for example,<br />
innovations in the components offering that enable<br />
customers to achieve greater energy efficiency in their installations.<br />
Progress in the investment program <strong>2012</strong>/2013<br />
The investment program announced in the Spring of <strong>2012</strong> (see<br />
box, page 5) proceeded as planned in the reporting period.<br />
At the close of the first six months of <strong>2012</strong> <strong>Rieter</strong> has completed<br />
the following important steps:<br />
Expansion in Asia: <strong>Rieter</strong> inaugurated the first stage of a further<br />
manufacturing facility at its Chinese site in Changzhou.<br />
The new premises is already fully operational. Further completion<br />
of the main expansion stages is expected at the end of<br />
2013.
Innovation: Important interim targets have been achieved in<br />
the establishment of the airjet spinning process. For the first<br />
time a customer has installed a large integrated system featuring<br />
J 20 airjet spinning machines, i.e. both spinning preparation<br />
and the final spinning process. The J 20 airjet spinning<br />
machine also attracted considerable interest at the ITMA Asia<br />
in Shanghai.<br />
Process improvements: The project for global standardization<br />
of business processes is proceeding on schedule.<br />
The projects in the investment program are operationally and<br />
financially on track.<br />
Outlook<br />
<strong>Rieter</strong> will continue intensified investment activity through the<br />
<strong>2012</strong> financial year to lay the foundations for further profitable<br />
growth (see box on the right).<br />
<strong>Rieter</strong> business activities are broadly based worldwide. Heterogeneous<br />
market development is expected to continue in <strong>2012</strong>.<br />
Due among other reasons to uncertain economic policies in major<br />
national markets, it is difficult to forecast textile machin -<br />
ery industry developments for the current year. Further trends<br />
depend on various factors including currency exchange rate<br />
development, consumer sentiment in Europe and North America,<br />
fiber consumption growth in Asia, and raw material prices.<br />
<strong>Rieter</strong> currently reckons in the second semester with a weaker<br />
trend in sales compared to the first semester as part of the<br />
order backlog reaches into 2013. <strong>Rieter</strong> expects operating profitability<br />
(EBIT) in the second semester to follow volume development<br />
and the planned investment activity in growth projects<br />
and process improvements to further reduce operating<br />
margin (EBIT) by around three percentage points.<br />
Winterthur, July 25, <strong>2012</strong><br />
Erwin Stoller This E. Schneider<br />
Chairman Vice-Chairman<br />
of the Board of Directors of the Board of Directors<br />
<strong>Rieter</strong> . <strong>Semi</strong>-<strong>Annual</strong> <strong>Report</strong> <strong>2012</strong> . Letter to the shareholders 5<br />
Investment program <strong>2012</strong>/2013 for further growth<br />
<strong>Rieter</strong> expects that global demand for short staple fibers<br />
(natural fibers / staple man-made fibers) will grow by an average<br />
of 2.3% annually until 2030. The additional spinning<br />
capacity this will require, the replacement demand and the<br />
trend toward greater automation, especially in the Chinese<br />
and Indian markets, will have a positive impact on demand<br />
for spinning machinery and components.<br />
Against this background <strong>Rieter</strong> is aiming for overall annual<br />
average growth of 5%, half of which should be organic.<br />
<strong>Rieter</strong>’s strategic targets are to retain its leadership in the<br />
premium segment and also to expand its position in the<br />
local markets in China and India.<br />
In the implementation <strong>Rieter</strong> is focusing on<br />
Expansion in Asia: Further build-up of capacity in China<br />
and India;<br />
Innovation: Increased focus on air-jet spinning, improvement<br />
of yarn quality, productivity and energy efficiency of<br />
machinery and components;<br />
Process improvements: Operational excellence, global<br />
standardization and IT support of business processes.<br />
In order to achieve rapid expansion in Asia and drive product<br />
innovation, <strong>Rieter</strong> is planning investments totaling some<br />
90 million CHF in <strong>2012</strong> and 2013, somewhat more than half<br />
of which will be completed in <strong>2012</strong>. A total of some 50 million<br />
CHF is foreseen for the further improvement of global<br />
processes in <strong>2012</strong>/2013, slightly more than half of which is<br />
budgeted for the <strong>2012</strong> financial year. These investments will<br />
be made in addition to regular maintenance expenditures.<br />
Investments in the growth projects will reduce EBIT margin<br />
by about 1 percentage point in <strong>2012</strong> and 2013. Investments<br />
in process improvement projects will reduce EBIT margin<br />
by about a further 2 percentage points in these two years.<br />
Through this investment program, <strong>Rieter</strong> is seeking to achieve<br />
an EBIT margin of at least 9% over the demand cycle and<br />
greater than 12% in peak years.
6 <strong>Rieter</strong> . <strong>Semi</strong>-<strong>Annual</strong> <strong>Report</strong> <strong>2012</strong> . Consolidated income statement<br />
Consolidated income statement<br />
January – June <strong>2012</strong> January – June 2011 January – December 2011<br />
Notes CHF million % * CHF million % * CHF million % *<br />
Sales (4) 487.3 537.8 1 060.8<br />
Sales deductions – 26.1 – 32.0 – 60.1<br />
Net sales 461.2 505.8 1 000.7<br />
Change in semi-finished and finished goods – 21.4 45.5 36.4<br />
Own work capitalized 1.6 0.6 5.4<br />
Corporate output 441.4 100.0 551.9 100.0 1 042.5 100.0<br />
Material costs – 210.3 – 47.6 – 257.1 – 46.6 – 497.8 – 47.8<br />
Employee costs – 145.9 – 33.1 – 155.7 – 28.2 – 302.3 – 29.0<br />
Other operating expenses – 55.8 – 12.6 – 65.2 – 11.8 – 124.7 – 12.0<br />
Other operating income 18.7 4.2 13.9 2.5 28.8 2.8<br />
Depreciation and amortization – 16.1 – 3.7 – 17.2 – 3.1 – 33.9 – 3.2<br />
Operating profit before interest and taxes (EBIT) 32.0 7.2 70.6 12.8 112.6 10.8<br />
Gain on sale of investments (5) 4.4 45.3 50.3<br />
Financial result – 7.9 – 4.9 – 24.9<br />
Profit before taxes 28.5 6.5 111.0 20.1 138.0 13.2<br />
Income taxes – 6.6 – 20.0 – 19.0<br />
Net profit 1<br />
21.9 5.0 91.0 16.5 119.0 11.4<br />
Net result from discontinued operations (7) 0.0 151.0 151.0<br />
Net profit (incl. discontinued operations) 21.9 242.0 270.0<br />
Attributable to shareholders of <strong>Rieter</strong> Holding Ltd. 23.9 238.4 267.2<br />
Attributable to non-controlling interests – 2.0 3.6 2.8<br />
Earnings per share 1<br />
CHF 5.17 19.64 25.86<br />
Earnings per share from discontinued operations CHF 0.00 31.94 31.91<br />
Total earnings per share CHF 5.17 51.58 57.77<br />
Total diluted earnings per share CHF 5.17 51.58 57.77<br />
* In % of corporate output.<br />
1. Continuing operations.<br />
Consolidated statement of comprehensive income<br />
CHF million January – June <strong>2012</strong> January – June 2011 January – December 2011<br />
Net profit (incl. discontinued operations) 21.9 242.0 270.0<br />
Currency effects – 2.8 – 31.3 – 30.0<br />
Financial instruments available for sale:<br />
Change in fair value 1.3 – 10.8 – 17.1<br />
Income taxes on change in fair value – 0.3 7.5 13.9<br />
Realized results through income statement 0.0 – 45.3 – 50.3<br />
Realized impairment through income statement 0.0 0.0 2.9<br />
Realized income taxes through income statement 0.0 11.9 9.0<br />
Transfer of currency effects to income statement 0.0 91.7 99.0<br />
Total other comprehensive income – 1.8 23.7 27.4<br />
Total comprehensive income 20.1 265.7 297.4<br />
Attributable to shareholders of <strong>Rieter</strong> Holding Ltd. 22.3 256.4 301.0<br />
Attributable to non-controlling interests – 2.2 9.3 – 3.6
Consolidated balance sheet<br />
CHF million Notes<br />
Assets<br />
<strong>Rieter</strong> . <strong>Semi</strong>-<strong>Annual</strong> <strong>Report</strong> <strong>2012</strong> . Consolidated balance sheet<br />
June 30,<br />
<strong>2012</strong><br />
June 30,<br />
2011<br />
December 31,<br />
2011<br />
Tangible fixed assets 228.5 203.4 227.6<br />
Intangible assets 13.7 12.9 9.5<br />
Other non-current assets, deferred tax assets 83.3 84.9 84.9<br />
Noncurrent assets 325.5 301.2 322.0<br />
Inventories 208.7 251.0 234.8<br />
Trade receivables 121.9 90.4 84.1<br />
Other receivables 43.3 48.6 44.1<br />
Assets of disposal groups (6) 0.0 15.8 10.8<br />
Marketable securities and time deposits 7.6 10.6 7.3<br />
Cash and cash equivalents 354.7 417.9 408.3<br />
Current assets 736.2 834.3 789.4<br />
Assets 1 061.7 1 135.5 1 111.4<br />
Shareholders’ equity and liabilities<br />
Equity attributable to shareholders of <strong>Rieter</strong> Holding Ltd. 367.6 346.1 379.3<br />
Equity attributable to non-controlling interests 6.2 14.3 8.4<br />
Total shareholders’ equity 373.8 360.4 387.7<br />
Long-term financial debt 248.2 272.7 253.5<br />
Provisions, other non-current liabilities 144.3 156.2 146.6<br />
Noncurrent liabilities 392.5 428.9 400.1<br />
Trade payables 72.4 74.2 86.4<br />
Advance payments by customers 74.8 83.7 89.8<br />
Short-term financial debt 6.7 6.0 3.1<br />
Provisions, other current liabilities 141.5 175.5 144.3<br />
Liabilities of disposal groups (6) 0.0 6.8 0.0<br />
Current liabilities 295.4 346.2 323.6<br />
Liabilities 687.9 775.1 723.7<br />
Shareholders’ equity and liabilities 1 061.7 1 135.5 1 111.4<br />
Changes in consolidated equity<br />
CHF million Notes<br />
January – June<br />
<strong>2012</strong><br />
January – June<br />
2011<br />
January –<br />
December<br />
2011<br />
Total shareholders’ equity at end of previous period 387.7 627.6 627.6<br />
Total comprehensive income 20.1 265.7 297.4<br />
Distribution of dividend out of reserve from capital contributions – 27.7<br />
Distribution of shares of Autoneum Holding Ltd. as special dividend: (7)<br />
Fair value of distributed assets 0.0 – 486.9 – 486.9<br />
Derecognition of non-controlling interests 0.0 – 45.9 – 45.9<br />
Special dividend on own shares 0.0 5.2 5.2<br />
Dividends to non-controlling interests 0.0 – 8.5 – 8.5<br />
Non-controlling interests in divested businesses (6) 0.0 0.0 – 4.3<br />
Change in holding of own shares – 6.3 3.2 3.1<br />
Total shareholders’ equity at end of reporting period 373.8 360.4 387.7<br />
7
8<br />
<strong>Rieter</strong> . <strong>Semi</strong>-<strong>Annual</strong> <strong>Report</strong> <strong>2012</strong> . Consolidated statement of cash flows<br />
Consolidated statement of cash flows<br />
CHF million<br />
January – June<br />
<strong>2012</strong><br />
January – June<br />
2011<br />
January –<br />
December<br />
2011<br />
Net profit 1 21.9 91.0 119.0<br />
Interest income / interest expenses 6.6 4.3 10.2<br />
Income taxes 6.6 20.0 19.0<br />
Depreciation and amortization 16.1 17.2 33.9<br />
Other non-cash income and expenses – 13.3 – 44.1 – 53.5<br />
Change in net working capital, other – 34.3 – 30.6 – 17.5<br />
Dividends received 0.0 0.0 0.4<br />
Interest received / interest paid – 10.1 – 8.2 – 7.7<br />
Taxes paid – 10.4 – 16.2 – 23.4<br />
Net cash flows from operating activities 1 – 16.9 33.4 80.4<br />
Net cash flow from operating activities of discontinued operations 0.0 – 70.3 – 70.3<br />
Total net cash from operating activities (incl. discontinued operations) – 16.9 – 36.9 10.1<br />
Capital expenditures / disposals tangible and intangible assets – 20.3 – 12.2 – 53.6<br />
Proceeds from sale of investments (after local taxes) 4.6 42.3 47.3<br />
Investments / disposals other non-current assets 0.3 – 0.2 – 0.1<br />
Sale / purchase of marketable securities and time deposits – 0.4 0.0 0.6<br />
Divestments of businesses 17.2 0.0 4.9<br />
Net cash from investing activities 1 1.4 29.9 – 0.9<br />
Net cash from investing activities of discontinued operations 0.0 – 20.6 – 20.6<br />
Total net cash from investing activities (incl. discontinued operations) 1.4 9.3 – 21.5<br />
Dividend paid to shareholders of <strong>Rieter</strong> Holding Ltd. – 27.7 0.0 0.0<br />
Sale / purchase of own shares – 6.3 3.2 1.1<br />
Proceeds / repayments from / of short-term financial debt 3.3 1.3 0.3<br />
Proceeds from long-term financial debt 0.0 0.0 0.1<br />
Repayments of long-term financial debt – 7.3 – 1.6 – 26.6<br />
Net cash from financing activities 1 – 38.0 2.9 – 25.1<br />
Net cash from financing activities of discontinued operations 0.0 3.5 3.5<br />
Repayment of Group liabilities by Autoneum 0.0 193.1 193.1<br />
Cash balance of Autoneum at date of distribution as special dividend 0.0 – 100.3 – 100.3<br />
Total net cash from financing activities (incl. discontinued operations) – 38.0 99.2 71.2<br />
Currency effects – 0.1 – 5.6 – 3.4<br />
Change in cash and cash equivalents – 53.6 66.0 56.4<br />
Cash and cash equivalents at beginning of year 408.3 351.9 351.9<br />
Cash and cash equivalents at end of reporting period 354.7 417.9 408.3<br />
1. Continuing operations.
Notes to the semiannual financial statements<br />
1 Principles of consolidation and accounting policies<br />
2 Segment information<br />
<strong>Rieter</strong> . <strong>Semi</strong>-<strong>Annual</strong> <strong>Report</strong> <strong>2012</strong> . Notes to the semiannual financial statements<br />
The consolidated semi-annual financial statements have been prepared in accordance with IAS 34 “Interim Financial<br />
<strong>Report</strong>ing”. They are based on the financial statements of the individual group companies drawn up according to<br />
uniform accounting policies as of June 30, <strong>2012</strong>. The principles of consolidation and accounting principles set forth<br />
in the 2011 annual report have been amended in <strong>2012</strong> by the new and revised IFRS standards and interpretations.<br />
The adoption of new or amended regulations had no material impact on the consolidated financial statements. The semi-<br />
annual report has not been audited by the statutory auditor. The consolidated income statement, statement of comprehensive<br />
income, balance sheet, changes in consolidated equity and statement of cash flows are presented in<br />
condensed form.<br />
The Company is comprised of two Business Groups. Spun Yarn Systems develops and manufactures machinery and<br />
systems for processing natural and man-made fibers and their blends into yarns. Premium Textile Components supplies<br />
technology components and service offerings to spinning mills and also to machinery manufacturers.<br />
Premium Total<br />
Spun Yarn Textile reportable<br />
CHF million<br />
January – June <strong>2012</strong><br />
Systems Components segments<br />
Sales to third parties 400.6 86.7 487.3<br />
Inter-segment sales 0.0 28.1 28.1<br />
Net sales to third parties 382.1 79.1 461.2<br />
Corporate output 365.4 118.2 483.6<br />
Operating profit before interest and taxes (EBIT) 27.9 9.3 37.2<br />
Net operating assets June 30, <strong>2012</strong> 154.5 110.6 265.1<br />
Capital expenditures on tangible and intangible assets 18.9 5.3 24.2<br />
Depreciation and amortization 8.6 7.4 16.0<br />
Number of employees June 30, <strong>2012</strong> 3 485 1 165 4 650<br />
January – June 2011<br />
Sales to third parties 425.1 112.7 537.8<br />
Inter-segment sales 0.0 31.3 31.3<br />
Net sales to third parties 403.6 102.2 505.8<br />
Corporate output 449.4 150.2 599.6<br />
Operating profit before interest and taxes (EBIT) 49.6 21.9 71.5<br />
Net operating assets June 30, 2011 143.7 103.9 247.6<br />
Capital expenditures on tangible and intangible assets 11.9 2.5 14.4<br />
Depreciation and amortization 9.0 8.1 17.1<br />
Number of employees June 30, 2011 3 702 1 001 4 703<br />
January – December 2011<br />
Sales to third parties 861.7 199.1 1 060.8<br />
Inter-segment sales 0.0 64.8 64.8<br />
Net sales to third parties 819.5 181.2 1 000.7<br />
Corporate output 866.3 272.6 1 138.9<br />
Operating profit before interest and taxes (EBIT) 81.2 35.1 116.3<br />
Net operating assets December 31, 2011 132.6 107.7 240.3<br />
Capital expenditures on tangible and intangible assets 47.3 9.8 57.1<br />
Depreciation and amortization 17.4 16.3 33.7<br />
Number of employees December 31, 2011 3 594 1 075 4 669<br />
9
10 <strong>Rieter</strong> . <strong>Semi</strong>-<strong>Annual</strong> <strong>Report</strong> <strong>2012</strong> . Notes to the semiannual financial statements<br />
3 Change in sales<br />
Reconciliation of segment results<br />
CHF million<br />
January – June<br />
<strong>2012</strong><br />
January – June<br />
2011<br />
January –<br />
December<br />
2011<br />
Operating profit before interest and taxes (EBIT) of reportable segments 37.2 71.5 116.3<br />
Non-reportable segments (non-wovens) 0.0 0.0 2.4<br />
Elimination of unrealized inter-segment profits 0.3 0.0 – 0.5<br />
Cost allocation discontinued operations 0.0 3.4 3.4<br />
Other units (<strong>Rieter</strong> Holding Ltd., central units) – 5.5 – 4.3 – 9.0<br />
Operating profit before interest and taxes (EBIT) Group 32.0 70.6 112.6<br />
Gain on sale of investments 4.4 45.3 50.3<br />
Financial result – 7.9 – 4.9 – 24.9<br />
Profit before taxes 28.5 111.0 138.0<br />
CHF million<br />
January – June<br />
<strong>2012</strong><br />
January – June<br />
2011<br />
January –<br />
December<br />
2011<br />
Change in sales due to volume and price, Spun Yarn Systems – 20.6 215.7 217.0<br />
Change in sales due to volume and price, Premium Textile Components – 23.4 27.6 21.3<br />
Impact of divestments – 4.8 – 5.2 – 5.8<br />
Currency effects – 1.7 – 24.9 – 42.1<br />
Total change in sales – 50.5 213.2 190.4<br />
4 Sales by location of customers<br />
CHF million<br />
January – June<br />
<strong>2012</strong><br />
January – June<br />
2011<br />
January –<br />
December<br />
2011<br />
Europe 48.2 65.9 123.8<br />
Americas 54.6 59.1 124.0<br />
Africa 15.4 6.0 22.0<br />
China 88.4 75.7 151.0<br />
India 51.4 111.9 175.1<br />
Turkey 90.8 96.8 208.9<br />
Other Asian countries 138.5 122.4 256.0<br />
Total 487.3 537.8 1 060.8<br />
5 Gain on sale of investments<br />
In 2011, <strong>Rieter</strong> reduced its shareholding in Lakshmi Machine Works Ltd. from 13% to approximately 3%, realizing a<br />
pre-tax gain of 50.3 million CHF. Furthermore, <strong>Rieter</strong> sold its non-controlling interests in Lakshmi Ring Travellers (Coimbatore)<br />
Limited in January <strong>2012</strong>, realizing a gain on disposal of 4.4 million CHF.
6 Divestments<br />
<strong>Rieter</strong> . <strong>Semi</strong>-<strong>Annual</strong> <strong>Report</strong> <strong>2012</strong> . Notes to the semiannual financial statements<br />
On January 1, <strong>2012</strong>, <strong>Rieter</strong> sold two manufacturing facilities in the Czech Republic that were part of segment Spun<br />
Yarn Systems. They operate as suppliers to <strong>Rieter</strong> and other industrial companies and generated third party sales of<br />
4.8 million CHF in 2011. The resulting divestment gain of 6.0 million CHF was recognized in other operating income.<br />
In accordance with IFRS 5, the concerned assets were classified as a disposal group in the balance sheet as of December<br />
31, 2011.<br />
On July 1, 2011, <strong>Rieter</strong> sold <strong>Rieter</strong>-LMW Machinery Ltd. that was part of segment Spun Yarn Systems. The resulting<br />
divestment gain of 3.2 million CHF was recognized in other operating income. <strong>Rieter</strong>-LMW Machinery Ltd. did not<br />
generate any material third party sales. In accordance with IFRS 5, the concerned assets and liabilities were classified<br />
as a disposal group in the balance sheet as of June 30, 2011.<br />
7 Discontinued operations Automotive Systems<br />
In 2011, the shares in Autoneum Holding Ltd. were distributed to the shareholders of <strong>Rieter</strong> Holding Ltd. as a special<br />
dividend and were listed on the SIX Swiss Exchange. Autoneum Holding Ltd. is the parent company of all legal entities<br />
belonging to the former <strong>Rieter</strong> Automotive Systems segment.<br />
The result of the discontinued operations that was included in the consolidated income statement 2011 was as follows:<br />
CHF million<br />
January 1 –<br />
May 12, 2011<br />
Sales 658.9<br />
Expenses – 652.8<br />
Result before taxes 6.1<br />
Income tax – 5.4<br />
Result after taxes 0.7<br />
Gain from differences between carrying values of dividend liability and net assets 251.9<br />
Reclassification of other components of comprehensive income to the income statement – 91.7<br />
Transaction costs – 9.9<br />
Total net result from discontinued operations 151.0<br />
8 Average exchange rates for foreign currency translation<br />
January – June<br />
<strong>2012</strong><br />
January – June<br />
2011 Change<br />
January –<br />
December<br />
2011<br />
1 EUR 1.20 1.27 – 5% 1.23<br />
1 USD 0.93 0.90 3% 0.89<br />
100 CZK 4.79 5.22 – 8% 5.02<br />
100 INR 1.78 2.01 – 11% 1.91<br />
100 CNY 14.70 13.84 6% 13.71<br />
9 Events after balance sheet date; financial calendar<br />
The semi-annual report for <strong>2012</strong> was approved for publication by the Board of Directors on July 24, <strong>2012</strong>.<br />
No events have occurred up to July 25, <strong>2012</strong>, which would necessitate adjustments to the semi-annual report.<br />
Publication of sales figures for the <strong>2012</strong> financial year February 5, 2013<br />
Result press conference and presentation of the <strong>2012</strong> financial statements March 21, 2013<br />
<strong>Annual</strong> General Meeting April 18, 2013<br />
11
<strong>Rieter</strong> Holding AG<br />
CH-8406 Winterthur<br />
T +41 52 208 71 71<br />
F +41 52 208 70 60<br />
www.rieter.com<br />
Corporate Communications<br />
T +41 52 208 70 32<br />
F +41 52 208 70 60<br />
media@rieter.com<br />
Investor Relations<br />
T +41 52 208 70 32<br />
F +41 52 208 70 60<br />
investor@rieter.com<br />
All statements in this report which do not refer to historical facts are statements<br />
related to the future which offer no guarantee with regard to future performance;<br />
they are subject to risks and uncertainties including, but not confined to, future<br />
global economic conditions, exchange rates, legal provisions, market conditions,<br />
activities by competitors and other factors outside the company’s control.