Chapter 7 Spatial Analysis
Chapter 7 Spatial Analysis
Chapter 7 Spatial Analysis

Create successful ePaper yourself
Turn your PDF publications into a flip-book with our unique Google optimized e-Paper software.
“Knowing where things are and why is essential to rational decision-making”Jack Dangermond<strong>Chapter</strong> 7 <strong>Spatial</strong> <strong>Analysis</strong>Playing with placesWhen you think of a name and address database, you probably visualise a tableof data in rows and columns What you might miss is that each of these recordsrepresents a person or family that lives in a particular place (location) Furthermore,that particular place (location) can tell us something about a person’sstandard of living, neighbourhood, access to schools, access to hospital,distance to the main market, vulnerability to local crime, exposure to pollutionlevels and so on Through GIS analysis, it allows us to visualise the ‘biggerpicture’ by allowing us to see patterns and relationships within the geographicdata The results of analysis give insight into a place, help focus actions or selectan appropriate option The beauty of GIS is its ability to perform spatialanalysisWhat is spatial analysis?<strong>Spatial</strong> analysis is a process for looking at geographic patterns in data andrelationships between features The actual methods used can be simple—just amap of the theme being analysed—or more complex involving models thatmimic the world by combining many data layers<strong>Spatial</strong> analysis allows us to study real-world processes It gives informationabout the real world that may be the present situation of specific areas andfeatures or the changes or trends in a situation For instance, it may be able toanswer ‘where and by how much are forest areas decreasing or increasing?’ or‘where are urban areas growing in the Kathmandu valley?’ and so on<strong>Spatial</strong> analysis functions<strong>Spatial</strong> analysis functions range from simple database query to arithmetic andlogical operation to complicated model analysis Each of these functions isbriefly described belowDatabase queryDatabase query is used to retrieve attribute data without altering the existingdata The function can be performed by simply clicking on the feature or bymeans of a conditional statement for complex queries The conditional statementcan involved Boolean (logical) operators—and, or, not, xor (exclusive ofor)—or relational (conditional) operators—=, >,
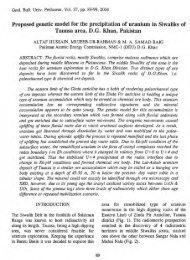
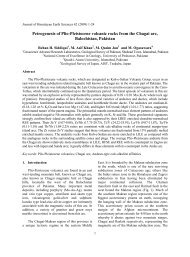
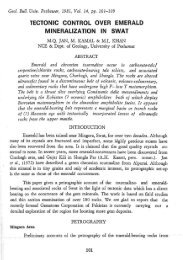
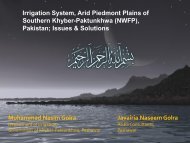
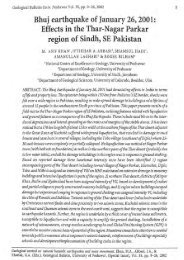
Figure 71Boolean operationsFor example, in Figure 72, the Boolean operator used is ([LandUse] = ‘Agriculture’)OR ([LandUse] = ‘Shrub’)Reclassification(Re)classification operations involve the reassignment of thematic values tocategories of an existing map The following are examples• Classify an elevation map into classes with intervals of 500 m (Figure 73)• Reclassify a VDC (village development committee) map based on populationdensity (Figure 74)Figure 72Selection usingBoolean operatorsOverlayOverlay is at the core of GIS analysis operations It combines several spatialfeatures to generate new spatial elements Overlay can be defined as a spatial34GIS for beginners
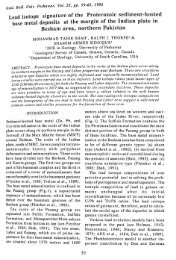
Figure 73Classification of an elevation map of Kathmanduvalley into different intervalsFigure 74Classification of a VDC map of Kathmandu valleybased on population density, 1991operation that combines various geographic layers to generate new informationOverlay is done using arithmetic, Boolean and relational operators, and isperformed in both vector and raster domainsVector overlayDuring vector overlay, map features and their associated attributes are integratedto produce a new composite map Logical rules can be applied todetermine how the maps are combined Vector overlay can be performed onvarious types of map feature: polygon-on-polygon, line-on-polygon, point-onpolygon(Figure 75) During the process of overlay, the attribute data associatedwith each feature type are merged The resulting table will contain all theattribute dataFigure 75Vector overlayRaster overlayIn raster overlay, the pixel or grid cell values in each map are combined usingarithmetic and Boolean operators to produce a new value in the compositemap The maps can be treated as arithmetic variables and perform complexalgebraic functions The method is often described as map algebra (Figure 76)The raster GIS provides the ability to perform map layers mathematically Themap algebraic function uses mathematical expressions to create new rasterlayers by comparing themspatial analysis 35
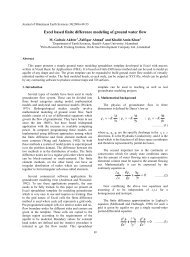
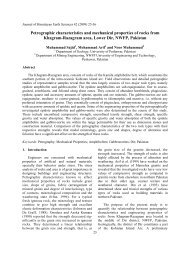
Land use/cover of KathmanduValley, 1978Land use/cover of KathmanduValley, 1995Land use/cover of KathmanduValley, 1978-1995Figure 78Land-cover change inthe Kathmanduvalley between 1978and 1995Proximity analysisProximity analysis is the measurement of distances from points, lines andboundaries of polygons One of the most popular types of proximity analysis is‘buffering’ by which a buffer zone with a given distance is generated around apoint, line or area as shown in Figure 79Buffering is easier to generate for raster datathan for vector dataFigure 710 shows walking distance from theICIMOD buildingFigure 79Buffer operationsFigure 710Walking distances from ICIMODspatial analysis 37