<strong>Notes</strong> <strong>to</strong> <strong>Financial</strong> <strong>Statements</strong>DECEMBER 31, 2008, 2007 AND 2006(Amounts in Millions Except Per Share Data)risk-reward balance and maximize return on the Group’s capital. The Group’s Risk Management Committee (RMC) has overall responsibilityfor the Group’s risk management systems and sets risks management policies across the full range of risks <strong>to</strong> which the Group is exposed.Specifically, the Group’s RMC places trading limits on the level of exposure that can be taken in relation <strong>to</strong> both overnight and intra-daymarket positions. With the exception of specific hedging arrangements, foreign exchange and interest rate exposures associated with thesederivatives are normally offset by entering in<strong>to</strong> counterbalancing positions, thereby controlling the variability in the net cash amounts required<strong>to</strong> liquidate market positions.Within the Group’s overall risk management system, the Assets and Liabilities Committee (ALCO) is responsible for managing the Group’sstatement of condition, including the Group’s liquidity, interest rate and foreign exchange related risks. In addition, ALCO formulates investmentand financial policies by determining the asset allocation and funding mix strategies that are likely <strong>to</strong> yield the targeted financial results.Separately, the Risk Management Group (RMG) is mandated <strong>to</strong> adequately and consistently evaluate, manage, control, and moni<strong>to</strong>r the overallrisk profile of the Bank’s activities across the different risk areas (i.e., credit, market, liquidity, and operational) <strong>to</strong> optimize the risk-rewardbalance and maximize return on capital. RMG has responsibility for the setting of risk policies across the full range of risks <strong>to</strong> which the Groupis exposed <strong>to</strong>.In the performance of its function, RMG observes the following framework:• It is responsible for policy formulation in coordination with the relevant businesses/functions and ensures that proper approval for themanuals/policies is obtained from the appropriate body.• It then disseminates down the approved policies <strong>to</strong> the relevant businesses/functions after which, pertinent authorities are delegateddown <strong>to</strong> the businesses/functions <strong>to</strong> guide them in the conduct of their businesses/functions. RMG then performs compliance moni<strong>to</strong>ringand review <strong>to</strong> ensure approved policies are adhered <strong>to</strong>.• It is responsible for clarifying interpretations of risk policies/guidelines raised by the Business Heads/Units.• When adverse trends are observed in the account/portfolio, RMG is responsible for flagging these trends and ensuring relevant policiesfor problem accounts/portfolio management are properly applied.• RMG is responsible for the direct management of accounts in the Group’s Non-Performing Loan (NPL)/property-related items inlitigations portfolio and ensure that appropriate strategies are formulated <strong>to</strong> maximize collection and/or recovery of these assets.• It is also responsible for regular review and moni<strong>to</strong>ring of accounts under their supervision and ensuring that the account’s loanclassification is assessed timely and accurately.4.1 Liquidity RiskLiquidity risk is the risk that there could be insufficient funds available <strong>to</strong> adequately meet the credit demands of the Group’s cus<strong>to</strong>mers andrepay deposits on maturity. The Group manages liquidity risk by holding sufficient liquid assets of appropriate quality <strong>to</strong> ensure short-termfunding requirements are met and by maintaining a balanced loan portfolio which is repriced on a regular basis. In addition, the Group seeks<strong>to</strong> maintain sufficient liquidity <strong>to</strong> take advantage of interest rate and exchange rate opportunities when they arise.The analysis of the maturity groupings of resources, liabilities and off-statement of condition items as of December 31, 2008 and 2007 inaccordance with account classification of the BSP, are presented below. The amounts disclosed in the maturity analysis are the contractualundiscounted cash flows. Such undiscounted cash flows differ from the amounts included in the statement of condition because the statemen<strong>to</strong>f condition amounts are based on discounted cash flows.GroupMoreOne <strong>to</strong> than three More than Morethree months <strong>to</strong> one year <strong>to</strong> than threemonths one year three years years TotalDecember 31, 2008:Resources:Cash P 21,770 P - P - P - P 21,770Loans 230,490 50,656 44,846 165,994 491,986Investments 6,129 8,000 39,274 102,748 156,151Placements 79,722 48 - - 79,770Other resources - 10,642 ( 177 ) 41,890 52,355Total Resources 338,111 69,346 83,943 310,632 802,032Liabilities and Equity:Deposit liabilities 126,270 4,598 14,960 490,926 636,754Bills payable 29,909 13,423 697 27,552 71,581Other liabilities P 3,689 P 29,645 P 2,724 (P 135 ) P 35,923Total Liabilities (Carried Forward) P 159,868 P 47,666 P 18,381 P 518,343 P 744,25826Thinking Ahead To Get You Ahead • Annual Report 2008
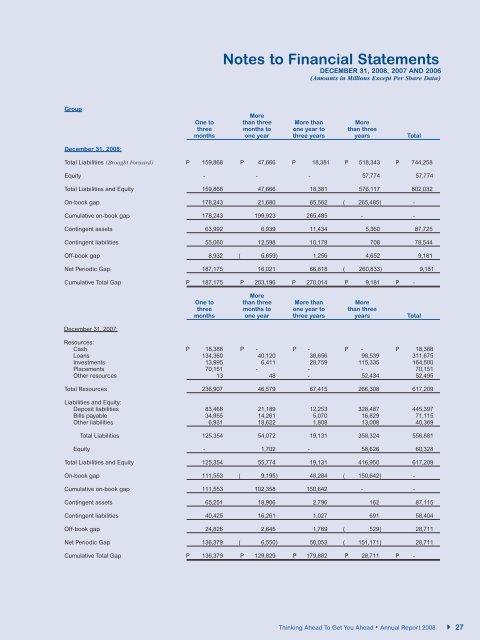
<strong>Notes</strong> <strong>to</strong> <strong>Financial</strong> <strong>Statements</strong>DECEMBER 31, 2008, 2007 AND 2006(Amounts in Millions Except Per Share Data)GroupMoreOne <strong>to</strong> than three More than Morethree months <strong>to</strong> one year <strong>to</strong> than threemonths one year three years years TotalDecember 31, 2008:Total Liabilities (Brought Forward) P 159,868 P 47,666 P 18,381 P 518,343 P 744,258Equity - - - 57,774 57,774Total Liabilities and Equity 159,868 47,666 18,381 576,117 802,032On-book gap 178,243 21,680 65,562 ( 265,485 ) -Cumulative on-book gap 178,243 199,923 265,485 - -Contingent assets 63,992 6,939 11,434 5,360 87,725Contingent liabilities 55,060 12,598 10,178 708 78,544Off-book gap 8,932 ( 5,659 ) 1,256 4,652 9,181Net Periodic Gap 187,175 16,021 66,818 ( 260,833 ) 9,181Cumulative Total Gap P 187,175 P 203,196 P 270,014 P 9,181 P -December 31, 2007:MoreOne <strong>to</strong> than three More than Morethree months <strong>to</strong> one year <strong>to</strong> than threemonths one year three years years TotalResources:Cash P 18,388 P - P - P - P 18,388Loans 134,360 40,120 38,656 98,539 311,675Investments 13,995 6,411 28,759 115,335 164,500Placements 70,151 - - - 70,151Other resources 13 48 - 52,434 52,495Total Resources 236,907 46,579 67,415 266,308 617,209Liabilities and Equity:Deposit liabilities 83,468 21,189 12,253 328,487 445,397Bills payable 34,955 14,261 5,070 16,829 71,115Other liabilities 6,931 18,622 1,808 13,008 40,369Total Liabilities 125,354 54,072 19,131 358,324 556,881Equity - 1,702 - 58,626 60,328Total Liabilities and Equity 125,354 55,774 19,131 416,950 617,209On-book gap 111,553 ( 9,195 ) 48,284 ( 150,642 ) -Cumulative on-book gap 111,553 102,358 150,642 - -Contingent assets 65,251 18,906 2,796 162 87,115Contingent liabilities 40,425 16,261 1,027 691 58,404Off-book gap 24,826 2,645 1,769 ( 529 ) 28,711Net Periodic Gap 136,379 ( 6,550 ) 50,053 ( 151,171 ) 28,711Cumulative Total Gap P 136,379 P 129,829 P 179,882 P 28,711 P -Thinking Ahead To Get You Ahead • Annual Report 2008 27