OTHER INFORMATION PRODUCTION STATISTICS<strong>2012</strong> 2011Other Mining and Industrial segment (1)PhosphatesFertilisers produced tonnes 1,113,000 1,060,900NiobiumOre mined tonnes 933,200 866,600Ore processed tonnes 973,500 902,600Ore grade processed Kg Nb/tonne 8.5 8.1Production tonnes 4,400 3,900AmapáSinter feed tonnes 2,100,000 1,401,000Pellet feed tonnes 2,223,200 1,948,300Spiral concentrates tonnes 1,749,100 1,472,2006,072,300 4,821,500TarmacAggregates tonnes 37,570,800 42,878,400Lime products tonnes 1,316,900 1,264,000Concrete m 3 3,119,300 3,285,700Scaw Metals (2)South Africa Steel Products tonnes 611,600 677,400Zinc and leadLisheen (3)Ore mined tonnes – 152,800Ore processed tonnes – 156,200Ore grade processed Zinc % Zn – 13.4Lead % Pb – 2.7Production Zinc in concentrate tonnes – 19,200Lead in concentrate tonnes – 2,900Black Mountain (3)Ore mined tonnes – 132,800Ore processed tonnes – 126,200Ore grade processed Zinc % Zn – 3.4Lead % Pb – 4.5Copper % Cu – 0.4Production Zinc in concentrate tonnes – 3,300Lead in concentrate tonnes – 5,400Copper in concentrate tonnes – 300Total attributable zinc production tonnes – 22,500Total attributable lead production tonnes – 8,300(1)In <strong>2012</strong> Amapá has been reclassified from Iron Ore and Manganese to Other Mining and Industrial to align with internal management reporting. Comparatives have been reclassified to alignwith current presentation.(2)The Group sold its interest in Scaw Metals in November <strong>2012</strong>.(3)The Group sold its interest in Lisheen and Black Mountain in February 2011.234 <strong>Anglo</strong> <strong>American</strong> plc <strong>Annual</strong> <strong>Report</strong> <strong>2012</strong>
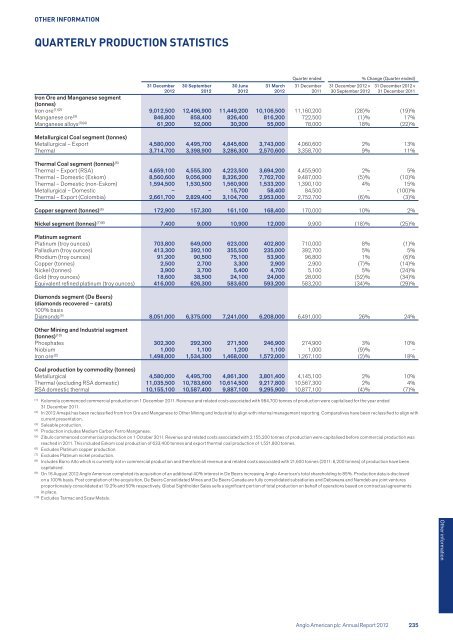
OTHER INFORMATIONQUARTERLY PRODUCTION STATISTICSQuarter ended% Change (Quarter ended)31 December<strong>2012</strong>30 September<strong>2012</strong>30 June<strong>2012</strong>31 March<strong>2012</strong>31 December201131 December <strong>2012</strong> v30 September <strong>2012</strong>31 December <strong>2012</strong> v31 December 2011Iron Ore and Manganese segment(tonnes)Iron ore (1)(2) 9,012,500 12,496,900 11,449,200 10,106,500 11,160,200 (28)% (19)%Manganese ore (3) 846,800 858,400 826,400 816,200 722,500 (1)% 17%Manganese alloys (3)(4) 61,200 52,000 30,200 55,000 78,000 18% (22)%Metallurgical Coal segment (tonnes)Metallurgical – Export 4,580,000 4,495,700 4,845,600 3,743,000 4,060,600 2% 13%Thermal 3,714,700 3,398,900 3,286,300 2,570,600 3,358,700 9% 11%Thermal Coal segment (tonnes) (5)Thermal – Export (RSA) 4,659,100 4,555,300 4,223,500 3,694,200 4,455,900 2% 5%Thermal – Domestic (Eskom) 8,560,600 9,056,900 8,326,200 7,762,700 9,487,000 (5)% (10)%Thermal – Domestic (non-Eskom) 1,594,500 1,530,500 1,560,900 1,533,200 1,390,100 4% 15%Metallurgical – Domestic – – 15,700 58,400 84,500 – (100)%Thermal – Export (Colombia) 2,661,700 2,829,400 3,104,700 2,953,000 2,752,700 (6)% (3)%Copper segment (tonnes) (6) 172,900 157,300 161,100 168,400 170,000 10% 2%Nickel segment (tonnes) (7)(8) 7,400 9,000 10,900 12,000 9,900 (18)% (25)%Platinum segmentPlatinum (troy ounces) 703,800 649,000 623,000 402,800 710,000 8% (1)%Palladium (troy ounces) 413,300 392,100 355,500 235,000 392,700 5% 5%Rhodium (troy ounces) 91,200 90,500 75,100 53,900 96,800 1% (6)%Copper (tonnes) 2,500 2,700 3,300 2,900 2,900 (7)% (14)%Nickel (tonnes) 3,900 3,700 5,400 4,700 5,100 5% (24)%Gold (troy ounces) 18,600 38,500 24,100 24,000 28,000 (52)% (34)%Equivalent refined platinum (troy ounces) 416,000 626,300 583,600 593,200 583,200 (34)% (29)%Diamonds segment (De Beers)(diamonds recovered – carats)100% basisDiamonds (9) 8,051,000 6,375,000 7,241,000 6,208,000 6,491,000 26% 24%Other Mining and Industrial segment(tonnes) (10)Phosphates 302,300 292,300 271,500 246,900 274,900 3% 10%Niobium 1,000 1,100 1,200 1,100 1,000 (9)% –Iron ore (2) 1,498,000 1,534,300 1,468,000 1,572,000 1,267,100 (2)% 18%Coal production by commodity (tonnes)Metallurgical 4,580,000 4,495,700 4,861,300 3,801,400 4,145,100 2% 10%Thermal (excluding RSA domestic) 11,035,500 10,783,600 10,614,500 9,217,800 10,567,300 2% 4%RSA domestic thermal 10,155,100 10,587,400 9,887,100 9,295,900 10,877,100 (4)% (7)%(1)Kolomela commenced commercial production on 1 December 2011. Revenue and related costs associated with 984,700 tonnes of production were capitalised for the year ended31 December 2011.(2)In <strong>2012</strong> Amapá has been reclassified from Iron Ore and Manganese to Other Mining and Industrial to align with internal management reporting. Comparatives have been reclassified to align withcurrent presentation.(3)Saleable production.(4)Production includes Medium Carbon Ferro Manganese.(5)Zibulo commenced commercial production on 1 October 2011. Revenue and related costs associated with 2,155,200 tonnes of production were capitalised before commercial production wasreached in 2011. This included Eskom coal production of 633,400 tonnes and export thermal coal production of 1,521,800 tonnes.(6)Excludes Platinum copper production.(7)Excludes Platinum nickel production.(8)Includes Barro Alto which is currently not in commercial production and therefore all revenue and related costs associated with 21,600 tonnes (2011: 6,200 tonnes) of production have beencapitalised.(9)On 16 August <strong>2012</strong> <strong>Anglo</strong> <strong>American</strong> completed its acquisition of an additional 40% interest in De Beers increasing <strong>Anglo</strong> <strong>American</strong>’s total shareholding to 85%. Production data is disclosedon a 100% basis. Post completion of the acquisition, De Beers Consolidated Mines and De Beers Canada are fully consolidated subsidiaries and Debswana and Namdeb are joint venturesproportionately consolidated at 19.2% and 50% respectively. Global Sightholder Sales sells a significant portion of total production on behalf of operations based on contractual agreementsin place.(10)Excludes Tarmac and Scaw Metals.Other information<strong>Anglo</strong> <strong>American</strong> plc <strong>Annual</strong> <strong>Report</strong> <strong>2012</strong> 235
- Page 1 and 2:
A BALANCEDPORTFOLIOWITH THE FUTURE
- Page 4 and 5:
HeadquartersLondon,United KingdomCo
- Page 6 and 7:
OVERVIEW CHAIRMAN’S STATEMENTCHAI
- Page 8 and 9:
OVERVIEW MARKETPLACEA BRIGHTER OUTL
- Page 10 and 11:
OVERVIEW MARKETPLACEWELL PLACED FOR
- Page 12 and 13:
OVERVIEW OUR STRATEGY AND BUSINESS
- Page 14 and 15:
OVERVIEW CHIEF EXECUTIVE’S STATEM
- Page 16 and 17:
OPERATING AND FINANCIAL REVIEW KEY
- Page 18 and 19:
OPERATING AND FINANCIAL REVIEW STRA
- Page 20 and 21:
OPERATING AND FINANCIAL REVIEW STRA
- Page 22 and 23:
OPERATING AND FINANCIAL REVIEW STRA
- Page 24 and 25:
OPERATING AND FINANCIAL REVIEW STRA
- Page 26 and 27:
OPERATING AND FINANCIAL REVIEW STRA
- Page 28 and 29:
OPERATING AND FINANCIAL REVIEW STRA
- Page 30 and 31:
OPERATING AND FINANCIAL REVIEW STRA
- Page 32 and 33:
OPERATING AND FINANCIAL REVIEW STRA
- Page 34 and 35:
OPERATING AND FINANCIAL REVIEW STRA
- Page 36 and 37:
OPERATING AND FINANCIAL REVIEW STRA
- Page 38 and 39:
OPERATING AND FINANCIAL REVIEW STRA
- Page 40 and 41:
OPERATING AND FINANCIAL REVIEW RESO
- Page 42 and 43:
OPERATING AND FINANCIAL REVIEW RESO
- Page 44 and 45:
OPERATING AND FINANCIAL REVIEW RESO
- Page 46 and 47:
OPERATING AND FINANCIAL REVIEW GROU
- Page 48 and 49:
OPERATING AND FINANCIAL REVIEW GROU
- Page 50 and 51:
OPERATING AND FINANCIAL REVIEW GROU
- Page 52 and 53:
OPERATING AND FINANCIAL REVIEW RISK
- Page 54 and 55:
OPERATING AND FINANCIAL REVIEW RISK
- Page 56 and 57:
OPERATING AND FINANCIAL REVIEW RISK
- Page 58 and 59:
OPERATING AND FINANCIAL REVIEW IRON
- Page 60 and 61:
OPERATING AND FINANCIAL REVIEW IRON
- Page 62 and 63:
OPERATING AND FINANCIAL REVIEW IRON
- Page 64 and 65:
OPERATING AND FINANCIAL REVIEW META
- Page 66 and 67:
OPERATING AND FINANCIAL REVIEW META
- Page 68 and 69:
OPERATING AND FINANCIAL REVIEW THER
- Page 70 and 71:
OPERATING AND FINANCIAL REVIEW THER
- Page 72 and 73:
OPERATING AND FINANCIAL REVIEW COPP
- Page 74 and 75:
OPERATING AND FINANCIAL REVIEW COPP
- Page 76 and 77:
OPERATING AND FINANCIAL REVIEW NICK
- Page 78 and 79:
OPERATING AND FINANCIAL REVIEW NICK
- Page 80 and 81:
OPERATING AND FINANCIAL REVIEW PLAT
- Page 82 and 83:
OPERATING AND FINANCIAL REVIEW PLAT
- Page 84 and 85:
OPERATING AND FINANCIAL REVIEW PLAT
- Page 86 and 87:
OPERATING AND FINANCIAL REVIEW DIAM
- Page 88 and 89:
OPERATING AND FINANCIAL REVIEW DIAM
- Page 90 and 91:
OPERATING AND FINANCIAL REVIEW OTHE
- Page 92 and 93:
OPERATING AND FINANCIAL REVIEW OTHE
- Page 94 and 95:
GOVERNANCE INTRODUCTIONGOVERNANCESi
- Page 96 and 97:
GOVERNANCE THE BOARDTHE BOARDCHAIRM
- Page 98 and 99:
GOVERNANCE EXECUTIVE MANAGEMENTEXEC
- Page 100 and 101:
GOVERNANCE ROLE OF THE BOARDTHE ROL
- Page 102 and 103:
GOVERNANCE BOARD IN ACTIONBOARD VIS
- Page 104 and 105:
GOVERNANCE BOARD IN ACTIONBOARDCOMM
- Page 106 and 107:
GOVERNANCE BOARD IN ACTIONNOMINATIO
- Page 108 and 109:
GOVERNANCE AUDIT COMMITTEE REPORTAU
- Page 110 and 111:
GOVERNANCE AUDIT COMMITTEE REPORTOb
- Page 112 and 113:
GOVERNANCE DIRECTORS’ REMUNERATIO
- Page 114 and 115:
GOVERNANCE DIRECTORS’ REMUNERATIO
- Page 116 and 117:
GOVERNANCE DIRECTORS’ REMUNERATIO
- Page 118 and 119:
GOVERNANCE DIRECTORS’ REMUNERATIO
- Page 120 and 121:
GOVERNANCE DIRECTORS’ REMUNERATIO
- Page 122 and 123:
GOVERNANCE DIRECTORS’ REMUNERATIO
- Page 124 and 125:
GOVERNANCE DIRECTORS’ REMUNERATIO
- Page 126 and 127:
GOVERNANCE DIRECTORS’ REMUNERATIO
- Page 128 and 129:
GOVERNANCE DIRECTORS’ REMUNERATIO
- Page 130 and 131:
GOVERNANCE DIRECTORS’ REMUNERATIO
- Page 132 and 133:
GOVERNANCE DIRECTORS’ REPORTDIREC
- Page 134 and 135:
GOVERNANCE DIRECTORS’ REPORTEMPLO
- Page 136 and 137:
GOVERNANCE DIRECTORS’ REPORTIssue
- Page 138 and 139:
GOVERNANCE STATEMENT OF DIRECTORS
- Page 140 and 141:
FINANCIAL STATEMENTSRESPONSIBILITY
- Page 142 and 143:
FINANCIAL STATEMENTS PRINCIPAL STAT
- Page 144 and 145:
FINANCIAL STATEMENTS PRINCIPAL STAT
- Page 146 and 147:
FINANCIAL STATEMENTSNOTES TO THE FI
- Page 148 and 149:
FINANCIAL STATEMENTS NOTES TO THE F
- Page 150 and 151:
FINANCIAL STATEMENTS NOTES TO THE F
- Page 152 and 153:
FINANCIAL STATEMENTS NOTES TO THE F
- Page 154 and 155:
FINANCIAL STATEMENTS NOTES TO THE F
- Page 156 and 157:
FINANCIAL STATEMENTS NOTES TO THE F
- Page 158 and 159:
FINANCIAL STATEMENTS NOTES TO THE F
- Page 160 and 161:
FINANCIAL STATEMENTS NOTES TO THE F
- Page 162 and 163:
FINANCIAL STATEMENTS NOTES TO THE F
- Page 164 and 165:
FINANCIAL STATEMENTS NOTES TO THE F
- Page 166 and 167:
FINANCIAL STATEMENTS NOTES TO THE F
- Page 168 and 169:
FINANCIAL STATEMENTS NOTES TO THE F
- Page 170 and 171:
FINANCIAL STATEMENTS NOTES TO THE F
- Page 172 and 173:
FINANCIAL STATEMENTS NOTES TO THE F
- Page 174 and 175:
FINANCIAL STATEMENTS NOTES TO THE F
- Page 176 and 177:
FINANCIAL STATEMENTS NOTES TO THE F
- Page 178 and 179:
FINANCIAL STATEMENTS NOTES TO THE F
- Page 180 and 181:
FINANCIAL STATEMENTS NOTES TO THE F
- Page 182 and 183:
FINANCIAL STATEMENTS NOTES TO THE F
- Page 184 and 185:
FINANCIAL STATEMENTS NOTES TO THE F
- Page 186 and 187:
FINANCIAL STATEMENTS NOTES TO THE F
- Page 188 and 189: FINANCIAL STATEMENTS NOTES TO THE F
- Page 190 and 191: FINANCIAL STATEMENTS NOTES TO THE F
- Page 192 and 193: FINANCIAL STATEMENTS NOTES TO THE F
- Page 194 and 195: FINANCIAL STATEMENTS NOTES TO THE F
- Page 196 and 197: ORE RESERVES AND MINERAL RESOURCESE
- Page 198 and 199: ORE RESERVES AND MINERAL RESOURCESE
- Page 200 and 201: ORE RESERVES AND MINERAL RESOURCESI
- Page 202 and 203: ORE RESERVES AND MINERAL RESOURCESI
- Page 204 and 205: ORE RESERVES AND MINERAL RESOURCESC
- Page 206 and 207: ORE RESERVES AND MINERAL RESOURCESC
- Page 208 and 209: ORE RESERVES AND MINERAL RESOURCESC
- Page 210 and 211: ORE RESERVES AND MINERAL RESOURCESC
- Page 212 and 213: ORE RESERVES AND MINERAL RESOURCESC
- Page 214 and 215: ORE RESERVES AND MINERAL RESOURCESC
- Page 216 and 217: ORE RESERVES AND MINERAL RESOURCESC
- Page 218 and 219: ORE RESERVES AND MINERAL RESOURCESP
- Page 220 and 221: ORE RESERVES AND MINERAL RESOURCESP
- Page 222 and 223: ORE RESERVES AND MINERAL RESOURCESD
- Page 224 and 225: ORE RESERVES AND MINERAL RESOURCESD
- Page 226 and 227: ORE RESERVES AND MINERAL RESOURCESP
- Page 228 and 229: ORE RESERVES AND MINERAL RESOURCESR
- Page 230 and 231: ORE RESERVES AND MINERAL RESOURCESR
- Page 232 and 233: ORE RESERVES AND MINERAL RESOURCESD
- Page 234 and 235: ORE RESERVES AND MINERAL RESOURCESG
- Page 236 and 237: OTHER INFORMATION PRODUCTION STATIS
- Page 240 and 241: OTHER INFORMATIONEXCHANGE RATES AND
- Page 242 and 243: OTHER INFORMATIONKEY FINANCIAL DATA
- Page 244 and 245: OTHER INFORMATIONRECONCILIATION OF
- Page 246 and 247: OTHER INFORMATIONTHE BUSINESS - AN
- Page 248 and 249: OTHER INFORMATIONSHAREHOLDER INFORM
- Page 250: Anglo American plc20 Carlton House


![English PDF [ 189KB ] - Anglo American](https://img.yumpu.com/50470814/1/184x260/english-pdf-189kb-anglo-american.jpg?quality=85)


![pdf [ 595KB ] - Anglo American](https://img.yumpu.com/49420483/1/184x260/pdf-595kb-anglo-american.jpg?quality=85)
![pdf [ 1.1MB ] - Anglo American](https://img.yumpu.com/49057963/1/190x240/pdf-11mb-anglo-american.jpg?quality=85)

