

Anglo American Annual Report 2012
Anglo American Annual Report 2012
Anglo American Annual Report 2012
- No tags were found...

Create successful ePaper yourself
Turn your PDF publications into a flip-book with our unique Google optimized e-Paper software.
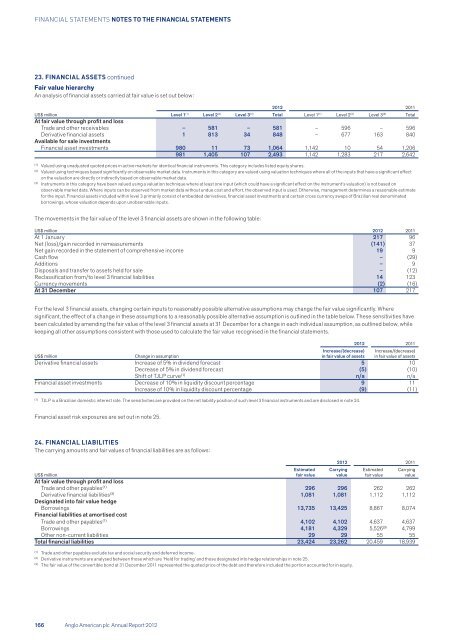
FINANCIAL STATEMENTS NOTES TO THE FINANCIAL STATEMENTS23. FINANCIAL ASSETS continuedFair value hierarchyAn analysis of financial assets carried at fair value is set out below:<strong>2012</strong> 2011US$ million Level 1 (1) Level 2 (2) Level 3 (3) Total Level 1 (1) Level 2 (2) Level 3 (3) TotalAt fair value through profit and lossTrade and other receivables – 581 – 581 – 596 – 596Derivative financial assets 1 813 34 848 – 677 163 840Available for sale investmentsFinancial asset investments 980 11 73 1,064 1,142 10 54 1,206981 1,405 107 2,493 1,142 1,283 217 2,642(1)Valued using unadjusted quoted prices in active markets for identical financial instruments. This category includes listed equity shares.(2)Valued using techniques based significantly on observable market data. Instruments in this category are valued using valuation techniques where all of the inputs that have a significant effecton the valuation are directly or indirectly based on observable market data.(3)Instruments in this category have been valued using a valuation technique where at least one input (which could have a significant effect on the instrument’s valuation) is not based onobservable market data. Where inputs can be observed from market data without undue cost and effort, the observed input is used. Otherwise, management determines a reasonable estimatefor the input. Financial assets included within level 3 primarily consist of embedded derivatives, financial asset investments and certain cross currency swaps of Brazilian real denominatedborrowings, whose valuation depends upon unobservable inputs.The movements in the fair value of the level 3 financial assets are shown in the following table:US$ million <strong>2012</strong> 2011At 1 January 217 96Net (loss)/gain recorded in remeasurements (141) 37Net gain recorded in the statement of comprehensive income 19 9Cash flow – (29)Additions – 9Disposals and transfer to assets held for sale – (12)Reclassification from/to level 3 financial liabilities 14 123Currency movements (2) (16)At 31 December 107 217For the level 3 financial assets, changing certain inputs to reasonably possible alternative assumptions may change the fair value significantly. Wheresignificant, the effect of a change in these assumptions to a reasonably possible alternative assumption is outlined in the table below. These sensitivities havebeen calculated by amending the fair value of the level 3 financial assets at 31 December for a change in each individual assumption, as outlined below, whilekeeping all other assumptions consistent with those used to calculate the fair value recognised in the financial statements.Increase/(decrease)in fair value of assets<strong>2012</strong> 2011Increase/(decrease)in fair value of assetsUS$ millionChange in assumptionDerivative financial assets Increase of 5% in dividend forecast 5 10Decrease of 5% in dividend forecast (5) (10)Shift of TJLP curve (1) n/a n/aFinancial asset investments Decrease of 10% in liquidity discount percentage 9 11Increase of 10% in liquidity discount percentage (9) (11)(1)TJLP is a Brazilian domestic interest rate. The sensitivities are provided on the net liability position of such level 3 financial instruments and are disclosed in note 24.Financial asset risk exposures are set out in note 25.24. FINANCIAL LIABILITIESThe carrying amounts and fair values of financial liabilities are as follows:Estimatedfair value<strong>2012</strong> 2011CarryingvalueEstimatedfair valueUS$ millionAt fair value through profit and lossTrade and other payables (1) 296 296 262 262Derivative financial liabilities (2) 1,081 1,081 1,112 1,112Designated into fair value hedgeBorrowings 13,735 13,425 8,867 8,074Financial liabilities at amortised costTrade and other payables (1) 4,102 4,102 4,637 4,637Borrowings 4,181 4,329(3)5,526 4,799Other non-current liabilities 29 29 55 55Total financial liabilities 23,424 23,262 20,459 18,939(1)Trade and other payables exclude tax and social security and deferred income.(2)Derivative instruments are analysed between those which are ‘Held for trading’ and those designated into hedge relationships in note 25.(3)The fair value of the convertible bond at 31 December 2011 represented the quoted price of the debt and therefore included the portion accounted for in equity.Carryingvalue166 <strong>Anglo</strong> <strong>American</strong> plc <strong>Annual</strong> <strong>Report</strong> <strong>2012</strong>


![English PDF [ 189KB ] - Anglo American](https://img.yumpu.com/50470814/1/184x260/english-pdf-189kb-anglo-american.jpg?quality=85)


![pdf [ 595KB ] - Anglo American](https://img.yumpu.com/49420483/1/184x260/pdf-595kb-anglo-american.jpg?quality=85)
![pdf [ 1.1MB ] - Anglo American](https://img.yumpu.com/49057963/1/190x240/pdf-11mb-anglo-american.jpg?quality=85)

