

Anglo American Annual Report 2012
Anglo American Annual Report 2012
Anglo American Annual Report 2012
- No tags were found...

You also want an ePaper? Increase the reach of your titles
YUMPU automatically turns print PDFs into web optimized ePapers that Google loves.
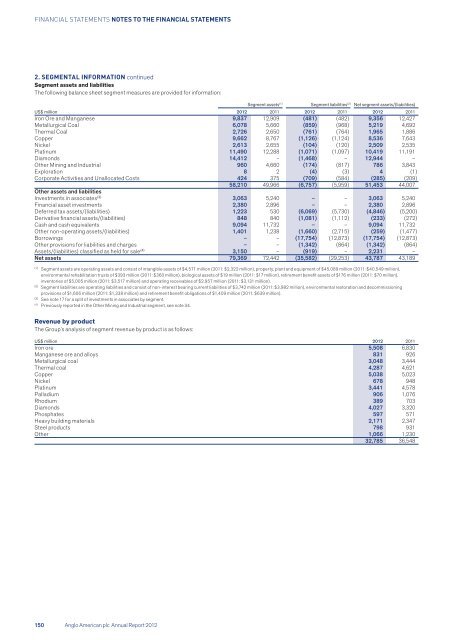
FINANCIAL STATEMENTS NOTES TO THE FINANCIAL STATEMENTS2. SEGMENTAL INFORMATION continuedSegment assets and liabilitiesThe following balance sheet segment measures are provided for information:Segment assets (1) Segment liabilities (2) Net segment assets/(liabilities)US$ million <strong>2012</strong> 2011 <strong>2012</strong> 2011 <strong>2012</strong> 2011Iron Ore and Manganese 9,837 12,909 (481) (482) 9,356 12,427Metallurgical Coal 6,078 5,660 (859) (968) 5,219 4,692Thermal Coal 2,726 2,650 (761) (764) 1,965 1,886Copper 9,662 8,767 (1,126) (1,124) 8,536 7,643Nickel 2,613 2,655 (104) (120) 2,509 2,535Platinum 11,490 12,288 (1,071) (1,097) 10,419 11,191Diamonds 14,412 – (1,468) – 12,944 –Other Mining and Industrial 960 4,660 (174) (817) 786 3,843Exploration 8 2 (4) (3) 4 (1)Corporate Activities and Unallocated Costs 424 375 (709) (584) (285) (209)58,210 49,966 (6,757) (5,959) 51,453 44,007Other assets and liabilitiesInvestments in associates (3) 3,063 5,240 – – 3,063 5,240Financial asset investments 2,380 2,896 – – 2,380 2,896Deferred tax assets/(liabilities) 1,223 530 (6,069) (5,730) (4,846) (5,200)Derivative financial assets/(liabilities) 848 840 (1,081) (1,112) (233) (272)Cash and cash equivalents 9,094 11,732 – – 9,094 11,732Other non-operating assets/(liabilities) 1,401 1,238 (1,660) (2,715) (259) (1,477)Borrowings – – (17,754) (12,873) (17,754) (12,873)Other provisions for liabilities and charges – – (1,342) (864) (1,342) (864)Assets/(liabilities) classified as held for sale (4) 3,150 – (919) – 2,231 –Net assets 79,369 72,442 (35,582) (29,253) 43,787 43,189(1)Segment assets are operating assets and consist of intangible assets of $4,571 million (2011: $2,322 million), property, plant and equipment of $45,089 million (2011: $40,549 million),environmental rehabilitation trusts of $393 million (2011: $360 million), biological assets of $19 million (2011: $17 million), retirement benefit assets of $176 million (2011: $70 million),inventories of $5,005 million (2011: $3,517 million) and operating receivables of $2,957 million (2011: $3,131 million).(2)Segment liabilities are operating liabilities and consist of non-interest bearing current liabilities of $3,742 million (2011: $3,982 million), environmental restoration and decommissioningprovisions of $1,606 million (2011: $1,338 million) and retirement benefit obligations of $1,409 million (2011: $639 million).(3)See note 17 for a split of investments in associates by segment.(4)Previously reported in the Other Mining and Industrial segment, see note 34.Revenue by productThe Group’s analysis of segment revenue by product is as follows:US$ million <strong>2012</strong> 2011Iron ore 5,508 6,830Manganese ore and alloys 831 926Metallurgical coal 3,048 3,444Thermal coal 4,287 4,621Copper 5,038 5,023Nickel 678 948Platinum 3,441 4,578Palladium 906 1,076Rhodium 389 703Diamonds 4,027 3,320Phosphates 597 571Heavy building materials 2,171 2,347Steel products 798 931Other 1,066 1,23032,785 36,548150 <strong>Anglo</strong> <strong>American</strong> plc <strong>Annual</strong> <strong>Report</strong> <strong>2012</strong>


![English PDF [ 189KB ] - Anglo American](https://img.yumpu.com/50470814/1/184x260/english-pdf-189kb-anglo-american.jpg?quality=85)


![pdf [ 595KB ] - Anglo American](https://img.yumpu.com/49420483/1/184x260/pdf-595kb-anglo-american.jpg?quality=85)
![pdf [ 1.1MB ] - Anglo American](https://img.yumpu.com/49057963/1/190x240/pdf-11mb-anglo-american.jpg?quality=85)

