

Anglo American Annual Report 2012
Anglo American Annual Report 2012
Anglo American Annual Report 2012
- No tags were found...

Create successful ePaper yourself
Turn your PDF publications into a flip-book with our unique Google optimized e-Paper software.
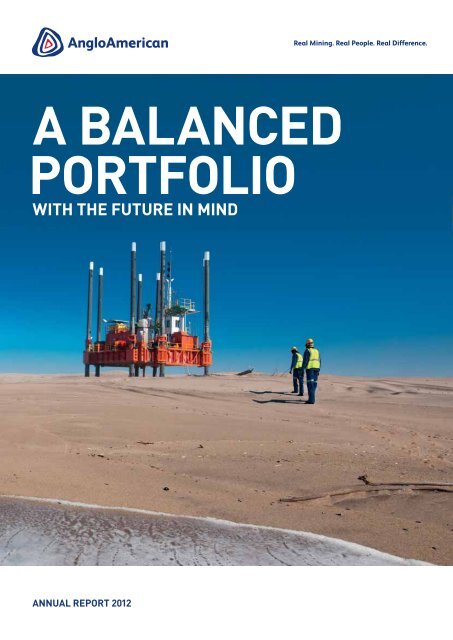
A BALANCEDPORTFOLIOWITH THE FUTURE IN MINDANNUAL REPORT <strong>2012</strong>
WITH SUBHEAD THE FUTURE IN MINDAt Copy <strong>Anglo</strong> to come. <strong>American</strong>, we will achieve our ambitionto be the leading mining company if we makesound decisions that focus on deliveringlong term value. It is these decisions madeby our talented workforce that are driving thebusiness forward with the future in mind.Other sourcesof informationA UNIQUE TRANSACTIONOur acquisition of a further40% interest in De Beerswas a unique opportunityto consolidate control of theworld’s leading diamondcompany. The benefits of ourscale, expertise and financialresources, combined withthe De Beers business andits iconic brand, will enhanceDe Beers’ position acrossthe diamond pipeline andcapture the potentialpresented by a rapidlyevolving diamond market.For more information on this storygo to page 82 in this report01 0203You can find this reportand additional informationabout <strong>Anglo</strong> <strong>American</strong>on our corporate website.Although we havechosen not to producean ‘integrated report’,we have included acomprehensive overviewof our non-financialperformance in this report.More detailed informationon our sustainabilityperformance is providedin our SustainableDevelopment <strong>Report</strong>.This can be found on ourcorporate website.For more information visitwww.angloamerican.com/reportingcentre06050401 Preparation plantassistant Jessica Smithand environmentalistMatt Goddard at thetrain load-out facilityat MetallurgicalCoal’s Capcoal opencut mine.02 Molten platinumbeing poured atPlatinum’s preciousmetals refinery.03 Construction workat Thermal Coal’seMalahleni watertreatment plant.04 Reclaimer operatorBobby Marthinus atthe reclaimer bucketwheel at Kolomelamine’s stack andreclaim yard.05 Arc furnace atCodemin’s nickelsmelter in Brazil.06 Anodes supervisorRicardo Villalon atthe anodes stockpileat the Chagrescopper smelter.CoverDe Beers’ seawalker drill platform,drilling the surfzone on the Atlanticcoast in Namibia.
HeadquartersLondon,United KingdomCorporate andrepresentative officesBeijing, ChinaBelo Horizonte, BrazilBrisbane, AustraliaJohannesburg, South AfricaKinshasa, DRCLuxembourgMaputo, MozambiqueNew Delhi, IndiaRio de Janeiro, BrazilSantiago, ChileSão Paulo, BrazilSingaporeUlan Bator, MongoliaNorth AmericaSouth AmericaAfricaAustralia and AsiaIron Ore and ManganeseMetallurgical CoalThermal CoalCopperNickelPlatinumDiamondsOther Mining and IndustrialUnderlying operating profit$ millionIron Ore and Manganese: 2,949Metallurgical Coal: 405Thermal Coal: 793Copper: 1,687Nickel: 26Platinum: (120)Diamonds: 496Other Mining and Industrial: 337Exploration: (206)Revenue by origin:EuropeGlobal total: $32,785 million$2,235 mCorporate: (203)Total: $6,164 millionNet segment assets$ millionIron Ore and Manganese: 9,356Metallurgical Coal: 5,219Thermal Coal: 1,965Copper: 8,536Nickel: 2,509Platinum: 10,419Diamonds: 12,944Revenue by origin:Australia and AsiaGlobal total: $32,785 million$4,616 mOther Mining and Industrial: 786Exploration: 4Corporate: (285)Total: $51,453 millionRevenue by destination$ millionRevenue by origin:South AfricaGlobal total: $32,785 million$14,592 mSouth Africa 3,115Other Africa 715Brazil 1,093Chile 1,241Other South America 46North America 1,274Europe 8,846China 5,927Incorporating:Australia 340India 2,544Japan 4,049Other Asia 3,595Total 32,785
PERFORMANCE HIGHLIGHTS CONTENTSOverviewSAFEGUARDINGVALUEWITH THE FUTURE IN MINDDIVIDENDS PER SHARECents2008Nil2009Nil201020112528<strong>2012</strong> 32CAPITAL EXPENDITURE$ bn2008200920102011<strong>2012</strong>NET DEBT$ m20082009201020111,374<strong>2012</strong>7,384408,615444.8465.35.0535.85.711,34011,280UNDERLYINGOPERATING PROFIT(2011: $11.1 bn)$6.2 bnUNDERLYING EARNINGS(2011: $6.1 bn)$2.8 bnUNDERLYING EARNINGSPER SHARE(2011: $5.06)$2.26(LOSS)/PROFITATTRIBUTABLE TO EQUITYSHAREHOLDERS(2011: $6.2 bn)$(1.5) bnUnderlying operating profit includesattributable share of associates’ operatingprofit (before attributable share ofassociates’ interest, tax, and non-controllinginterests) and is before special items andremeasurements, unless otherwise stated.See notes 2 and 4 to the financial statementsfor operating profit. For definition of specialitems and remeasurements, see note 5 tothe financial statements. See note 13 to thefinancial statements for the basis ofcalculation of underlying earnings.‘Tonnes’ are metric tons, ‘Mt’ denotesmillion tonnes, ‘kt’ denotes thousand tonnesand ‘koz’ denotes thousand ounces;‘$’ and ‘dollars’ denote US dollars and‘cents’ denotes US cents.Net debt includes related hedges and netcash in disposal groups. See note 31 to thefinancial statements.Overview02 Chairman’s statement04 Marketplace08 Our strategy and business model10 Chief Executive’s statementOperating and financial review12 Key performance indicators (KPIs)14 Strategy in action36 Resources and technology42 Group financial performance48 Risk54 Iron Ore and Manganese60 Metallurgical Coal64 Thermal Coal68 Copper72 Nickel76 Platinum82 Diamonds86 Other Mining and IndustrialGovernance90 Introduction92 The Board94 Executive management96 Role of the Board98 Board in action104 Audit Committee report108 Directors’ remuneration report128 Directors’ report134 Statement of directors’ responsibilitiesFinancial statements136 Responsibility statement137 Independent auditor’s report138 Principal statements142 Notes to the financial statementsOre Reserves and Mineral Resources191 Introduction192 Summary196 Iron Ore199 Manganese200 Coal208 Copper213 Nickel214 Platinum Group Metals217 Diamonds222 Phosphate products223 Niobium224 Reconciliation overview228 Definitions229 GlossaryOther information231 Production statistics235 Quarterly production statistics236 Exchange rates and commodity prices237 Summary by business operation238 Key financial data239 Non-financial data240 Reconciliation of reported earnings242 The business – an overview244 Shareholder informationIBC Other <strong>Anglo</strong> <strong>American</strong> publications<strong>Anglo</strong> <strong>American</strong> plc <strong>Annual</strong> <strong>Report</strong> <strong>2012</strong> 01
OVERVIEW CHAIRMAN’S STATEMENTCHAIRMAN’SSTATEMENTIn a very tough year, we made significantprogress in overcoming the most seriouschallenges to our business, to the benefitof everyone invested, directly or indirectly,in <strong>Anglo</strong> <strong>American</strong>.Sir John Parkerrecognise that over the next two years we will bear a heaviercapital expenditure burden as we seek to complete thedevelopment of Minas-Rio and Grosvenor in Australia, afterwhich we expect capital expenditure to be moderated.We have a substantial potential pipeline of high-quality growthoptions in the most attractive commodities. However, giventhe increased challenges involved in developing large andcomplex greenfield sites, the Board will apply a highlydisciplined approach to the allocation of capital, with smaller,lower-risk brownfield expansion projects more likely to findfavour. Prior to Board approval of large greenfield projectswe will explore the merits of seeking suitable partners.Given theincreasedchallengesinvolved indevelopinglarge andcomplexgreenfieldsites, theBoard willapply a highlydisciplinedapproach tothe allocationof capital.OUR PERFORMANCEIt was a difficult year for the mining industry and<strong>Anglo</strong> <strong>American</strong> encountered its share of challenges.Against a backdrop of a marked economic slowdown inChina, a troubled euro zone and only a sputtering recoveryin the US, the industry faced falling prices, while profitabilitywas further impacted as costs continued to rise well aboveinflation in many countries. In our own business, in SouthAfrica, we had to contend with lengthy illegal industrial actionat our Platinum and Kumba Iron Ore operations – whichultimately had the effect of tipping <strong>Anglo</strong> <strong>American</strong> Platinuminto making a loss for the year. In the first half of the year,we also encountered operational setbacks in our Copperbusiness, where output is now stabilising. At our largestcapital project, the Minas-Rio iron ore project in Brazil, adiversity of problems led to a revised delivery date andcapital-cost increases. This led us to review the carryingvalue of the asset, writing it down by $4 billion (after tax).DIVIDENDS AND CAPITAL ALLOCATIONIn spite of all these challenges affecting cash flow, the Boardwas able to recommend a final dividend of 53 cents per share,giving a rebased total dividend for the year of 85 cents, a 15%increase, reflecting our confidence in the underlying business.This increase completes the rebuilding of our dividend fromzero in 2009, to a new base level competitive with ourdiversified peer group.The three major projects we commissioned in 2011 – BarroAlto nickel, Los Bronces copper expansion and Kolomela ironore – have all been ramping up. At Minas-Rio, however, theinevitable knock-on effect of permitting and other delays haveresulted in the project’s capital expenditure rising to anexpected $8.8 billion, if a Group-held risk contingency of$600 million is consumed, with the first iron ore shipment dueby the end of 2014. I am confident, however, that Minas-Riowill become one of the world’s great high-quality iron oremines, with high potential cash generation and a publishedresource base of well over 5 billion tonnes, a more thanfourfold increase since acquisition.<strong>Anglo</strong> <strong>American</strong>’s objective is to maintain a strong investmentgrade rating – which demands rigorous capital discipline. WeDELIVERING VALUEIn these volatile times, boards have a heightenedresponsibility to ensure that management delivers enduringvalue for shareholders. That is why, following almost a yearof studying various options and social plans, we haveannounced a proposed major restructuring of our Platinumbusiness. We aim to return it to a sustainable profit and a moresecure future for the 45,000 employees who would remain.I am glad to report we have had positive dialogue with theSouth African government, with a joint commitment to worktogether on this restructuring and the finalisation of ourrecovery plans.It is pleasing to report that, following the dispute with theChilean state copper producer, Codelco, we were able toretain majority control of <strong>Anglo</strong> <strong>American</strong> Sur and to establisha new relationship that positions us to build a strong futurefor our business in Chile. We were also able to generate$2.3 billion of incremental proceeds for shareholderscompared to the original option price.Our acquisition from the Oppenheimer family of its 40%shareholding in De Beers now gives shareholders greaterexposure to the world’s No. 1 diamond company. We believeDe Beers is well positioned to capitalise on the positivefundamentals in diamonds, with the supply of gem diamondslikely to fall well short of demand over the long term.SAFETY AND SUSTAINABLE DEVELOPMENTThe number of people who lost their lives on companybusiness fell to 13; sadly, this is 13 too many. Our lost-timeinjury frequency rate, which had reached a plateau in recentyears, also resumed a downward trend. Overall, duringCynthia Carroll’s six-year watch, on a like-for-like basis, theannual number of deaths Group-wide fell by half. This stepchange in performance is great testimony to Cynthia’ssafety leadership, as well as the commitment of her seniormanagement team. Their tireless endeavours in leading thesafety agenda have brought about real and lasting change inthe way we approach our drive for zero harm. I know ourincoming chief executive Mark Cutifani, during whose watchat <strong>Anglo</strong>Gold Ashanti, over a similar timeframe, the company’ssafety record improved significantly, is also determined to takethe lead on this most fundamental of issues.As a company, <strong>Anglo</strong> <strong>American</strong> takes climate-changemitigation and water management particularly seriously –with targets for these included in the performance contracts02 <strong>Anglo</strong> <strong>American</strong> plc <strong>Annual</strong> <strong>Report</strong> <strong>2012</strong>
OverviewAN EVALUATION OF THE BOARD BY ANEXTERNAL FACILITATOR, WITH NO PRIORRELATIONSHIP WITH ANGLO AMERICAN,WAS COMPLETED IN FEBRUARY <strong>2012</strong>.For more information turn to page 96REPRESENTATION OF WOMENON THE BOARD27%For more information turn to page 91of our business unit CEOs. It is pleasing, therefore, that ourapproach to sustainable development continues to receiveglobal recognition. At the Quellaveco copper project inPeru – historically, a challenging environment in which toconduct mining operations – we successfully concludeda community ‘dialogue table’; this resulted in groundbreakingagreements that satisfy our host communitieson water use, the environment and social responsibility. In<strong>2012</strong>, <strong>Anglo</strong> <strong>American</strong> was recognised for the 10th yearrunning for excellence in sustainability by the Dow JonesSustainability Index, achieving the highest ranking in themining industry. We were also awarded a platinum rankingin the <strong>2012</strong> Business in the Community CorporateResponsibility Index, the UK’s leading voluntary benchmarkof corporate responsibility – the only mining group to secureplatinum status.GOVERNANCEOver the past few years, governance pressures on listedcompanies have been growing in intensity. Shareholders,institutional and individual alike, have sought to holdunderperforming managements and boards to account.In the 3½ years I have been chairman of your company,therefore, I have sought to refresh and strengthen theBoard by bringing in members with a range of skill-setsand experiences that can add value to our business andmaintain capital discipline. It is in that light that we appointedAnne Stevens in May <strong>2012</strong>. Anne is an engineer withextensive industrial experience, including operating in arange of South <strong>American</strong> countries in which we are present.I also wish to take this opportunity to thank Dr MamphelaRamphele, who stepped down in July, for the wealth ofexperience and insight she brought to the Board’s affairs.Mamphela, who was a key figure in South Africa’s strugglefor democracy, later had a distinguished career, includingserving as vice-chancellor of the University of Cape Townand as a managing director of the World Bank.Peter Woicke will also be standing down from the Board at theforthcoming AGM. He has been a director since 2006 andchairman of the Safety and Sustainable (S&SD) Committeefor the past three years. Peter has brought a wealth ofexperience and knowledge about development in emergingeconomies to our proceedings and has ensured that <strong>Anglo</strong><strong>American</strong> remains at the forefront of the major sustainabilityissues facing our industry. We are indeed grateful for hisleadership in this important area of our operations.We are fortunate to have Jack Thompson’s extensivemining experience and knowledge of safety to take overas chairman of the S&SD Committee and to build onPeter Woicke’s excellent work.The Board is also proposing the appointment of Dr ByronGrote as a non-executive director at the forthcoming AGM.Byron has more than three decades’ experience in the naturalresources sector, including nine years as chief financial officerof BP. He will be retiring from BP and stepping down from theBP board in April. It is intended that Byron will, after a period ofinduction, take over the chairmanship of the Audit Committeefrom David Challen, who has rendered outstanding service inthis role. I am glad that David, whose independence is not indoubt, has agreed, given the extensive changes to Boardmembership since late 2009, to serve for at least anotheryear as the senior independent non-executive director.In terms of the Board’s composition, the biggest change,of course, was Cynthia Carroll’s decision in October to stepdown as chief executive and from the Board, in April, withthe agreement of the Board. Cynthia’s leadership has had atransformational impact on <strong>Anglo</strong> <strong>American</strong>. She developeda clear strategy and created a strong and unified culture anda streamlined organisation.Cynthia lived out <strong>Anglo</strong> <strong>American</strong>’s values to the full and herlegacy includes, among many other things, a step-changeimprovement in safety, sustainability and the quality ofour dialogue with governments, communities and otherstakeholders around the world. As a Board, we not onlythank her but wish her all success and good wishes in theyears ahead.I led the Board’s global search to identify the best possiblecandidate for the role of chief executive. Mark Cutifani wasthe Board’s unanimous choice to succeed Cynthia, and hewill take up his post on 3 April 2013. Mark comes to us from<strong>Anglo</strong>Gold Ashanti, where he led the successful restructuringand development of its business. He is an experiencedlisted-company chief executive who has a focus on creatingvalue, and a seasoned miner, with broad experience of miningoperations and projects across a wide range of commoditiesand geographies, including South Africa and the Americas, aswell as his native Australia. He is a highly respected leader inthe global mining industry, with values strongly aligned tothose of <strong>Anglo</strong> <strong>American</strong>.In terms of enhancing the Board’s contribution to<strong>Anglo</strong> <strong>American</strong>’s affairs, during the year the Board joinedthe company’s most senior executives in an internal strategyforum, and will do so again in June 2013. In addition, theresults of an external effectiveness review of the Board, whichI commissioned in 2011, were presented to the Board in<strong>2012</strong>. The results of the review, together with details of all ofour governance arrangements, can be found in the CorporateGovernance section (pages 90–134) of this report.OUTLOOKDuring <strong>2012</strong> there were significant macroeconomic policychanges, which should support a stronger recovery in 2013and beyond. There are now clear signs of an upturn in UShousing, which should reinforce a broader economic recoveryhelped by ultra-loose monetary policy. In China, theauthorities have also eased policy to stimulate faster growth.But the country’s newly installed leadership is mindful of theneed to rebalance the economy, which will restrain growthover the next few years. In Europe and Japan, activity hasbeen weak, but there are signs of improvement and changesin policy should boost growth in 2013. In the medium term,we see continuing robust demand for industrial commoditiesas emerging economies continue to industrialise andadvanced economies invest in upgrading their infrastructure.Sir John ParkerChairmanThe numberof people wholost their liveson companybusiness fellto 13, whileour lost-timeinjury frequencyrate, whichhad reacheda plateau inrecent years,also resumeda downwardtrend.For more informationturn to page 27<strong>Anglo</strong> <strong>American</strong> plc <strong>Annual</strong> <strong>Report</strong> <strong>2012</strong> 03
OVERVIEW MARKETPLACEA BRIGHTER OUTLOOKFOR OUR KEY COMMODITIESTHE ECONOMYECONOMIC SLOWDOWNThe world economy slowed in <strong>2012</strong>.According to the IMF, global real GDPincreased by 3¼%, following 4%in 2011 and 5% in 2010. There wasbroad-based weakness, with bothadvanced and developing economiesexperiencing lower growth. Inaggregate, real GDP in the advancedeconomies rose by 1¼% in <strong>2012</strong>,after 1½% in 2011 and 3% in 2010.Emerging and developing economiesrecorded aggregate real GDP growthof 5% in <strong>2012</strong>, down from 6¼%in 2011 and 7½% in 2010. The growthin world trade slowed more sharply, to2¾% in <strong>2012</strong>, after 6% in 2011 and12½% in 2010.In spite of the fragile global environment,the US economy grew slightly morestrongly in <strong>2012</strong>. The housing marketOECD’s long-term GDP projectionsReal GDP, at 2005 PPP, annual average % changeChinaIndiaWorldS AfricaUSBrazilOECDEuro zoneJapan0 2 4 6 8 10 121997–07<strong>2012</strong>–202020–30Source: OECDimproved significantly through theyear and rising sales and pricesencouraged a recovery in new housingstarts. The labour market alsoimproved, though more fitfully. Duringthe year, the corporate sector scaledback its investment spending owing toincreasing uncertainty about the pathof fiscal policy in 2013. This restrainedthe economy’s growth rate to 2¼% in<strong>2012</strong>. The Federal Reserve respondedto the economy’s modest growth ratewith the implementation of openendedquantitative easing (‘QE3’)in the autumn.The European economy weakenedsignificantly in <strong>2012</strong>. In the euro zone,real GDP contracted by ½% followinggrowth of 1½% in 2011. Economicactivity was particularly weak in theheavily indebted countries that arereceiving financial help from the EUand the IMF. But there were also signsof more broad-based weakness asGermany and France slowed through<strong>2012</strong>. Three factors have underminedgrowth. First, the debt crisis hassignificantly increased risk premiumson European financial assets. Second,the banking system remains impairedin many economies. Third, manygovernments are implementingmulti-year fiscal consolidation plans.The Chinese economy slowed abruptlyin <strong>2012</strong>. Real GDP grew by 7¾%,following 9¼% in 2011 and 10½%in 2010. The slowdown extended tothe third quarter, reflecting two mainfactors. First, there was significantweakness in China’s exports to theUS and Europe. Unsurprisingly, in thelight of Europe’s problems, China’sexports to the EU fell during <strong>2012</strong>.Second, the downturn in the propertymarket undermined domesticdemand. The authorities respondedto the downturn with modest policystimulus. Policymakers broughtforward some spending oninfrastructure and the People’s Bankof China eased monetary conditionswith several cuts in its requiredreserve ratio for large banks. Therenminbi depreciated a little,supporting exports. By the end of theyear, GDP growth had recovered.Other large emerging economiesexperienced notably weaker growthin <strong>2012</strong>. Concerns about stubborninflation and government economicreforms weighed on India’s growth.We expect agradualstrengtheningof economicactivity in 2013,with theemergingeconomiesexpected tolead theimprovement.World trade andindustrial production% change, latest three months onprevious three months1050-5-10-152005TradeIndustrial productionSource: CPB Netherlands<strong>2012</strong>Brazil’s economy was disappointinglyweak in spite of looser macroeconomicpolicies and currencydepreciation. Industrial unrest addedto the weakness of South Africa’seconomy late in <strong>2012</strong>.PROSPECTSWe expect a gradual strengtheningof economic activity in 2013. GlobalGDP growth should be around 3½%,slightly below the longer term trendrate, with the emerging economiesexpected to lead the improvement.China’s growth rate is likely to recoverto 8% in 2013, as export marketsstabilise and domestic demandstrengthens. India, Brazil and SouthAfrica should pick up in response toimproving external conditions, lowerinflation and looser domestic policy.The recovery will be patchier in theadvanced economies. The EuropeanCentral Bank has headed off the threatof a euro breakdown, removing oneof the biggest downside risks. Butmonetary and fiscal policy settingswill not stimulate economic growth.The recovery in Europe looks asthough it will be painfully slow in 2013.04 <strong>Anglo</strong> <strong>American</strong> plc <strong>Annual</strong> <strong>Report</strong> <strong>2012</strong>
OverviewIndexed <strong>2012</strong> commodity prices (1)140130The US economy also faces amore challenging domestic policyenvironment. The recent debateabout the ‘fiscal cliff’ has exposed theabsence of a credible medium termplan to reduce the US’ federal budgetdeficit and arrest the rise in debt. Incoming years, US policymakers willhave to balance the need for significantfiscal retrenchment against providingsupport for economic activity in theshort term. This implies a prolongedperiod of monetary accommodationfrom the Federal Reserve andsustained dollar weakness.In the medium term, we expect the USto return to its underlying trend growthof around 2½–3% a year. Europe’sgrowth rate will remain more anaemic.But economic growth should remainmore robust in the main emergingeconomies. There is considerablescope for further catch-up growth,especially in China and India. ButChina’s increasing scale implies thenew leadership must implementreforms to rebalance growth graduallyaway from investment towardsconsumption. The next stage of thecountry’s urbanisation will take placein the western inland provinces, whilegrowth in coastal provinces shouldslow modestly in the medium term.COMMODITYMARKETSIn an increasingly uncertain macroeconomicclimate, <strong>2012</strong> was a yearof commodity price weakness andheightened volatility. Averageannual prices were down for all of<strong>Anglo</strong> <strong>American</strong>’s key commodities,with falls ranging from 10% for copperto 35% for hard coking coal.Price weakness in <strong>2012</strong> was acontinuation of a trend that emergedin the second half of 2011. Althoughannual average prices were downacross the Group’s portfolio, a numberof commodities spent much of the yearat prices equal to or above those seenin December 2011. In this respect therewas a marked contrast in performancebetween the precious and basemetals and the bulk commodities,with platinum and copper tradingabove December 2011 price levels formuch of <strong>2012</strong>, while bulk commodityprices weakened materially.Price Index, December 2011 = 100120110100908070605040Dec 2011 Feb <strong>2012</strong> Apr <strong>2012</strong> Jun <strong>2012</strong>Aug <strong>2012</strong>Oct <strong>2012</strong>Dec <strong>2012</strong>Iron Ore (FOB Aus)CopperMetallurgical CoalNickelThermal CoalPlatinum(1)Monthly average pricesSource: <strong>Anglo</strong> <strong>American</strong> Commodity ResearchIn anincreasinglyuncertainmacroeconomicclimate, <strong>2012</strong>was a year ofcommodityprice weaknessand heightenedvolatility.The platinum price increased by8% during <strong>2012</strong>, with higher pricesreflecting not only the supportprovided by South African supplydisruptions, but also the relativelypoor platinum pricing environmentseen in late 2011. The price movedsharply upwards in both the first andthird quarters of <strong>2012</strong>, in response toindustrial action in South Africa, withthe resulting losses in output helpingto offset the impact of a generallyfragile demand environment, mostnotably in the European auto sector.The copper price also rose by 8%,underpinned by stockpiling of cathodesin Chinese bonded warehouses, which‘sterilised’ a considerable amount ofmetal. Estimated global stocks ofcopper are still well below those ofother base metals and also somewhatbelow ‘normal’ working levels, whilevisible terminal market stocks arealso reasonably low. Investors andspeculators have therefore beenreluctant to ‘short’ the coppermarket in the light of the relativelylow levels of readily available stocks,the continued mine disruptions andsupply under performance.In <strong>2012</strong>, the fall in the prices of bulkcommodities, notably those used forsteel making, was significant. <strong>Annual</strong>average steel prices were down by16% (HRC FOB Eur). However, <strong>2012</strong>iron ore and hard coking coal priceswere 24% and 35% lower respectively,while molybdenum, which is alsoused in steels, was down by 17%. Theslowdown in Chinese demand, whichhas been magnified by destockingactivity, has been a principal factor inthese markets and, with the run-downof inventories having run its course andeven reversed, prices of both beganto improve from October, and, byDecember, iron ore prices were backto December 2011 levels.Thermal coal prices also declinedmarkedly for most of <strong>2012</strong>, but beganto improve during Q4 following theclosure of some US supply and anincrease in gas prices. Europeanprices continued to be dampenedby coal displaced by gas, while Asianofftake has been muted. Globally,supply cutbacks have been limitedand the near term outlook is forcontinued supply additions fromIndonesia, exerting a drag effecton any price recovery.In 2013, the easing of macroeconomicpolicy globally, renewed infrastructurespending in China and strongermanufacturing output should helpsupport commodity demand growth.Coupled with price-induced projectdeferral (constrained capex) andsupply curtailments, this should tightenmarkets, thereby providing someprice support where there have beenrecent lows. This expectation issupported by the analysts’ consensus,which forecasts 2013 average pricesabove current levels for most of<strong>Anglo</strong> <strong>American</strong>’s key commodities.<strong>Anglo</strong> <strong>American</strong> plc <strong>Annual</strong> <strong>Report</strong> <strong>2012</strong> 05
OVERVIEW MARKETPLACEWELL PLACED FOR ALL STAGESOF THE ECONOMIC CYCLE<strong>Anglo</strong> <strong>American</strong>’s currentportfolio is uniquelydiversified, with materialexposure to commoditiesthat are key to the continuedearly-stage industrialisationof emerging economies,such as metallurgical coaland iron ore, as well ashaving exposure to midandlate-cycle commodities,such as copper, nickel,platinum and diamonds.EARLY STAGECreating the building blocks of the urban environmentAs economies start to develop and grow there is a need to expandinfrastructure, construct residential and commercial buildings andbuild port capacity for the inevitable rise in import and export activity.60 %INCREASEIN GLOBALINFRASTRUCTURESPEND REQUIREDBY 2030Over the past decade, China and other emergingeconomies have experienced an unprecedentedphase of industrialisation and urbanisation. Inspite of the current challenging global economicenvironment, this growth is set to continue.As the populations of the cities in these emergingeconomies grow, so too do their incomes anddesire to spend.IRON OREMETALLURGICALCOALTHERMALCOALMANGANESELower GDP/capita600 GWOF THERMAL COALPOWER GENERATIONCAPACITY TO BE ADDEDBY CHINA OVER NEXT17 YEARS70%OF CHINESE POPULATIONEXPECTED TO LIVE INURBAN AREAS BY 2030VS. C. 50% TODAYSources:NBS, UN, McKinsey Global Institute, FAO, NDRC, ICA, De Beers06 <strong>Anglo</strong> <strong>American</strong> plc <strong>Annual</strong> <strong>Report</strong> <strong>2012</strong>
OverviewMID STAGEThe rise of the consuming classAs developing economies mature, populations move to cities andstart to enjoy a higher disposable income and a more comfortablestandard of living. Households purchase ‘white goods’ and mobilephone communication becomes widespread. Diets shift from beinggrain based to being high in protein.LATE STAGEAspiring to an affluent lifestyleAs purchasing power increases, so too does the appetite for ‘luxury’goods and services, including cars, jewellery, advanced technologicalgoods and travelling for leisure.7,000 31 %METRO LINESWILL BE BUILTIN 40 CHINESECITIES BY 2040,WITH EACH KMREQUIRING107 TONNESOF COPPERFIRST-TIMEBRIDES IN CHINAWHO RECEIVEA DIAMONDENGAGEMENTRING – A CAGR *OF ALMOST 24%IN 16 YEARSCOPPER NICKEL PGMsNIOBIUM PHOSPHATES DIAMONDSHigher GDP/capita1 billion40 Mt1.7 billion60 millionPEOPLE WHO AREEXPECTED TO ENTERTHE GLOBAL ‘CONSUMINGCLASS’ BY 2025OF EXPECTED FERTILISERNUTRIENT DEMANDGROWTH (C. 23%) OVERTHE NEXT DECADE ASDIETS CHANGE INEMERGING ECONOMIESGLOBAL CAR FLEET TODOUBLE TO 1.7 BILLIONBY 2030HOUSEHOLDS INEMERGING ECONOMIESEXPECTED TO BE IN THEHIGH INCOME BRACKET(>$70,000 PA) BY 2025* Compound <strong>Annual</strong> Growth Rate<strong>Anglo</strong> <strong>American</strong> plc <strong>Annual</strong> <strong>Report</strong> <strong>2012</strong> 07
OVERVIEW OUR STRATEGY AND BUSINESS MODELOUR STRATEGY ANDBUSINESS MODELINVESTINGWorld class assetsin the most attractivecommoditiesORGANISINGEfficientlyandeffectivelyBECOMINGTHE LEADINGMININGCOMPANYOPERATINGSafely,sustainablyandresponsiblyFINDSECUREEMPLOYINGThe best peopleOur exploration teams discoverore deposits in a safe andresponsible way to replenishthe reserves that underpin ourfuture success.Gaining and maintainingour social and legal licenceto operate, through openand honest engagementwith our stakeholders, iscritical to the sustainabilityof our business.<strong>Anglo</strong> <strong>American</strong> aims to become the leading global miningcompany – the investment, the partner and the employerof choice – through the operational excellence of worldclass assets in the most attractive commodities, andthrough a resolute commitment to the highest standardsof safe and sustainable mining.As our business model illustrates, mining is only part of the story.Our sector-leading exploration teams strive to find the resourceswe will mine in the future and we engage with a broad range ofstakeholders – from governments to local communities andNGOs – to secure our right to mine those resources. Many of thecommodities we mine are processed and refined further beforewe apply our market knowledge to deliver a quality product ourcustomers value.We believe we can achieve our aim of becoming the leadingglobal mining company through our four strategic elements:Investing in world class assets in those commodities thatwe believe deliver the best returns through the economiccycle and over the long term – namely, iron ore, metallurgicalcoal, thermal coal, copper, nickel, platinum and diamonds.Organising efficiently and effectively to outperform ourcompetition throughout our value chain.Operating safely, sustainably and responsibly, in the beliefnot only that this is fundamental to our licence to operate,but also that this is an increasingly important source ofcompetitive advantage. The safety of our people is our keycore value and we are relentless in striving to achieve ourgoal of zero harm.Employing the best people. We recognise that attracting,developing and retaining the best talent is essential toachieving our ambition.Our strategic elements are put into action across ourbusiness model.08 <strong>Anglo</strong> <strong>American</strong> plc <strong>Annual</strong> <strong>Report</strong> <strong>2012</strong>OPERATINGThe LT-SQUID has beenemployed by our field teams tohelp search for so-called blinddeposits that have no visibleexpression on the groundsurface. It has revolutionisedhow we look at and model thepicture beneath the groundsurface, particularly at depth.Go to page 41 for moreinformation on this storyINVESTINGDuring the year, outstandinginjunctions were lifted at ourMinas-Rio iron ore project inBrazil. Following a detailedreview, capital expenditure hasincreased to $8.8 billion andfirst ore on ship is expected atthe end of 2014.Go to page 58 for moreinformation on this storyOPERATINGSecuring our licence to buildand operate a mine dependson winning the trust of manystakeholders. We participatedin an extensive, structured‘dialogue table’ with local andnational stakeholders in ourQuellaveco copper project inPeru, which helped us to reachagreement with the localcommunity and regionalgovernment to develop theproject.Go to page 22 for moreinformation on this story
OverviewMINE PROCESS MOVE SELLWe apply more than 95 yearsof opencast and deep-levelmining experience along withunique in-house technologicalexpertise to extract mineralresources in the safest, mostefficient way.We generate extra value byprocessing and refining manyof our commodities.Whether providing innovativehaulage solutions within amine, or coordinating globalcargo deliveries, we offerefficient and effectivetransport of our commodities.We collaborate with ourcustomers around the worldto tailor products to theirspecific needs.INVESTINGORGANISINGORGANISINGORGANISINGOur Kolomela mine,commissioned five monthsahead of schedule in 2011,produced 8.5 Mt of iron orein <strong>2012</strong>, above expectationsof 4–5 Mt.Go to page 14 for moreinformation on this storyEMPLOYINGThe technical team at ourPhosphates businessproposed an innovativesolution to re-use phosphatewaste in the fertiliserproduction process. Thetechnique was put into fullscaleproduction during <strong>2012</strong>,with 40% of phosphate wastebeing re-used in the year,resulting in lower productioncosts and a significantenvironmental benefit.Go to page 87 for moreinformation on this storyIn September <strong>2012</strong>, ourrecently installed flexibleconveyor train produced116,708 tonnes of thermal coalat Greenside mine, achievingthe highest monthly coaloutput ever recorded outsidethe US.Go to page 36 for moreinformation on this storyDuring <strong>2012</strong>, we opened ournew sales and marketing hubin Singapore, enabling us to becloser to our customers in theAsia-Pacific market and bemore agile and responsive totheir needs.Go to page 18 for moreinformation on this storyOPERATINGOPERATINGOur Nickel business isaddressing the shortageof qualified people at itsoperations in Brazil by tailoringa trainee graduate programmeto develop the businessesengineers and leaders ofthe future. On successfulcompletion of the programme,the trainees will be readyto start their career at<strong>Anglo</strong> <strong>American</strong>.Go to page 73 for moreinformation on this storyFollowing completion of theLos Bronces expansion inChile, our Copper businessimplemented a waterrecirculation system to helpreduce the water requirementin an already stretchedcatchment area.Go to page 69 for moreinformation on this storyWorking with the aerospaceindustry, Sishen developeda unique collision avoidancesystem for mining vehicles,dramatically reducing thenumber of vehicle-relatedaccidents at the mine.Go to page 55 for moreinformation on this story<strong>Anglo</strong> <strong>American</strong> plc <strong>Annual</strong> <strong>Report</strong> <strong>2012</strong> 09
OVERVIEW CHIEF EXECUTIVE’S STATEMENTCHIEF EXECUTIVE’SSTATEMENTCynthia CarrollUNDERLYING OPERATING PROFIT(2011: $11.1 bn)$6.2 bnFor more informationturn to page 42FINAL DIVIDEND PER SHARE(2011: 46 cents)53 centsAs a result of markedly weakercommodity prices, ongoingcost pressures and an operatingloss in our Platinum business,<strong>Anglo</strong> <strong>American</strong> reported anunderlying operating profit of$6.2 billion, a 44% decrease.Underlying EBITDA decreased by35% to $8.7 billion and underlyingearnings decreased by 54% to$2.8 billion.Our safety performance has alwaysbeen my first priority and our effortscontinue to build on the progress wehave made since 2006, both in termsof lives lost and lost time injuriessustained. I am deeply saddened that13 of our colleagues lost their lives in<strong>2012</strong> – a constant reminder that wemust persevere to achieve zero harm.<strong>Anglo</strong> <strong>American</strong> continued its drivefor strong operational performancethroughout <strong>2012</strong> in an environmentof tough macroeconomic headwindsand a number of industry-wideand company-specific challenges.Record volumes of metallurgical coal,achieving benchmark equipmentperformance levels, and of iron oreand increased volumes of exportthermal coal and copper helpedoffset the impact of illegal industrialaction, declining grades and higherwaste stripping.The new mining operationsand expansions delivered andcommissioned during 2011contributed to production growth andgenerated $1.2 billion of underlyingoperating profit. The Los Broncesexpansion contributed 196,100 tonnesof copper in <strong>2012</strong> and has achievedfull ramp up since August <strong>2012</strong>, whileKumba’s Kolomela mine exceededexpectations by producing 8.5 milliontonnes for the year – both considerableachievements – while we have beenslowly ramping up Barro Alto.Beyond organic growth, we havecompleted our acquisition of theOppenheimer family’s 40% interestin De Beers, taking our holding to85%. In Chile, our joint ownership of<strong>Anglo</strong> <strong>American</strong> Sur (AA Sur) withCodelco, Mitsubishi and Mitsui, whilewe retain control of the business, firmlyaligns our interests in one of the mostexciting producing and prospectivecopper orebodies in the world – theLos Bronces district. During the year,we also increased our shareholding inKumba Iron Ore, lifting our ownershipby 4.5% to 69.7%, reflecting our viewon the quality of the business and itshighly attractive performance andgrowth profile.Our divestment programme hasgenerated proceeds as announcedof $4 billion on a debt and cash freebasis, which excludes $7.4 billion cashgenerated from the sale of 49.9% ofAA Sur. In line with our divestmentprogramme of non-core businesses asset out in October 2009, I am delightedthat Tarmac’s UK joint venture withLafarge was completed in January2013, creating a leading UKconstruction materials companywith significant synergies expected.We are focused on deliveringshareholder value and returns throughthe cycle by maintaining a prudentand disciplined approach to managingour businesses and capital allocation.Despite the macroeconomicheadwinds and likely sustained highercapital and operating cost environmentfor the industry, we are committed toreturning cash to shareholders andhave recommended an increase to ourfinal dividend of 15% to 53 cents pershare, bringing total dividends for theyear to 85 cents per share, a 15%The new miningoperations andexpansionsdelivered andcommissionedduring 2011contributedto productiongrowth andgenerated$1.2 billionof underlyingoperating profit.0110 <strong>Anglo</strong> <strong>American</strong> plc <strong>Annual</strong> <strong>Report</strong> <strong>2012</strong>
Overview01 At Thermal coal’s 02 Cleaning copperHighveld hospital inanodes in the tank houseMpumalanga province in at Los Bronces in Chile.South Africa, Sister EvahMolefe takes a sputumsample to test forTB from Kleinkopjecolliery plant operatorSipho Mhlabane.03 As part of the Board’svisit to Minas-Rio inOctober, the directorsvisited the CRCA(Cultural andEnvironment Centre),which houses specialistinformation in the fieldsof archaeology,biodiversity and water.04 Specialist asset strategyengineer SylvesterHennessy monitoringdata at MetallurgicalCoal’s offices inBrisbane, Australia.increase. This reflects our confidencein the underlying business andcompletes the reinstatement journeyto rebase our dividends to becompetitive with our diversified peers.We recorded impairmentstotalling $4.6 billion (post-tax) inrelation to Minas-Rio and a numberof platinum projects that areuneconomical, which is disappointing.In Platinum, we completed our reviewin January 2013 and have put forwardproposals to create a sustainable,competitive and profitable business.We, of course, regret the potentialimpact on jobs and communities andhave designed an extensive social planto more than offset any such impact. InBrazil, Minas-Rio is a world class ironore project of rare magnitude andquality, representing one of the world’slargest undeveloped resources. Thepublished resource has increasedmore than fourfold since acquisition,of which we have subsequentlyconverted 1.45 billion tonnes to OreReserves; we anticipate increases inthe resource confidence and furtherconversion of resources to reservesthrough our ongoing infill drillingprogramme. Despite the difficultieswe have faced that have caused asignificant increase in capital02expenditure, we continue to beconfident of the medium and longterm attractiveness and strategicpositioning of Minas-Rio and weremain committed to the project.The first phase of the project will beginits ramp up at the end of 2014, withoperating costs expected to be highlycompetitive in the first quartile of theFOB cash cost curve, generatingsignificant free cash flow for manydecades to come.We continue to sequence investmentby prioritising capital to commoditieswith the most attractive marketdynamics and projects with the lowestexecution risks. The 5 Mtpa Grosvenormetallurgical coal project in Australiais under way and on schedule while,in Peru, successful completion of ourcommunity dialogue process at theQuellaveco copper project will allow usto target submission to the Board forapproval in 2013.Managing the social, economicand environmental impacts of ouroperations is essential to our success.Our approach to sustainability is akey differentiator for <strong>Anglo</strong> <strong>American</strong>,is fundamental to the way we dobusiness and is embedded ineverything we do.In Platinum,we completedour reviewand haveput forwardproposalsto create asustainable,competitiveand profitablebusiness.0304Together with the safety andwell-being of employees, our primarysustainability issues are adapting toclimate change, securing access towater and energy, and managingrelationships with stakeholders,particularly communities. During <strong>2012</strong>,we made good progress implementingour long term water and energystrategies. To date, more than 70% ofour operational water requirementsare met by recycling/re-using water.In support of our commitments toprotect and enhance the health of ourpeople, contractors and communities,we are extending our industry-leadinghealth and wellness programmes,which include HIV/AIDS and TBtreatment and care, to long termcontract employees in South Africa.Looking ahead, recent months havebrought a degree of renewed optimismto the economic prospects. WhileEuropean and Japanese economicactivity remains weak, recent policychanges ought to stimulate growth in2013. Alongside a continuing recoveryin the US, we expect robust growth inthe major emerging economies –especially China and India – as theybenefit from continuing urbanisation.Rising living standards and anexpanding middle class should supportdemand for our products across ourdiversified mix.I step down from my role as chiefexecutive after six years knowing that<strong>Anglo</strong> <strong>American</strong> is a safer place towork, with a clear strategy and a muchchanged culture of performance.There is no doubt in my mind that<strong>Anglo</strong> <strong>American</strong>’s people and assetbase are unmatched in the industryand I wish my successor, Mark Cutifani,every success in leading this greatcompany. I sincerely thank theBoard of directors, my executivemanagement team and all ouremployees for their support andrelentless effort since 2007.Cynthia CarrollChief Executive<strong>Anglo</strong> <strong>American</strong> plc <strong>Annual</strong> <strong>Report</strong> <strong>2012</strong> 11
OPERATING AND FINANCIAL REVIEW KEY PERFORMANCE INDICATORSMEASUREMENTAND TARGETSStrategic elementsINVESTINGIn world class assets in themost attractive commoditiesTurn to page 14ORGANISINGEfficiently and effectivelyTurn to page 18OPERATING (1)Safely, sustainablyand responsiblyTurn to page 22KPI targetsTotal shareholder return (TSR)Share price growth plus dividends reinvestedover the performance period. A performanceperiod of three years is used and TSR iscalculated annuallyReturn on capital employed (ROCE)Total underlying operating profit beforeimpairments for the year divided by the averagetotal capital less other investments and adjustedfor impairmentsIn two vital areas of our business – assetoptimisation (AO) and supply chain – we havebeaten our own expectations. By the end of 2011,we had exceeded our targets for both AO andsupply chain, each of which delivered more than$1 billion from core businesses since 2009. As aresult, we no longer report against Group-wideAO and supply chain targetsWork-related fatal injuryfrequency rate (FIFR)FIFR is calculated as the number of fatalinjuries to employees or contractors per200,000 hours workedLost-time injury frequency rate (LTIFR)The number of lost-time injuries (LTIs) per200,000 hours worked. An LTI is an occupationalinjury which renders the person unable toperform his/her regular duties for one full shiftor more the day after the injury was incurred,whether a scheduled workday or notEnergy consumptionMeasured in gigajoules (GJ)Greenhouse gas (GHG) emissionsMeasured in tonnes of CO 2equivalent emissionsCapital projects and investmentOptimise the pipeline of projects and ensurethat new capital is only committed to projectsthat deliver the best value to the Group on a riskadjusted net present value basisUnderlying earnings per shareUnderlying earnings are net profit attributableto equity shareholders, before special itemsand remeasurementsWe do, however, continue to deliver on bothprogrammes and examples of how our operationsare achieving and surpassing ‘industry benchmark’performance are detailed throughout this report.Further details on the AO and supply chainfunctions can be found on pages 18–21Total water useTotal water use includes only water used forprimary activities, measured in million m 3Corporate social investmentSocial investment as defined by the LondonBenchmarking Group includes donations, gifts inkind and staff time for administering communityprogrammes and volunteering in company timeand is shown as a percentage of profit before taxEnterprise developmentNumber of companies supported and numberof jobs sustained by companies supported by<strong>Anglo</strong> <strong>American</strong> enterprise development initiativesVoluntary HIV counselling and testing (VCT) (2)Percentage of employees in southern Africaundertaking voluntary annual HIV tests withcompulsory counselling and supportEMPLOYING (1)The best peopleTurn to page 32Voluntary labour turnoverNumber of permanent employee resignationsas a percentage of total permanent employeesGender diversityPercentage of women, and female managers,employed by the Group(1)With the exception of corporate social investment, which includes the results of De Beers from the date of acquisition,the results and targets for the Operating and Employing strategic elements include wholly owned subsidiaries andjoint ventures over which <strong>Anglo</strong> <strong>American</strong> has management control, and does not include De Beers or other majornon-managed operations such as Collahuasi, Cerrejón and Samancor. In addition, results for the Employing strategicelement exclude OMI – non-core operations.(2)<strong>2012</strong> HIV/AIDS statistics exclude Scaw Metals South Africa.12 <strong>Anglo</strong> <strong>American</strong> plc <strong>Annual</strong> <strong>Report</strong> <strong>2012</strong>
Results and targetsReturn on capital employed (ROCE)<strong>2012</strong>201113.3%26.5%Underlying earnings per share<strong>2012</strong>2011$2.26$5.06Capital projects and investmentFor a summary of the Group’s capitalprojects and investmentsturn to pages 14–17Total shareholder return (TSR)Please refer to the Remuneration reportturn to pages 108–127Operating and financial reviewWork-related fatal injuryfrequency rate (FIFR)Target: Zero fatal incidents<strong>2012</strong>201113 fatalities, 0.008 FIFR17 fatalities, 0.009 FIFRLost-time injury frequency rate (LTIFR)Target: Zero incidents – the ultimate goalof zero harm remains<strong>2012</strong>20110.600.64Energy consumption<strong>2012</strong>2011GHG emissions<strong>2012</strong>2011Total water useTarget: Under revision<strong>2012</strong>108 million GJtotal energy used102 million GJtotal energy used18 Mt CO 2equivalent19 Mt CO 2equivalent122 Mm 3Corporate social investment (3)<strong>2012</strong>2011Enterprise developmentTarget: Businesses supported: 3,500Jobs sustained: 18,000<strong>2012</strong>2011$154 m,3% of profit before tax$129 m,1% of profit before tax17,598 businesses supported64,927 jobs sustained38,681 businesses supported47,070 jobs sustained2011115 Mm 3Voluntary HIV counselling and testing (VCT)Target: Over 90% of employees in high diseaseburden countries<strong>2012</strong>201182%92%Voluntary labour turnover<strong>2012</strong>2.4%Gender diversity<strong>2012</strong>15% females20113.0%201115% females23% female managers22% female managers(3)CSI expenditure for 2011 was restated from $122 millionto $129 million due to increased expenditure reported byKumba following publication of the 2011 <strong>Anglo</strong> <strong>American</strong><strong>Annual</strong> <strong>Report</strong>.<strong>Anglo</strong> <strong>American</strong> plc <strong>Annual</strong> <strong>Report</strong> <strong>2012</strong> 13
OPERATING AND FINANCIAL REVIEW STRATEGY IN ACTIONSTRATEGIC ELEMENT: Investing in world class assets and the most attractive commoditiesSURPASSINGSTANDARDSWITH THE FUTURE IN MIND14 <strong>Anglo</strong> <strong>American</strong> plc <strong>Annual</strong> <strong>Report</strong> <strong>2012</strong>
We have a clear strategy of deployingcapital in those commodities withstrong fundamentals and the mostattractive risk-return profiles that deliverlong term, through-the-cycle returnsfor our shareholders.EXCEEDING EXPECTATIONSKumba’s Kolomela mine, which was brought intoproduction five months ahead of schedule inDecember 2011, is a key element of our SouthAfrican iron ore growth strategy. Although, initiallythe operation was expected to ramp up through<strong>2012</strong> to produce between 4 and 5 Mt of saleableproduct, it surpassed expectations to achievedesign capacity by the third quarter, shipping8.5 Mt of iron ore to customers in the year. Safetyperformance at Kolomela has been outstanding;the project and operations achieved a combined29 million man hours, without a fatal incidentor lost-time injury between March 2010 andOctober <strong>2012</strong>, setting a new benchmark forthe Group and for projects of this nature inSouth Africa.718HOMES ARE BEING BUILT TO ACCOMMODATEKOLOMELA’S EMPLOYEES. BY THE END OF<strong>2012</strong>, 615 HAD BEEN COMPLETED, WITH THEREMAINDER DUE BY Q2 2013.Operating and financial review01IRON ORE PRODUCTION FOR KUMBA (MT)70 MtpaKumba plans to grow organically to achieve productionof 70 Mtpa from South Africa.70.041.9 43.4 41.3 43.1022009 2010 2011 <strong>2012</strong> Target“It is such occasions as today, theopening of a new mine, the creationof new economic activity andjobs which makes one proud andemphasises the importance ofmining in our country.”Susan ShabanguSouth Africa’s Ministerof Mineral Resourcesc. 85%OF PERMANENT EMPLOYEESARE FROM THE NORTHERN CAPEPROVINCE, VERSUS A TARGETOF 75%.“Kumba is studyingopportunities toexpand Kolomela’sproduction through abeneficiation process,which could add afurther 6 Mtpa of production.”Norman MbazimaCEO, Kumba Iron Ore63.7% FeAVERAGE GRADE OFUNBENEFICIATED ORE – KOLOMELA.Main Fitter MarthaZenda at Kolomelairon ore plant’sload-out stationfeed conveyor. Theconveyor transfersiron ore from thestacker reclaimeryard to binswhich feed theSishen-Saldanhaexport rail system.01 The Kumba/Kolomela rail loadingfacility is designedto transfer iron orerapidly to rail wagonson the export railsystem.02 Maintenanceoperator MattieusDikwidi at theKolomela plant.<strong>Anglo</strong> <strong>American</strong> plc <strong>Annual</strong> <strong>Report</strong> <strong>2012</strong> 15
OPERATING AND FINANCIAL REVIEW STRATEGY IN ACTIONSTRATEGIC ELEMENT: Investing in world class assets and the most attractive commoditiesPROJECT DELIVERY TOCONTINUE TO DRIVE HIGHQUALITY PRODUCTION GROWTHIN BRIEF• Cerrejón P40 8 Mtpa exportthermal coal expansion inColombia – first coal in 2013.• Minas-Rio 26.5 Mtpa iron oreproject in Brazil – injunctionslifted and first ore on ship(FOOS) end of 2014.• Grosvenor 5 Mtpametallurgical coal projectin Australia – longwallproduction in 2016.CAPEX: 4 strategicgrowth projects$ bn<strong>2012</strong>201120101.7CAPEX: Other projects$ bn<strong>2012</strong>201120101.01.02.42.3CAPEX: Stay in business$ bn<strong>2012</strong>201120101.71.32.42.7The Group’s extensive portfolioof undeveloped world classresources and pipeline of growthoptions span its chosen corecommodities. It offers theGroup flexibility to sequenceinvestment in line with the Group’sview of market dynamics andthe geopolitical environment.Capital is prioritised to maximisevalue accretion while minimisingrisk exposure, taking intoconsideration the Group’sresulting funding capacity.We have a number of projects in theexecution phase and are progressingwith the development of other growthprojects, including the 225,000 tonnesper annum (tpa) Quellaveco greenfieldcopper project in Peru.The Minas-Rio iron ore projectin Brazil is expected to capture asignificant part of the pellet feedmarket with its premium productfeaturing high iron content andlow contaminants. Phase 1 of theMinas-Rio project is expected toproduce 26.5 million tonnes perannum (Mtpa), with potentialoptimisation to 29.8 Mtpa.During the year <strong>Anglo</strong> <strong>American</strong>completed a detailed cost andschedule review of the project. Thereview included third party input andexamined the outstanding capitalexpenditure requirements in light ofcurrent development progress andthe disruptive challenges faced by theproject. The review included a detailedre-evaluation of all aspects of theoutstanding schedule, with a focus onmaximising value and mitigating risk.Following completion of the review,estimated capital expenditure forthe Minas-Rio project increased to$8.8 billion, if a centrally held riskcontingency of $600 millionis utilised in full. On the basis ofthe revised capital expenditurerequirements and assessment of thefull potential of Phase 1 of the project(excluding at this stage the potentialfor future expansions up to 90 Mtpa),<strong>Anglo</strong> <strong>American</strong> will record animpairment charge of $4 billion at31 December <strong>2012</strong>, on a post-taxbasis. The first phase of the project willbegin its ramp up at the end of 2014.The published resource has increasedmore than fourfold since acquisition to5.77 billion tonnes in 2011, of which wehave recently converted 1.45 billiontonnes to Ore Reserves. We anticipateincreases in the resource confidenceand further conversion of resourcesto reserves through our ongoing infilldrilling programme.In Colombia, the brownfield expansionproject, P40, aims to increase valueby increasing export thermal coalproduction capacity by 8 Mtpa to40 Mtpa (100% basis), throughadditional mining equipment andthe debottlenecking of key logisticsinfrastructure along the coal chain.The project was approved byCerrejón’s shareholders in the thirdquarter of 2011. The project isprogressing well and is expected tobe delivered on schedule, with firstcoal expected in 2013.The greenfield Grosvenormetallurgical coal project is situatedimmediately to the south of<strong>Anglo</strong> <strong>American</strong>’s Moranbah Northmetallurgical coal mine in the BowenBasin of Queensland, Australia. Themine is expected to produce 5 Mtpaof high quality metallurgical coal fromits underground longwall operationover a projected life of 26 years andto benefit from operating costs in thelower half of the cost curve.Grosvenor forms a major part of theGroup’s strategy of tripling hard cokingcoal production from its Australianassets, using a standard longwall andcoal handling and preparation plant(CHPP) design. In its first phase ofdevelopment, Grosvenor will consistof a single new underground longwallmine, targeting the same wellunderstood Goonyella Middle coalseam as Moranbah North, and willprocess its coal through the existingMoranbah North CHPP and trainloading facilities. The Grosvenorproject is currently in execution, withengineering work progressing to plan,construction under way and longwallThe Group’sextensiveportfolio ofundevelopedworld classresourcesand pipelineof growthopportunitiesspans ourchosen corecommodities.16 <strong>Anglo</strong> <strong>American</strong> plc <strong>Annual</strong> <strong>Report</strong> <strong>2012</strong>
production targeted to begin in 2016.A pre-feasibility study for expansionby adding a second longwall atGrosvenor is under way.Quellaveco is a greenfield copperproject in the Moquegua region ofsouthern Peru that has the potentialto produce 225,000 tpa of copperfrom an open pit over a mine life ofapproximately 28 years. The projectis expected to operate in the lowerhalf of the cash operating cost curve,SELECTED MAJOR PROJECTSbenefiting from attractive oregrades, low waste stripping andmolybdenum by-product production.<strong>Anglo</strong> <strong>American</strong> completed thefeasibility study for the project in late2010, and took the decision to suspendprogress in order to engage moreactively with the local communitiesthrough a formal dialogue tableprocess, following requests from localstakeholders. The dialogue processreached agreement in early July<strong>2012</strong> in relation to water usage,environmental responsibility and<strong>Anglo</strong> <strong>American</strong>’s social contributionover the life of the mine, and has beenheld as a model for stakeholderengagement in Peru. The projectreceived three critical permits duringthe fourth quarter of <strong>2012</strong> and<strong>Anglo</strong> <strong>American</strong> is targetingsubmission to the Board for approvalin 2013.Operating and financial reviewApprovedFirstproductiondateFullproductiondate Capex $ bn (1) Production volume (2)Sector Project CountryGreenfield (G)/Brownfield (B)Iron Ore and Manganese Minas-Rio Phase 1 Brazil G 2014 2016 8.8 (3) 26.5 Mtpa iron oreGroote Eylandt Expansion Project Australia B 2013 2013
OPERATING AND FINANCIAL REVIEW STRATEGY IN ACTIONSTRATEGIC ELEMENT: Organising efficiently and effectivelyLIFTINGPERFORMANCEWITH THE FUTURE IN MIND18 <strong>Anglo</strong> <strong>American</strong> plc <strong>Annual</strong> <strong>Report</strong> <strong>2012</strong>
We organise our business efficiently andeffectively to outperform our competitionthroughout our value chain.DRIVING VALUE THROUGHCOMMERCIAL EXCELLENCEDuring <strong>2012</strong>, we introduced a more globallycoordinated and strategic approach to theway we manage our commercial activities,aimed at delivering substantial additional valuefor the Group.A key element of the new approach is the locationof business units’ export sales and marketingactivities in Singapore and London, to enable usto be closer to our customers in the Asia-Pacificand European markets, and be more agile andresponsive to their needs.The new Singapore hub opened in July <strong>2012</strong>,with Metallurgical Coal, Thermal Coal andPlatinum establishing a base there during theyear and others, including Iron Ore and Copper,following in 2013.New global competence centres will alsosupport value creation by driving excellenceand innovation in areas such as logistics,shipping and market intelligence.For instance, all our global shipping activitieshave now been consolidated into a singlefreight book, with an increasing proportionof cargo deliveries arranged by us rather thanthe buyer. Consolidating our freight bookimproves our purchasing power and enablesus to be more efficient in managing shipmentsthrough our loading facilities. Sharing vesselsand coordinating deliveries will also makebetter use of global shipping routes, reducingfreight costs and turnaround times.50 MtGROUP’S FREIGHT PORTFOLIOTARGET BY 2015.<strong>2012</strong> REVENUE GENERATED BY CUSTOMERS IN CHINA (1)$5.9 bn$3.5 bn$5.1 bn$6.4 bn2009 2010 2011 <strong>2012</strong>(1)The Group’s revenue including attributable share of revenue from associates.$5.9 bn01Operating and financial review“This new approach brings us closerto our customers, enabling us to bemore responsive to their needs. Wecan also create significant additionalcommercial value by coordinatingour approach globally, improving ourproduct mix, enhancing our logistics,and using more sophisticatedmarketing tools and techniques.”Dr Alexander SchmittGroup Head,Commercial CoordinationMain and 02 Therecently opened<strong>Anglo</strong> <strong>American</strong>sales and marketinghub, in Singapore.01 Iron ore fromKumba’s Sishenmine, 861 kilometresaway, is transferredfrom rail wagons atthe dedicated exportport of Saldanha onSouth Africa’sAtlantic coast.02c.57 MtYEAR-ON-YEAR INCREASE IN IRONORE IMPORTS TO CHINA IN <strong>2012</strong>.Source: MySteel and <strong>Anglo</strong> <strong>American</strong> data574 vesselsIRON ORE VESSELS INTO QINGDAOPORT, CHINA IN <strong>2012</strong>.<strong>Anglo</strong> <strong>American</strong> plc <strong>Annual</strong> <strong>Report</strong> <strong>2012</strong> 19
OPERATING AND FINANCIAL REVIEW STRATEGY IN ACTIONSTRATEGIC ELEMENT: Organising efficiently and effectivelyEMBEDDING OPERATIONALEXCELLENCE GROUPWIDEASSET OPTIMISATIONWe continue to deliver onour asset optimisation (AO)programme that has beenin place since 2009. Havingsurpassed our $1 billion targetset in terms of the sustainableAO benefits from core businessesby the end of 2011, we continueto focus on embedding themethodologies, and influencingmindsets and behavioursnecessary for delivering AObenefits across our operations.One of the key features of the AOprogramme remains the OperationReview (OR) process initiated in2010. This structured eight-stepreview process enables our businessunits to drive towards operationalexcellence through the identificationand prioritisation of businessimprovement opportunities, inaccordance with our technicalstandards and our commitment tosafety and sustainable development.The ORs are a collaborative effortthat combine our central technicalcapability with our operationalexpertise across the Group, therebycreating teams that are able to identifyvalue improvement opportunitiesand share leading practices acrossthe Group’s entire mining value chain,which includes the resource, mine,plant and product.During <strong>2012</strong>, ORs were conductedat Collahuasi (Copper joint venture);Mantos Blancos (Copper);Bathopele/Waterval UG2Concentrator and Precious MetalRefinery (Platinum); Bokoni (Platinumjoint venture); Orapa, Letlhakane andDamtshaa mines (De Beers); and ourPhosphates business.A prominent element of the AOprogramme is to embed businessimprovement knowledge and skillswithin the business. This is beingachieved through our AO changemanagement programme, whichencompasses skills developmentand sharing of key learnings, practices,and case studies through dedicatedinternal communication channels.We continue to develop ouremployees’ business improvementskills and have trained approximately1,300 people through the Group’scentral AO Academy.As we continue to equip our peoplewith the necessary skills and tools toadvance business improvement, weare also creating unifying systems andframeworks that will result in improvedoperational performance. We arecurrently developing an OperationalExcellence Framework (OEF), thepurpose of which is to provide a clearand consistent reference for howwe operate and maximise the valueproposition for <strong>Anglo</strong> <strong>American</strong>.The OEF focuses on those priorityareas that are fundamental to drivingoperational performance, bringingtogether, and ensuring consistentapplication of all the relevantstandards and processes to supportthe operations.We continueto developour employees’businessimprovementskills andhave trainedapproximately1,300 peoplethrough ourcentral AOAcademy.Supporting operational excellenceare the Resource to Market (R2M)optimisation and Group Benchmarkingprogrammes. The objective of theR2M programme is to integrateplanning and execution across themining value chain. This ensures thatan operation is managed with anunderstanding of how decisions madeare likely to impact other parts of thevalue chain. During <strong>2012</strong>, R2M waslaunched at Copper’s Los Broncesmine in Chile and Platinum’sMogalakwena mine in South Africaand has delivered improvedperformance and enhanced miningflexibility. As an example of specificimprovements, blasted rock stockand average tonnage per blasthave increased substantially atLos Bronces, leading to reducedcongestion at the mine.In <strong>2012</strong>, we launched the first phaseof our Group Benchmarking Tool.The tool aims to deliver a platformthat provides a single and validatedsource for benchmarking informationin <strong>Anglo</strong> <strong>American</strong>. The first phaseof the project delivered KPIs forequipment efficiency in opencastmines. The next phase, planned forcompletion by end of 2013, willinclude additional KPIs for opencastbenchmarking as well as the launchof underground and metallurgicalbenchmarking information.20 <strong>Anglo</strong> <strong>American</strong> plc <strong>Annual</strong> <strong>Report</strong> <strong>2012</strong>
SUPPLY CHAINSupplier partnershipsOur relationships with suppliers havebeen strengthened considerably inrecent years. These relationships haveresulted in minimised lead times formajor equipment delivery and havemitigated inflationary pressure andsupply risk to our operations. SupplyChain is working with key suppliersin each region as part of our ‘Top 40’initiative to identify additional savings,waste elimination opportunities and tominimise cost inflation through 2013.Proactive reviews of equipmentand services on our operations haveled to the identification of savingsopportunities and are delivering totalcost of ownership (TCO) benefitsacross the business units.Framework agreements are nowin place with 33 key suppliers,representing a formal alignment inour commercial relationships. Theseagreements are critical in the currentmarket as they provide the platformfor value creation and greatertransparency of cost, demandand capacity.Regional gross expenditure <strong>2012</strong>% of total expenditureSouth Africa 45%Australia 18%Chile 20%Brazil 15%Other 2%Sustainable and responsiblesupply chainLocal procurement<strong>Anglo</strong> <strong>American</strong>’s procurement spendon goods and services represents asignificant development opportunity.Expenditure on suppliers based inthe host communities close to ouroperations was $1.5 billion.We proactively design localprocurement initiatives to optimiseopportunities to integrate localbusinesses into our global supplychain. In doing so, we believe we canmake a significant socioeconomiccontribution to our host communities,as well as efficiencies in our supplychain by lowering logistics costs andsecuring access to critical goodsand services.<strong>Anglo</strong> <strong>American</strong>’s Group-wide localprocurement policy, launched in 2010,is now embedded in all our operations.During the year, all operations madeprogress in developing their localprocurement strategies and are nowmeasuring and reporting local spend.In making sourcing decisions, however,we also need to ensure that we remaincompetitive. Sourcing from countrieswhere we do not operate is sometimesessential if the products are notavailable locally. China is a keycustomer and strategic businesspartner and we have a sourcingstrategy to build long term, valuablerelationships with Chinese suppliers.This includes identifying Chinesesuppliers from whom local businessescan source and provide maintenanceand support services locally.Local procurement is a particularpriority in our South Africanoperations, forming an importantpart of our contribution to thecountry’s drive to promote blackeconomic empowerment. In <strong>2012</strong>,managed businesses spentZAR 25.8 billion ($3.1 billion), 54%of South African discretionaryexpenditure, with historicallydisadvantaged South Africanbusinesses (not including goodsand services procured from parastatalcompanies and municipalities).TOTAL COSTOF OWNERSHIPIMPROVEMENTSAT PLATINUMThe <strong>Anglo</strong> Converting Process(ACP) uses a rubber hose in itsmatte feed transfer into thefurnace via a submerged steellance. The value of the producttransported through the mattetransfer system and hose is$12.5 million per day. Anyunplanned downtime, therefore,incurs significant cost to the plantthrough reduced production,maintenance and overtime costs.The ACP previously made useof standard specialised rubberhoses. These hoses, however,had a lifespan to transportapproximately 1,500 tonnes,meaning they had to be replaced11 times a month on average.Aside from the replacementcosts, this had a significantimpact on production.A focus team from ACPcritically evaluated the hoses,developed alternatives, thenapproached Dunlop IndustrialProducts for the supply of thealternative hoses. The ACPfocus team, together withDunlop, were able to developa fit-for-purpose ceramic tiledrubber hose.The new hoses are able totransport on average 25,000tonnes and only need to bereplaced once a month, resultingin realised value that has, to date,exceeded expectations.ImagePlatinum’s ACP plant in Rustenburg,South Africa.Operating and financial reviewFor more information, visitwww.angloamerican.com<strong>Anglo</strong> <strong>American</strong> plc <strong>Annual</strong> <strong>Report</strong> <strong>2012</strong> 21
OPERATING AND FINANCIAL REVIEW STRATEGY IN ACTIONSTRATEGIC ELEMENT: Operating safely, sustainably and responsiblyBUILDINGRELATIONSHIPSWITH THE FUTURE IN MIND22 <strong>Anglo</strong> <strong>American</strong> plc <strong>Annual</strong> <strong>Report</strong> <strong>2012</strong>
We believe that operating safely,sustainably and responsibly is not onlyfundamental to our licence to operate,but is also an increasingly importantsource of competitive advantage.OPEN DIALOGUE IN PERUIn late 2010, our Quellaveco copper projectlocated near Moquegua in southern Peru facedconsiderable local opposition from communitiesconcerned at what they saw as its potentialnegative impact, in particular on water availabilityin a severely water-stressed area.In response, <strong>Anglo</strong> <strong>American</strong> agreed to pausethe project and to participate in an extensive,structured ‘dialogue table’ with local and nationalstakeholders, led by the regional presidentMartín Vizcarra, with a view to addressingcommunity concerns.During 18 months of detailed negotiations, theproject team was able to understand the rootcause of local worries, address the lack ofinformation about both the environmentalsafeguards of the project and its multiple potentialsocial and economic benefits, and adapt aspectsof the project design to increase those benefits.The result? Agreement at the dialogue table,broad social and political support for Quellaveco,and <strong>Anglo</strong> <strong>American</strong>’s approach held up as bestpractice for socially responsible mining in Peru.KEY FACTSReserves and Resources• 916.4 Mt Proved and Probable Reserves(at 0.65% TCu)• 1,092.0 Mt Measured and IndicatedResources (at 0.39% TCu)• Contained copper = 5.9 MtDialogue table• Began March 2011• Ended July <strong>2012</strong>• 22 plenary meetings• 45 sub-committee meetings• 31 organisations participating• A final agreement comprising 26wide-ranging programmes addressingwater, environment and regionaldevelopment issues01Operating and financial review“This was a victoryfor openness,transparency andengagement and allparticipants in theprocess are to becongratulated. Together we showedthat our project can bring hugebenefits to Peru and Moquegua. Wenow need to ensure we deliver on ourcommitments and continue the workto maintain our licence to operate.”Eduardo Serpa<strong>Anglo</strong> <strong>American</strong>’s chief negotiator02OUR QUELLAVECO COPPER PROJECTIS LOCATED IN SOUTHERN PERULimaArequipaCuzcoTacnaPunoMoqueguaMain At our Quellavecoproject in Peru,process managerGonzalo Manriqueuses a model of theproposed mine andprocessing facilitiesto ‘dialogue table’representatives fromthe local Moqueguacommunity.01 Participantsrepresentinglocal and nationalstakeholders and<strong>Anglo</strong> <strong>American</strong>attend the finalmeeting of thedialogue tablein Moquegua.02 Selma Fernandes,from our SupplyChain team inCopper, with localprocurement analystMilagros Myrick, atthe Quellavecoproject’sMoquegua office.<strong>Anglo</strong> <strong>American</strong> plc <strong>Annual</strong> <strong>Report</strong> <strong>2012</strong> 23
OPERATING AND FINANCIAL REVIEW STRATEGY IN ACTIONSTRATEGIC ELEMENT: Operating safely, sustainably and responsiblySUSTAINABLE DEVELOPMENTIN EVERYTHING WE DOMAKING ADIFFERENCEOur aim is always to operatesafely, sustainably and responsibly.Making a tangible difference isfundamental to our licence tooperate and an important sourceof competitive advantage. Westrive to realise exceptionaloperational value by embeddingsustainable development ineverything we do – from oursystems, risk processes andprocedures, to the way in whichwe consult and work with ourstakeholders. Mining can be ahigh-risk business – but we donot accept that anyone shouldbe injured while working for us.Safety, therefore, remains ournumber one priority. As acompany that exploits a finiteresource, we aspire to operatingour mines in a way that isenvironmentally responsible,benefits host communities andleaves a positive social legacy.Our strong governance structuresrelating to sustainable developmentsupport this aspiration, providingclear lines of responsibility from theoperational level through to the Board.A dedicated global Safety andSustainable Development Risk andAssurance team provides expertopinion, in conjunction with ourinternal <strong>Anglo</strong> <strong>American</strong> BusinessAssurance Services, on the adequacyof risk-control measures to ensurethat current and emerging risks areeffectively controlled. This secondpartyperspective, together withsubject matter expertise (internal andexternal), enables us to identify criticalsafety, health, social and environmentalimprovement opportunities.Sustainable Development is fullyintegrated within the projectmanagement and asset optimisationprocesses, ensuring that broadersustainability and licence-tooperateissues are duly taken intoaccount in operational and decisionmaking processes.In this section we provide anoverview of our managementapproach and performance relatingto social and community activities,safety and health, and environmentalperformance. Our websitewww.angloamerican.com providesadditional information on oursustainability performance, includinga stand-alone sustainability reportas well as separate reports fromcertain of our individual companiesand operations.As a companythat exploits afinite resource,we aspire tooperating ourmines in away that isenvironmentallyresponsible,benefits hostcommunitiesand leaves apositive sociallegacy.SOCIAL AND COMMUNITYMost of our operations are located inemerging economies, many of whichhave low levels of socioeconomicdevelopment. To ensure a lastingpositive social and environmentallegacy, we supplement the valuegenerated through our core activities– paying taxes, salaries, and paymentsto suppliers – with initiatives designedto develop host communities over thelong term, many of which areundertaken in partnership with NGOs,communities, and local governments.If we fail to account for our actionsand do not engage appropriately withour communities, we risk underminingour reputation and jeopardisingour licence to develop and operateprojects. The relative importance oflabour relations and local economicdevelopment activities has grown, aswitnessed by the industrial action inSouth Africa’s mining industry in thesecond half of <strong>2012</strong>.Our strategy and managementapproach<strong>Anglo</strong> <strong>American</strong>’s social strategyfocuses on observance of humanrights, proactive engagement withour stakeholders and leveraging ourcore business to support long termsocial development. Communitydevelopment activities prioritiselocal procurement and supplierdevelopment, building local capacity,including providing infrastructure forhealth care, housing and sanitation,and investing in enterprise andskills development.The <strong>Anglo</strong> <strong>American</strong> Social Waycontains a mandatory set of standardsthat prescribe rigorous minimumrequirements for social performanceacross the Group.The requirements of the Social Wayare integrated into the stage-gatereviews of our new capital projectsand our due diligence procedures formergers and acquisitions.24 <strong>Anglo</strong> <strong>American</strong> plc <strong>Annual</strong> <strong>Report</strong> <strong>2012</strong>
Social investment output indicatorsTotal number of community development projects1,602delivering benefits to communities in <strong>2012</strong>Total number of businesses supported 17,598Jobs created/maintained through enterprise64,927development initiativesBeneficiaries of education projects 256,980Beneficiaries of sports, arts, culture and heritage projects 645,211Beneficiaries of community development projects 1,065,821Beneficiaries of disaster and emergency relief projects 43,684Beneficiaries with improved livelihood 448,395BUILDINGSTRONG TOWNSIN MININGREGIONSOperating and financial reviewOur commitment to respecting humanrights forms the foundation of ourapproach to community engagementand development. Human rights bestpractice requirements are integratedinto the Social Way and all otherrelevant policies, systems and toolsthroughout the business.In <strong>2012</strong>, we rolled out a Groupwidecommunity development peerreview process, which draws oninternal expertise, as well as externalpartners such as CARE Internationalto ensure that our investments incommunity development are aseffective as possible.Our industry leading Socio-EconomicAssessment Toolbox (SEAT) is theprimary means by which we enhancethe development outcomes andcapacities of host communities. Weuse SEAT to improve operations’understanding of their socioeconomicimpacts (both positive and negative),enhance stakeholder dialogue andthe management of social issues,build our ability to support localsocioeconomic development, andfoster greater transparency andaccountability. The third versionof SEAT was published during theyear and has been made availablepublicly, as a leading practice resourcefor other companies to use.Promoting sustainabilityin our supply chain andlocal procurementWe expect and encourage oursuppliers to act in a safe, sustainableand responsible manner. Thisexpectation is given effect throughour policy on sustainable developmentin the <strong>Anglo</strong> <strong>American</strong> supply chainand our Supplier SustainableDevelopment Code.We are also committed to promotinglocal procurement throughout ourmining life cycle. In doing so, webelieve we can make a significantsocioeconomic contribution to ourhost communities as well as improveefficiencies in our supply chain bylowering logistics costs, and securingaccess to critical goods and services.A lack of municipal capacity inour host communities can havea negative effect on residentsand on <strong>Anglo</strong> <strong>American</strong>’s abilityto plan. Our new partnershipapproach to capacity buildingin South Africa and Brazil aimsto offer an effective andsustainable solution.In South Africa, we have teamedup with the Development Bank ofSouth Africa to improve capacityin host mining areas and create thecountry’s first example of apublic-private partnership in thisfield, with the aim of enablingmunicipalities to supply basicservices like water and electricityeffectively, rather than <strong>Anglo</strong><strong>American</strong> supplying them directly.At our Barro Alto nickel operationin Brazil, <strong>Anglo</strong> <strong>American</strong> has beencollaborating with Agenda Públicasince 2008, in an effort to prepareboth the local government andcitizens to live in a society thatwould grow as mining revenuesstarted to flow into the town.In both Brazil and South Africa, theprojects follow two broad strands:empowerment of communities toenable them to understand theirrights and hold the government toaccount; and training and skillsdevelopment for public officialsto enable them to fulfil their rolesand respond to public demand.Although <strong>Anglo</strong> <strong>American</strong>provides funding in both cases,our knowledge of the local area,our input into project planningand evaluation, and our localrelationships have all provedimportant elements of the work.ImageLiomar Vidal, an <strong>Anglo</strong> <strong>American</strong> communityrelations officer, at the Professora MariaSiqueira Pinto school, which <strong>Anglo</strong> <strong>American</strong>helped to build in Barro Alto.<strong>Anglo</strong> <strong>American</strong> plc <strong>Annual</strong> <strong>Report</strong> <strong>2012</strong> 25
OPERATING AND FINANCIAL REVIEW STRATEGY IN ACTIONSTRATEGIC ELEMENT: Operating safely, sustainably and responsibly<strong>2012</strong> Global social investmentexpenditureTotal: $154 mCommunity development 43%Education and training 21%Health and welfare 11%Environment 5%Sports, arts, culture and heritage 5%Water and sanitation 2%Incorporating:Disaster and emergency relief 1%Institutional capacity development 1%Employee matched giving 1%Other 10%<strong>2012</strong> Global social investmentexpenditure by regionTotal: $154 mSouth Africa 62%Rest of Africa 1%United Kingdom 1%Americas 33%Other 3%Our local procurement policy is nowembedded across the Group and alloperations have made encouragingprogress in developing localprocurement strategies. In <strong>2012</strong>,expenditure on suppliers based in thecommunities close to our operationswas $1.5 billion (2011: $1.1 billion).In <strong>2012</strong>, we hosted a conferencefor our leading on-site suppliers inSouth Africa and agreed a numberof initiatives to improve the welfare ofour contractor employees and theirfamilies. A number of commitmentswere made by both parties during theconference, including a requirementthat all employees on our operations inSouth Africa would have access tobasic medical care (facilitated by<strong>Anglo</strong> <strong>American</strong> where necessary),as well as making <strong>Anglo</strong> <strong>American</strong>’shighly regarded tools, initiatives andresources in the areas of communityengagement and communitydevelopment available to contractors.Enterprise developmentEnterprise development is one ofthe most effective means of ensuringthat the benefits for host communitiesas a result of our mining activities willbe sustainable. Since the 1980s, wehave been pioneering approachesto building small businesses in SouthAfrica, and have now extended ourreach firmly into Chile and Brazil.In <strong>2012</strong>, we took a more strategicapproach to enterprise developmentthat has involved specifically designingschemes for countries such as Peru,Brazil and Botswana, as well as forparticular focus areas such as housingand low-carbon technologies.Enterprisedevelopmentis one ofthe mosteffective meansof ensuringthat the benefitsfor hostcommunities asa result of ourmining activitieswill besustainable.Infrastructure and localcapacity developmentOur mines are often situated in areasthat are underdeveloped and remote,where the associated infrastructure –such as roads, health facilities andwater – can be used to the advantageof local communities. A particularfocus is addressing South Africa’sacute shortage of affordable housing.Notably, we have entered into apartnership agreement with theDevelopment Bank of Southern Africa(DBSA) to build the capacity of 10 ofour host municipalities. This initiativewill enable local governments todeliver on their basic public serviceobligations; for example, in the fieldsof water and electricity supply,management of local infrastructureprojects and revenue collection. Wehave also briefed the South AfricanChamber of Mines so that othercompanies may replicate this model.Our capacity developmentactivities focus on strengthening theskills, competencies and abilitiesof employees and communitymembers to promote robust,self-sufficient local economieslong after our mines have closed.Corporate social investmentIn <strong>2012</strong>, <strong>Anglo</strong> <strong>American</strong>’s corporatesocial investment (CSI) spend in localcommunities totalled $154 million(3% of profit before tax), up from$129 million in 2011. We have astandardised reporting processfor all our social investments, withrobust metrics to monitor the levelof social performance. This facilitatesconsistent reporting of outputs, andhelps to identify the most effectiveprojects, delivery methods andpartners, in order to try and maximisethe value that <strong>Anglo</strong> <strong>American</strong> andits host communities get from theseinvestments. A fuller analysis of theGroup’s social investment activitiescan be found in the SustainableDevelopment <strong>Report</strong> <strong>2012</strong>.26 <strong>Anglo</strong> <strong>American</strong> plc <strong>Annual</strong> <strong>Report</strong> <strong>2012</strong>
SAFETYOffering a safe and healthy workplaceis a core component of our ‘employerof choice’ agenda. We aim to achieve‘zero harm’ by creating and instillinga company and industry culturethat protects people from harm andimproves their health and well-being.PerformanceAlthough the number of people wholost their lives while working for usdeclined to 13 for the year (2011: 17),any loss of life is unacceptable and noone should have to risk their life whileworking for us. Seven of these deathsoccurred at our Platinum business,where the majority of fatal incidentsstill occur, despite a significantimprovement of 61% over the pastfi v ey e a r s .Our lost-time injury frequency rate(LTIFR) improved from 0.64 in 2011to 0.60 in <strong>2012</strong>. Furthermore, our totalrecordable case frequency rate, whichincludes any injury that requires morethan first aid treatment, has startedto improve.Our strategy and managementapproach<strong>Anglo</strong> <strong>American</strong>’s safety strategy isfounded on three key principles: amindset of zero harm; the eliminationof repeat incidents; and the consistentapplication of simple, non-negotiablestandards.We use the <strong>Anglo</strong> <strong>American</strong> safety‘journey model’ – which recognisesthe importance of the roles of bothpeople and systems in a miningbusiness – to measure our progressin delivering against our safetystrategy. We believe we are currentlyat the ‘compliant’ stage, with a growingnumber of operations moving to‘proactive’ and a decreasing numberbeing characterised as ‘reactive’.Our current suite of Group safetyprogrammes focuses on issues thatwill improve our level of maturity on thejourney model. These programmesinvolve: operational risk management;learning from incidents; risk andchange management; leadership;developing people; leading indicators;corporate safety work streams; supplychain safety initiatives; integratingsafety throughout the business; andour <strong>2012</strong> safety leadership summit.Total number of fatal injuriesand fatal injury frequencyrate 2008–<strong>2012</strong>Fatalities3025201510502008 2009 2010 2011 <strong>2012</strong>FIFRFatalitiesFIFR0.0160.0140.0120.0100.0080.0060.0040.002All operations have safetyimprovement plans that prioritisethese elements based on operationalrisk. The operational risk managementand ‘learning from incidents’programmes are a particular focusfor all business units.HEALTHEffective management of occupationalhealth protects our people, enhancesproductivity, and helps maintain ourlicence to operate and our globalreputation. Promoting a healthycommunity and a safe and healthyworkforce is beneficial for everyone.Our strategy and managementapproachWe strive to proactively identify andmanage the source of potential healthrisks in the workplace, and to eliminateexposure to hazards that can causedisease to develop. Building on theseinitiatives is our employee health andwellness programme, which includesa strong emphasis on combatingHIV/AIDS and tuberculosis (TB) withinour workforce and their families,particularly in southern Africa. Beyondour immediate workforce, we strive tohelp strengthen healthcare systems inunder-serviced rural areas and buildpartnerships to improve access toquality health care.0Total number of lost-time injuriesand lost-time injury frequencyrate 2008–<strong>2012</strong>Lost-time injuries2,5002,0001,5001,00050002008 2009 2010 2011 <strong>2012</strong>LTIFRLost-time injuriesLTIFR1.20.80.60.40.2Occupational healthOur approach is governed by the<strong>Anglo</strong> <strong>American</strong> Occupational HealthWay, which sets out a series ofstandards, guidelines and assuranceprocesses aimed at preventing harmto our employees. In <strong>2012</strong>, wecontinued to roll out new mandatorytechnical standards that address ourprincipal health risks relating to noise,dust (inhaled hazards or airbornepollutants), fatigue, alcohol andsubstance abuse. We also refreshedthe risk management approach withinthe Occupational Health Way to alignwith our Group-wide integrated riskmanagement approach.The ability to capture and managehealth information is critical if we areto keep our workforce and theirfamilies healthy. Building this capabilitywithin our business was a centralactivity in <strong>2012</strong> and will continue in thecoming year.The number of occupational diseasecases reported in <strong>2012</strong> was 170,compared with 197 in 2011. Thistranslates to an incidence rate of 0.189,an 8% reduction.10Operating and financial review<strong>Anglo</strong> <strong>American</strong> plc <strong>Annual</strong> <strong>Report</strong> <strong>2012</strong> 27
OPERATING AND FINANCIAL REVIEW STRATEGY IN ACTIONSTRATEGIC ELEMENT: Operating safely, sustainably and responsiblyTackling TB and HIVWe are recognised leaders for ourHIV/AIDS programmes in theworkplace. The continued highprevalence of HIV in southern Africais linked to a rising incidence of TB,which has become a most disturbingand pressing issue for us and ouremployees. We have an activeprogramme aimed at addressingthe escalating TB epidemic. This isevidenced in our TB incidence rate,which continues to decline and is, at958 per 100,000 employees, lowerthan both the national and industryaverages. Despite these efforts, it iswith deep regret that 59 employeesdied from TB in <strong>2012</strong>. We do not acceptthat anyone should die from thispreventable and treatable disease.People enrolled in our HIV WellnessProgramme are also offered TBprevention therapy. Testing (throughour wellness programme) is theentry point to our comprehensiveprogramme of prevention, care, supportand treatment for HIV and AIDS and allemployees who test positive are invitedto enrol. In <strong>2012</strong>, we tested andcounselled 95,244 employees andcontractors (2011: 110,010), whilemore than 90% of our employees insouthern Africa check their HIV statusevery year, on average. In <strong>2012</strong>, wesaw a significant increase in the numberof employees who are estimated tobe HIV-positive enrolling on theprogramme – 70% against 61%in 2011.By year end, we had 5,332 employeeson anti-retroviral therapy (ART) (2011:4,730). A major challenge is ensuringpeople’s adherence to treatment, andextra emphasis is placed on providingsupport and counselling and ensuringdiligent care at a primary care level.We remainone of the keyprivate-sectorsupporters ofthe Global Fundto Fight AIDS,Tuberculosisand Malaria andof the GlobalAlliance forVaccines andImmunisations.Promoting healthcare in thebroader communityOur activities to promote healthcarein the broader community includeplanned investments in health systemsstrengthening in our neighbouringcommunities, as well as activitiesaimed at supporting health care indeveloping countries more broadly.We remain one of the key privatesectorsupporters of the Global Fundto Fight AIDS, Tuberculosis andMalaria and the Global Alliance forVaccines and Immunisations, apublic-private partnership that isincreasing access to immunisation inthe world’s poorest countries.We use the knowledge and experiencegained from our workplace healthprogrammes to support communityoutreach programmes and strengthencommunity health systems; that is,the people, the processes and thetechnology that make local healthservices work. In South Africa, weare working with the provincial healthdepartments in the Eastern Cape,Mpumalanga, Northern Cape andNorth West provinces, which are allassociated with our operations or arelabour-sending areas, to improvehealth services.In Brazil, we continue to work withthe highly regarded Brazilian NGO,Reprolatina, to improve access toquality health services, particularlywith regard to reproductive health forwomen and girls with a current focuson the communities surrounding theBarro Alto nickel operation.ENVIRONMENTWhile the extraction and processingof minerals and metals is fundamentalto the global economy, its associatedactivities result in the unavoidabledisturbance of land, the consumptionof resources, and the generationof waste and pollutants. Growingregulatory and social pressure,increasing demands for limited naturalresources, and the escalating costsof energy and water all highlight thebusiness imperative of responsibleenvironmental management.Within this context, the principalenvironmental risks facing ourbusiness relate to water, climatechange and energy.Please refer to our stand-aloneSustainable Development <strong>Report</strong>for a review of our managementapproach and performance relatingto land management, biodiversity,waste and air quality.Our strategy and managementapproachWe seek to effectively manage ourenvironmental risks by minimising ourimpacts and by taking advantage ofopportunities that deliver long termbenefits to our stakeholders. Thepotential gains to our business includeaccess to secure, affordable andsustainable supplies of water andenergy for our operations, reducedcosts, improved productivity, shorterpermitting times and an enhancedreputation. Implementation of ourstrategy is through the following threeareas of activity: driving operationalexcellence; investing in technology;and engaging and partnering withour stakeholders.The <strong>Anglo</strong> <strong>American</strong> EnvironmentWay and its mandatory performancestandards on social and environmentalimpact assessments, water, air quality,mineral and non-mineral waste,hazardous substances, biodiversity,rehabilitation and mine closure, allguide our approach to responsibleenvironmental management.28 <strong>Anglo</strong> <strong>American</strong> plc <strong>Annual</strong> <strong>Report</strong> <strong>2012</strong>
WATERSecurity of water supply is a corebusiness risk and a critical elementof our social and legal licence tooperate. Our operations need largevolumes of the right quality of waterfor both production and processing.Yet more than 70% of our mines arein water-stressed areas where accessto water is already a significantsocioeconomic concern. At the sametime, our operations present a potentialenvironmental risk in terms of waterquality. We are committed, therefore,to providing water security for ouroperations and the communitieswhere we operate.Our strategy and managementapproachWe have an ambitious 10-year strategythat is split into three distinct steps.The first step, ‘Be disciplined’, is aboutgetting the basics right. The secondstep, ‘Be proactive’, encouragesoperations to go beyond compliance,while the third, ‘Build resilience’, takesus to being part of broader, catchmentlevelwater solutions. Our intention isto achieve ‘water neutrality’ at our newmines by 2030.Two years into the strategy, we havelargely consolidated the first stageof our journey and are now targetingthe more advanced ‘proactive’ and‘resilient’ stages.Operational excellenceOperational excellence in relation towater management is mainly aboutbeing smarter in the way we use andmanage water. Our Group technicalstandard includes detailedrequirements on water-reductiontarget setting, water monitoring andreporting, and site-level water actionplans (WAPs), which have driven apositive shift in our approach tomanaging water at operations.In 2011, we implemented our waterefficiency target tool (WETT), whichforecasts the projected business-asusualwater demand of individualoperations and establishes a registerof water-saving projects. The rollingout of WETT across the Group during<strong>2012</strong> has led to tangible water savings,more effective water management,better tracking and reporting, andincreased awareness of waterconservation.Total water required,by use in <strong>2012</strong>%Water re-used/recycled in process 73%Water used for primary activities 24%Water used for non-primary activities 3%In <strong>2012</strong>, we also completed awater-quality audit protocol andundertook a series of audits acrossthe Group, which will inform ourunderstanding of how to bettermanage water quality risk.TechnologyTo achieve our long term goal ofbecoming water neutral, we estimatewe will have to halve the currentconsumption of ‘new’ water atoperations and ensure that more than80% of that water is recycled. We willneed to identify and invest in newtechnology solutions to achieve this.To better understand and define ourwater technology pathway, we haveresearched what ‘water neutrality’would mean for a mine, as well as howto achieve a ‘carbon neutral’ mine,recognising the potential trade-offsbetween water and energy savings.Another focus has been workingwith the UK Met Office, ImperialCollege London and others, onmodelling the potential regionalimpacts of changes in precipitationresulting from climate change.Engagement and partnershipsWherever we operate, we engage withhost governments, local authorities,communities, NGOs, businessesand other stakeholders on a range ofwater-related issues, and participatein global policy debates on water.Total water consumed 2008–<strong>2012</strong>Million m 31801701601501401302008 2009 2010 2011<strong>Anglo</strong> <strong>American</strong> actualBusiness as usual (BAU) baseline<strong>2012</strong>Our performanceDespite acquisitions, expansions andproduction increases, and taking intoaccount disposals, the Group hasmaintained a reasonably stable levelof water demand since 2007.<strong>Anglo</strong> <strong>American</strong>’s consumption ofwater used for primary activities hasincreased by 6%, from 115 million m 3in 2011 to 122 million m 3 in <strong>2012</strong>.The primary driver was Los Broncescopper mine in Chile, which increasedour Copper business’ waterconsumption by 7 million m 3 . Thisfigure would have been significantlyhigher if it were not for the largeincrease in water recycled from theoperation’s tailings dam (this morethan doubled to 82 million m 3 of waterin <strong>2012</strong>). The increase was furthermitigated by 26 water savingsprojects around the Group thatsaved 7 million m 3 of water.More than 70% of our operationalwater requirements were met byrecycling/re-using water over the pasttwo years. Within the Group there havebeen several high performers in termsof recycling, with some reaching levelsas high as 90–97%. Our operationsare also seeking to reduce theirdependency on high-quality water byswitching to the use of lower waterqualitygrades where this is deemed fitfor the intended use. Currently, potablewater accounts for just 18% of our total.Operating and financial review<strong>Anglo</strong> <strong>American</strong> plc <strong>Annual</strong> <strong>Report</strong> <strong>2012</strong> 29
OPERATING AND FINANCIAL REVIEW STRATEGY IN ACTIONSTRATEGIC ELEMENT: Operating safely, sustainably and responsiblyCLIMATE CHANGE AND ENERGYClimate change presents a significantbusiness challenge. The key riskswe face are: increasing energy andcompliance costs associated with newpolicy measures, including potentiallysignificant costs from carbon pricing;changing demand for our products;and increased risks associated withthe physical impacts of climate changeon our operations and neighbouringcommunities. We aim to enable ouroperations and local communities toaddress and adapt to the causes andeffects of climate change.Our strategy and managementapproachClimate change is integrated intomulti-disciplinary, Group-wide riskmanagement processes. We are in thesecond year of our 10-year climatechange strategy.Operational excellenceOur leading energy and carbonmanagement programme, ECO 2MAN,has enabled us to understand howenergy management can be used tocreate additional business value. Itprovides a structured approach toachieve our objectives and it helpsour people understand theirresponsibilities and accountabilities.Each mine has a programme in placeto continually improve how it managesenergy usage, with targets to reduceconsumption in relation to a businessas-usualprojection.During <strong>2012</strong>, we established a Groupcarbon steering committee tocoordinate activities that lower ourexposure to carbon compliance costs,including building our capacity to buyand sell carbon allowances.Total energy consumed2008–<strong>2012</strong>Million GJ1201151101051002008 2009 2010 2011 <strong>2012</strong><strong>Anglo</strong> <strong>American</strong> actualBusiness as usual (BAU) baselineTotal GHG emissions2008–<strong>2012</strong>Million tonnes2520152008 2009 2010 2011 <strong>2012</strong><strong>Anglo</strong> <strong>American</strong> actualBusiness as usual (BAU) baselineTechnologyAchieving our long term milestonesin energy management hingeson identifying and implementinginnovative, ‘step-change’ technologies.We are researching manyopportunities with key stakeholders,and have invested nearly $200 millionto date in low carbon technology,such as the Capcoal and MoranbahNorth methane-fired power stationsin Australia.Our technology vision is to run costefficient, low-carbon (if not carbonneutral) mines by 2030. Our approachfocuses on three areas: reducing howmuch energy we use; recovering andre-using some of that energy; andusing alternative energy sources. Inparallel, we continually investigateopportunities for carbon offsetting.Our longer term research areasinclude using liquefied petroleumgas (LPG) and methane capture topower trucks, introducing clean coaltechnology, and piloting platinumbasedfuel cells as an alternative powersystem for underground locomotives.In recent years we have focusedon assessing the potential physicalimpacts of climate change in a numberof potentially high-risk operationalregions and sites. Building on thisclimate change impact assessmentwork, in <strong>2012</strong> we worked with the UKMet Office to prioritise all our projectsacross the Group in terms of whenclimate change ‘time of emergence’signals will arise. We are also pilotinga study to capture issues aroundclimate and weather model data intoproject design.Engagement and partnershipsWe continue to work withgovernments, our business peers,and other stakeholders to help shapeequitable and effective climate changepolicies. In South Africa, we areespecially active in discussions arounda carbon pricing policy and havewelcomed the opportunity toparticipate in the debate and in thedevelopment of a solid fact base toinfluence an effective carbon policyaligned with the country’sdevelopment objectives.30 <strong>Anglo</strong> <strong>American</strong> plc <strong>Annual</strong> <strong>Report</strong> <strong>2012</strong>
Our performance<strong>Anglo</strong> <strong>American</strong>’s energy consumptionhas increased by 6 million gigajoules(GJ) year-on-year to 108 million GJin <strong>2012</strong>. The rise is primarily as a resultof electricity consumption increasesat Los Bronces copper mine andNickel’s Barro Alto operation. A furtherincrease of 1 million GJ at MetallurgicalCoal as a result of productionincreases at the open cut mineswas mitigated by a relatively smallreduction at Platinum arising fromindustrial action. These increases werefurther mitigated by 215 energy-savingprojects, accounting for reductions ofnearly 5% (equal to saving 4 million GJof energy and $75 million), that werecompleted in <strong>2012</strong>.<strong>Anglo</strong> <strong>American</strong>’s greenhouse gasemissions (GHG) have droppedslightly year-on-year from 19 Mtof CO 2equivalent (CO 2e) emissionsto 18 Mt of CO 2e in <strong>2012</strong>. An expectedrise in GHG emissions associatedwith increased energy consumptionwas mitigated by methanemanagement activities at MetallurgicalCoal and our decision to discontinuepublic reporting on methaneemissions associated withspontaneous combustion (1) .(1)The reason for this is two-fold: our peers do notreport on emissions from spontaneous combustionand there is currently no consistent methodology fordoing so. We will, however, continue to monitor andmanage these emissions internally.MANAGING METHANEMethane emissions representa significant challenge to ourunderground coal mining operationsin Australia and South Africa. Asmethane is 21 times more damagingto the environment than carbondioxide (CO 2 ), we have made it apriority to identify and implementtechnologies that will mitigate theimpact of this greenhouse gas (GHG)and transform an environmentalliability into an asset.Methane is found, in differingconcentrations, in the majority ofcoal seams. For safety reasons, itneeds to be continually ventilatedfor underground mines but its impacton the environment also has to beconsidered. Since 2008, we havebeen piping methane-rich gas fromour underground Moranbah Northand Capcoal mines to two dedicatedgas fired power stations. Whenburned, methane is one of thecleanest fossil fuels, producing lessCO 2 for each unit of heat producedthan other hydrocarbon fuels. Bycapturing methane, the two powerstations together prevent 2.5 Mtof CO 2 equivalent emissions fromentering the atmosphere eachyear – the equivalent of taking500,000 cars off the road, orplanting 3.6 million trees – andgenerate 77 MW of electricity forthe Australian national grid, whichis enough to power 48,000 homesper year.In South Africa, our New Denmarkmine has helped to design anddevelop a ‘world first’ mobile flaringsystem that will reduce its annualmethane emissions from ventilationboreholes by an expected 15%.Flaring burns off methane, renderingit 18.5 times less harmful to theenvironment than venting. Underthe Kyoto Protocol, methane flaringis an eligible Clean DevelopmentMechanism activity. The projectcould therefore generate more than$8 million in revenue in its firstdecade through the sale of CertifiedEmission Reduction (CER) credits,depending on prevailing CER prices.Another facet to this challenge isthe ventilation systems, which runcontinuously and require significantenergy. At Goedehoop mine wehave reduced our GHGs related toventilated air methane by improvinghow we manage these systems. Byisolating the areas underground thatrequire ventilation and identifyingand addressing any leaks, we havereduced the amount of methaneflushed out of the machinery aswell as the electricity required to runthe ventilation system. Ventilationsystems at other underground minesin Thermal Coal are also set to beoptimised, contributing greatlytowards our 2015 ECO 2 MAN targets.ImageSenior project manager Ellis Lawrie (foreground) andEnergy Developments Limited project managerMichael Ball inspect a gas engine at the Capcoalunderground waste coal mine gas power station.Operating and financial review<strong>Anglo</strong> <strong>American</strong> plc <strong>Annual</strong> <strong>Report</strong> <strong>2012</strong> 31
OPERATING AND FINANCIAL REVIEW STRATEGY IN ACTIONSTRATEGIC ELEMENT: Employing the best peopleWORKING WITHCOMMUNITIESWITH THE FUTURE IN MIND32 <strong>Anglo</strong> <strong>American</strong> plc <strong>Annual</strong> <strong>Report</strong> <strong>2012</strong>
We offer a range of housing optionsto our South African mineworkers aspart of our broader strategy to improvethe living conditions of our employees.IMPROVING HOUSING IN SOUTH AFRICAWe want all our employees to enjoy quality housingand living conditions. In South Africa, where thereis a shortage of affordable housing and longwaiting lists for units being built, this is a particularchallenge. In partnership with local and provincialgovernment, we help to alleviate this problem.We invest in improving the housing and livingconditions of employees and making it possiblefor them to buy their own homes in sustainableareas near our mining operations. Our vision isthat all of our employees in mining communitieswho would like family accommodation havethat option.Our Platinum, Iron Ore, Thermal Coal businessesand De Beers proactively engage in developingproperly serviced land to facilitate housingdevelopment in areas where services areinadequate or do not exist. The business unitscollaborate with reputable developers toencourage and promote affordable homeownership among employees at all levels. Wherepossible, land is donated to the municipality tofacilitate the rehousing of communities residingin informal settlements. We engage with theChamber of Mines and with organised labour toaddress issues and options for home ownership.While 11,648 employees currently reside in mineaccommodation, our objective is to lessenemployee dependency on the company toprovide accommodation.Thermal Coal• Currently 33% of employees live inmine-provided accommodation.• 203 houses have been built for saleto date.• A new project to provide an additional272 units in the eMalahleni areahas commenced.De Beers• De Beers has no hostels at itsthree South African operations.• Currently engaging with South Africa’sNational Union of Mineworkers (NUM)regarding the facilitation of homeownership.• Approximately 550 houses planned tobe built across three operations andinvestigations on rent-to-buy optionsare under way.11,648EMPLOYEES AT OUR SOUTH AFRICANOPERATIONS STAYING IN MINEACCOMMODATION.Platinum• 6,743 employees reside in companyand privately leased houses.• All hostels have been converted intosingle accommodation villages.• There are four ongoing housing projectsin its portfolio.Iron Ore• From March <strong>2012</strong>, employees no longerstay in hostels.• Sishen has built 1,662 houses toaccommodate their employees.• Sishen plans to build an additional 1,720houses in Kathu for current and futurehousing needs.“As an industry, we need to work withour stakeholders to discuss openlyhow the migrant labour system canbe changed to create moresustainable lives and communities.”Cynthia CarrollChief Executive01Main Platinum Unionsouth mine time andattendance operatorGift Mpho takespossession of one ofthe 400 new housesbeing built at theNortham Extension 6Housing Project.01 These housesfor Thermal Coalemployees and theirfamilies are beingbuilt with bricksmade partly fromgypsum – whichwas formerlydiscarded as awaste product –from theeMalahleniwater-treatmentplant.Operating and financial review<strong>Anglo</strong> <strong>American</strong> plc <strong>Annual</strong> <strong>Report</strong> <strong>2012</strong> 33
OPERATING AND FINANCIAL REVIEW STRATEGY IN ACTIONSTRATEGIC ELEMENT: Employing the best peopleTHE RIGHT PEOPLEIN THE RIGHT PLACESOUR PEOPLEOur people are as vital to oursuccess as our mining assets.They determine how effectivelywe operate, represent our valuesand are critical to building andmaintaining our reputation withstakeholders. Ultimately, it isour people who will realise ourambition and deliver on ourstrategy of being the leadingglobal mining company.OUR STRATEGY ANDMANAGEMENT APPROACHOur human resources (HR) strategyis anchored in <strong>Anglo</strong> <strong>American</strong>’sobjective ‘to be the leading globalmining company’ and in supportingthe objective of being ‘the employerof choice’. We see the quality ofour people as a key source ofcompetitive advantage.To attract and retain the best peoplewe need to:• Demonstrate that we have a clearand compelling strategy for success• Offer safe, worthwhile andstimulating work• Be organised for effectivenessand efficiency• Maintain the right leadership culture• Support people to develop andprogress• Pay people competitively.The Group HR function operates aspart of a lean corporate centre andfocuses on: essential governance;capturing synergies across the Group;and sharing knowledge and expertise.Policies and standards are set througha collaborative process involving thebusinesses. Once set, compliancewith these is mandatory. Along withthese standards, our HR managementsystems and processes provide thefoundation that allows us to deliver onour HR agenda.We are implementing a wide-rangingthree year plan of work to furtherimprove these foundations.Resourcing with thefuture in mindHaving the right people in placeis vital to achieving our businessobjectives. Within the context of avery competitive job market, ensuringwe understand our current and futureskills needs, and actively drive plans tomeet these, is a key strategic priorityfor HR. Throughout 2011 we put inplace foundations to enable moreeffective workforce planning. Thisincluded a Group-wide monthlyheadcount reporting process andsystem and a common frameworkfor categorising roles across theorganisation. During <strong>2012</strong>, we builton these foundations, implementinga new annual strategic workforceplanning process and system thatran successfully to support the <strong>2012</strong>planning cycle.Our improved workforce planningcapability will play a pivotal role intargeting our talent sourcing activitiesand guiding the work we do to buildglobal talent pools. Talented graduates,bursars, interns, apprentices andother trainees form an important partof our sourcing strategy. During <strong>2012</strong>,we saw nearly 3,000 graduates,bursars, apprentices and othertrainees supported by the company.At certain of our operations we arelegally required to recruit a percentageof mining related roles from within theimmediate and local communitiesin which we operate. The recentimplementation of text-based jobapplications has enabled us to moreeffectively access communitymembers in remote locationsparticularly across South Africa.Supporting our people todevelop and progressManaging our people’s performanceplays a key role in guiding theirbehaviour and development. During<strong>2012</strong> we continued to roll out ourGroup-wide performancemanagement process and system,which aligns individual objectiveswith the company’s strategy whilereinforcing our values. Ourmanagement and professionalemployees have regular performanceand career development reviews withtheir managers. For the remainingemployees, performancemanagement is largely team-based.Number of permanent employeesand contractors by region (1)<strong>2012</strong>Africa 97,298Europe 396North America 583South America 31,319Australia 6,619Asia 104(1)Excludes associates and OMI non-core operations.Alongside our performancemanagement process, we continued toembed the People Development Way,our global capability frameworkdetailing the behaviours, knowledge,skills and experience required of ouremployees to achieve our strategicobjectives. <strong>2012</strong> also saw theintroduction of career path tools aimedat guiding employees’ careerdevelopment decisions.Formal learning is delivered at bothbusiness unit and Group level withexternal training expenditure across<strong>Anglo</strong> <strong>American</strong> amounting to$98 million, 3% of total employeecosts in <strong>2012</strong> (2011: $79 million,2.2% of total employee costs). Thecontinued development of first-linemanagers to improve operational andpeople management capabilities hasbeen the focus of <strong>2012</strong>. The first-linemanagers development programmebuilds on current best practice acrossthe Group and will be rolled outduring 2013.The Adult Basic Education andTraining programme, which is run byour businesses and corporate centreoffice in South Africa provides generaleducation to adults who have not hadaccess to formal schooling. In <strong>2012</strong>,1,239 employees, contractors andcommunity members enrolled inthe programme. In addition, 2,638employees and community memberswere provided with portable skills34 <strong>Anglo</strong> <strong>American</strong> plc <strong>Annual</strong> <strong>Report</strong> <strong>2012</strong>
training. This puts emphasis on trainingpeople in skills not traditionally neededwithin the company, so that they areemployable after mine closure.Building leadership capabilityWe see strong leadership andmanagerial capabilities as central toachieving our business objectives andsustained success in the mining sector.Beyond capability, we see maintainingthe right leadership culture as critical toencouraging people to want to workwith <strong>Anglo</strong> <strong>American</strong>. For this reasonwe focus on and continuously reviewhigh quality leadership developmentand have a range of over 200external and internal developmentprogrammes currently in use acrossthe Group.Recognising and rewardingperformanceIt is important to our success that thestructure and level of our remunerationand rewards are consistent across theGroup and competitive in each ofthe markets within which we operate.We benchmark our remunerationschemes against our peers andimplement comprehensiveperformance-based reward systemswith the aim of attracting and retainingthe best people.Creating a diverse organisationBy year end, 23% of managers werewomen, representing an increasefrom 22% in 2011. 15% of our overallworkforce is female. Across ourbusinesses, targets have beenset to increase further femalerepresentation, both within themanagement population and theworkforce as a whole.In our South African operations wecontinued to promote transformationin the workforce. By year end, 62% ofour management were ‘historicallydisadvantaged South Africans’(HDSAs), representing a significantincrease on the 51% recorded atthe end of 2011. HDSA employees,including white women, represent80% of our workforce as a whole inSouth Africa.Across ourbusinesses,targetshave beenset to increasefurther femalerepresentation,both within themanagementpopulation andthe workforceas a whole.Fostering sound industrialrelationsDuring <strong>2012</strong>, two strikes exceedingone week’s duration were recorded.Platinum experienced eight weeksof illegal industrial action and unrest atfive of its mines where operations werehalted. Kumba Iron Ore experienced12 days’ unprotected occupation of thecompany’s Sishen Mine.Approximately 84% of our permanentworkforce is represented by workcouncils, trade unions or other similarbodies and covered by collectivebargaining agreements. The nature ofthese agreements varies by countryof operation. However, protecting therights of employees and ensuring fairand compliant employment practicesare principles that apply to everyonewho is employed by <strong>Anglo</strong> <strong>American</strong>,regardless of any recognised,formal representation employeesmay form part of for collectivebargaining purposes.Building and maintaining soundrelationships with our employees andtrade unions is fostered through:• A culture of inclusivity and,consistent with our company value ofcare and respect, a genuine concernfor the well-being of our employees,partners and communities.• Ongoing, open and meaningfuldialogue, ensuring that relevantchanges to the organisation or itspractices are tabled with tradeunions for discussion prior to theirimplementation and that, in turn, anyemployee concerns are broughtfor discussion with the organisationbefore they become the subjectof disputes.• Our appreciation of the fact thatmany of the issues affecting ouremployees are issues that affect therest of the mining sector and, in somecases, society as a whole. In theseinstances, as a responsible corporatecitizen, we have a broader role to playin tabling and positively influencingdiscussion and issue resolution.A significant part of our operationalworkforce consists of contractors;therefore, the effectiveness of therelationships between us and ourcontracting companies, and betweenthose companies and their employees,will remain important.Protecting labour rightsAs signatories to the United NationsGlobal Compact, we are committedto the labour rights principlesprovided in the International LabourOrganisation core conventions,including the right to freedom ofassociation and collective bargaining,the eradication of child and forcedlabour and non-discrimination. Wedo not tolerate any form of unfairdiscrimination, inhumane treatment,forced labour, child labour, harassmentor intimidation in the <strong>Anglo</strong> <strong>American</strong>workplace. Full observance of theseissues is also required of our suppliersin tenders and compliance is audited.At our operations, we have clearpolicies and processes in place inorder to ensure that we do not employany underage or forced labour. Noincidents of employing under-age orforced labour were reported in <strong>2012</strong>.Operating and financial review<strong>Anglo</strong> <strong>American</strong> plc <strong>Annual</strong> <strong>Report</strong> <strong>2012</strong> 35
OPERATING AND FINANCIAL REVIEW RESOURCES AND TECHNOLOGYINNOVATINGSOLUTIONSWITH THE FUTURE IN MIND36 <strong>Anglo</strong> <strong>American</strong> plc <strong>Annual</strong> <strong>Report</strong> <strong>2012</strong>
Thermal Coal’s flexible conveyortrain is set to be a game-changerin the safe and efficient productionof coal from underground mines.FLEXIBLE CONVEYOR TRAINSETS NEW RECORDIn producing 116,708 tonnes in September <strong>2012</strong>,the 110-metres-long flexible conveyor train (FCT)based underground at Greenside achieved thehighest monthly coal output ever recordedoutside the US.Developed in conjunction with Joy MiningMachinery, the FCT is a continuous haulagesystem that eliminates bottlenecks, thusallowing continuous miners to operate atmaximum capacity.The key to the FCT’s effectiveness is its flexibleconveyor and traction system that permits it tobe operated, by remote control, as a single unit.The ability to continuously convey materialalong its entire length, while simultaneouslymoving to follow the continuous miner’s everymove, offers a distinct advantage over all othertypes of haulage.The FCT also offers safety benefits througheliminating the need for shuttle cars, therebyreducing vehicle and pedestrian interaction.25 %PRODUCTIVITY IMPROVEMENTIN CONTINUOUS MINER OUTPUTTARGETED BY 2014.HIGHEST MONTHLY PRODUCTION IN <strong>2012</strong>+116,708 tonnesTo achieve the targeted productivity increase, Greenside mustaverage 116 kt per month.117 kt100 kt116 kt102 ktSept <strong>2012</strong> Oct <strong>2012</strong> Nov <strong>2012</strong> Dec <strong>2012</strong>Operating and financial review01“The Greenside FCT project team areamong the most competent people inthe business.”Avery BaileyFCT specialist02“The FCT’ssuccessfulintroductiondemonstrates thevalue being deliveredfrom Thermal Coal’stechnology partnerships; this systemhas the potential to transform ourunderground coal mining operationsin South Africa.”Godfrey GomweCEO, Thermal CoalMain, 01 and 02Members of theGreenside teamwho assisted inthe successfulimplementationof the mine’s 110metre long flexibleconveyor train –the first of its kindin South Africa.<strong>Anglo</strong> <strong>American</strong> plc <strong>Annual</strong> <strong>Report</strong> <strong>2012</strong> 37
OPERATING AND FINANCIAL REVIEW RESOURCES AND TECHNOLOGYINNOVATION TODELIVER VALUEOUR RESOURCESThe resources <strong>Anglo</strong> <strong>American</strong>considers critical to achievingits strategic aims include:• Knowledge and expertise.• Proved and Probable Reserves(a summary is contained onpages 192–193).Full details of the Group’s OreReserves and Mineral Resourcesestimates are found on pages191–230.TECHNOLOGYOur strong in-house technologycapability provides world classsolutions to <strong>Anglo</strong> <strong>American</strong> andits global operations. Miningand Technology, which comprisesseven highly specialisedtechnical groups that concentratetheir expertise in specific valueaddingareas, made a significantcontribution to the Group onseveral fronts.In collaboration with the business units,the heads of the Mining, Metallurgy,Geosciences and Engineeringdisciplines have finalised a global setof Group Technical Standards andassociated guidelines aimed atenhancing project delivery, sharingbest practice, optimising value addedto operations and mitigating technicalrisks. Gap analyses are conductedby business units and operations todetermine compliance with thestandards, and plans are being put inplace to address any gaps that havebeen identified. The discipline headswith their team of experts continueto provide technical assurance toprojects and support the identificationof significant asset optimisationopportunities at the operations.The effective development andmanagement of technical talent withinthe Group has also been a focal point.Our Technical Solutions divisionsupports business units, operationsand project teams as well as thevarious Group functions across theentire mining value chain, fromexploration to mine closure. Thedivision provides fundamentalresearch as well as development andpiloting services. Multi-disciplinaryteams are made up of in-houseexperts from all the traditionalengineering disciplines, as well asmining, metallurgy, geometallurgy,process and chemistry, industrialengineering, materials handling,safety, occupational health,sustainable development, geophysics,hydrogeology, and quality andcompliance. In addition, projectengineering and change managementspecialists provide consulting servicesto our operations. The teams alsodevelop and implement or assistoperations with the implementationof techno-economic solutions. TheField Services section provideshands-on machine health monitoringexpertise to operations.Technical Solutions recentlydeveloped and is now implementingan integrated drill and blast solution forsurface operations comprising mineplanning, drill and hole monitoring,on-bench explosive quality testingas well as on-bench blast monitoringand analysis. The solution providesoperations with the capability toreconcile actual performance withdesigned performance, in real time,which increases the visibility of actualbottlenecks and allows enhanceddecision making at the mine site. TheEquipment Monitoring System (EMS),aimed at identifying equipmentcondition remotely, has successfullybeen rolled out to sites in Australia,South America and South Africa andhas been expanded from haul truckmonitoring to monitoring other criticalequipment. An integrated watermanagement solution has beendeveloped to meet the growing needsof the Group’s operations in this area.On the fundamental research side,Technical Solutions has successfullycombined molecular modelling withfast track chemical effectivenessevaluation to quickly identify non-toxicand more effective reagents withouthaving to rely on traditional trial anderror experimentation.Our Technology Development unitmanages, coordinates and integratestechnology development acrossthe Group. Progress continues onrealising <strong>Anglo</strong> <strong>American</strong>’s long termtechnology vision and is concentratedon laying the platform for a radicalchange in technology over the comingyears. The work focuses on long term,high value projects in undergroundmining, metal recovery and energyefficiency, as well as the shorterterm demonstration of automationtechnologies to improve safety andadd value.A concertedsystemsapproachhas now beenadopted inorder tofacilitatemining’stransition to amore modern,automated andtechnologicallymature era.38 <strong>Anglo</strong> <strong>American</strong> plc <strong>Annual</strong> <strong>Report</strong> <strong>2012</strong>
Mine life per commodity (1)Years, minimum to maximum6 to 242 to 358 to 265 to 703 to 304 to 2717 to 220 Range (years) 70Iron oreMetallurgical coalThermal coalCopperNickelPlatinumDiamonds(1)Mine life is the extraction period in years for scheduledOre Reserves comprising Proved and ProbableReserves only. For diamonds, life of mine (years)is reported and is based on scheduled ProbableReserves including Indicated and some InferredResources considered for life of mine planning.Note: the 30 years for platinum is due to 30 yearsbeing the maximum number of years for which amining right is granted in South Africa.The development of proprietaryexploration tools remains a priority,with some already in use and improvedmodels undergoing testing prior to thepiloting of prototypes. These provide asignificant competitive advantage for<strong>Anglo</strong> <strong>American</strong> in the search for newTier One orebodies.The shorter term projects will seevarious automated vehicles beingdemonstrated at certain opencastmines during 2013 and multiple novelunderground mining machines beingtested on platinum mines. Successin these projects would make asignificant impact on the safety andcompetitiveness of Group operations.A concerted systems approach hasnow been adopted in order to facilitatemining’s transition to a more modern,automated and technologically matureera. Effort is being concentrated oncreating the necessary building blocksto support both open pit andunderground methods in steadilymoving up the steps towardsautomation maturity. In particular,attention is currently being placed,inter alia, on automation-specifictechnologies such as undergroundmapping, positioning and obstacledetection. Emphasis, too, is beingplaced on integrated operationscentres as the hub of the automationapproach needed to commandintegrated data in a risk-managedenvironment in order to deliverimproved performance, as well as tocoordinate and drive sustainableperformance improvement.Our Thermal Coal business hasidentified 15 technologies in orderto form a prioritised pipeline fortechnology development. During <strong>2012</strong>,Thermal Coal achieved a number oftechnology milestones and is the firstcoal mining company in South Africato commission Flexible ConveyorTrain technology (FCT) undergroundat Greenside and Goedehoop. Theimplementation of the technologyresulted in a marked reduction inunderground coal transport vehicles,thereby significantly improving safetywhile also increasing productivity.Thermal Coal has started the journeyof automation of some of the opencastfleets, including articulated dumptrucks, overburden drills andbulldozers. Furthermore, automationprovides opportunity forimprovements in utilisation,productivity and quality, as well assafety and health.At our Metallurgical Coal business,we are making progress in severalareas on the technological front. The‘Smart Cap’ fatigue-managementsystem has moved to thecommercialisation phase. Significantwork has been undertaken to reducecarbon emissions from theunderground mines through improvedmonitoring, capture and utilisation ofpotential fugitive emissions. Remotemonitoring of equipment health andperformance has been embeddedthrough the Brisbane-basedBenchmark Performance Centre,where the health and performanceof both open cut and undergroundequipment is being monitored andactions taken to improve performance.In coal processing, laboratory scaletrials have been completed onenhanced processing for coalswith high inherent ash and clay; ifsuccessful, our reserves base ofhigh quality metallurgical coal couldpotentially increase.Operating and financial review<strong>Anglo</strong> <strong>American</strong> plc <strong>Annual</strong> <strong>Report</strong> <strong>2012</strong> 39
OPERATING AND FINANCIAL REVIEW RESOURCES AND TECHNOLOGYEXPLORATIONGlobal exploration activity for <strong>2012</strong>focused on greenfield projects acrossa number of mature and frontierlocations, as well as on adding value,through increasing resources andreserves, to our operations andadvanced projects. Our explorationexpenditure in <strong>2012</strong> amounted to$206 million and covered 18 countries.Iron Ore exploration expenditure of$23 million was concentrated aroundoperations and projects in Africa,Australia and Brazil. In South Africa,exploration was undertaken to supportKumba’s Sishen and Kolomelaoperations; reconnaissance drillingon high priority targets confirmedmineralisation and drilling capacity hasbeen increased to further investigatetheir potential. In Brazil, activity relatedto preliminary drilling and geologicalactivities around the Minas-Rio project.Metallurgical Coal explorationexpenditure of $18 million focusedon drilling, seismic surveys, andcoal quality analysis near existingoperations in Australia and Canadawith the aim of improving thedefinition of additional coking coalresources. In Australia, drilling andseismic activities were performed,including at the Foxleigh and RolfeCreek projects. In Canada, theexploration team was strengthenedat the Peace River Coal Trend mineand surrounding exploration leases,with the aim of defining additionalcoking coal resources.Thermal Coal exploration expendituretotalled $14 million, being spentprimarily on drilling and analysis inSouth Africa. During <strong>2012</strong>, explorationdrilling was undertaken at 10 projectareas, with the objectives of meetingboth statutory work programmerequirement as well as providinggeological evaluation informationand geological models for projectadvancement through the variousstage gates.Exploration expenditureby commodity in <strong>2012</strong>Iron Ore$23 mMetallurgical Coal $18mThermal Coal$14 mCopper $39mNickel $32mPlatinum $4mPhosphates and Niobium$2 mDiamonds $23mCentral exploration activities $51mCopper exploration expenditureof $39 million consisted mainly ofnear-mine and greenfields explorationdrilling in Chile where key activitiesincluded drilling at Los Broncesand Mantos Blancos. Greenfieldsexploration was also conducted inArgentina, Brazil, Chile, Colombia,Greenland, Indonesia, Peru, the USand Zambia.Polymetallic (copper-nickel-platinumgroup elements) explorationexpenditure (included within the Nickelcommodity line as disclosed in note 7to the financial statements) amountedto $28 million and concentrated onSakatti in northern Finland. Explorationat this advanced project aimed todefine the limits of the orebody andto test other surrounding high prioritytargets. Greenfields polymetallicexploration was conducted elsewherein northern Finland, western Brazil, theMusgraves region of Western Australiaand the Canadian Arctic.Nickel exploration expenditurewas $4 million and related mainlyto nickel laterite exploration in theMorro Sem Boné district in Brazil.Elsewhere, near-mine explorationwas undertaken at Niquelândia(Codemin), also in Brazil.Phosphates and Niobium explorationexpenditure was $2 million andwas focused on greenfields projectsin central Brazil and near-mineexploration at Boa Vista (niobium).Platinum exploration accountedfor $4 million and was focused oninvestigating new opportunities withinSouth Africa’s Bushveld Complexand on fulfilling of the statutory workprogramme requirements to keeptenure in good standing. Thepotential for shallow resourcesthat may be mined using opencastmethods was investigated throughdrilling programmes during the year.Platinum exploration continued atUnki in Zimbabwe.Since acquisition in August <strong>2012</strong>,De Beers has spent $23 million($59 million for the full year, on a 100%basis) on exploration programmes inAngola, Botswana, Canada and India.The exploration team continued toprovide technical services to theresource extension programmesfor the Jwaneng and Orapa minesin Botswana, and the Victor minein Canada.40 <strong>Anglo</strong> <strong>American</strong> plc <strong>Annual</strong> <strong>Report</strong> <strong>2012</strong>
Globalexplorationactivity for<strong>2012</strong> focusedon greenfieldprojects acrossa numberof matureand frontierlocations,as well ason addingvalue, throughincreasingresources andreserves, toour operationsand advancedprojects.HIGH-TECH EXPLORATION IN FINLANDOperating and financial review01020403A Low Temperature SuperconductingQuantum Interference Device(LT-SQUID) is a very sensitivemagnetometer that is capable ofmeasuring and distinguishingbetween discrete magnetic responsesusing superconducting loops. TheLT-SQUID is considered particularlyuseful for discriminating betweenmetallic deposits such as nickelsulphides, which can be maskedby certain rock types that can alsohold an electric current – forexample, shale.The LT-SQUID was developedin collaboration between <strong>Anglo</strong><strong>American</strong> and the Institute forPhysical High Technology (IPHT)in Jena, Germany. The LT-SQUIDis the sensor, cooled using liquidhelium (-298°C), and measures theresponse to an electromagneticcurrent response after the currenthas been transmitted into the ground.The LT-SQUID has been employedby <strong>Anglo</strong> <strong>American</strong> field teams tohelp search for so-called blinddeposits that have no visibleexpression on the ground surface.It has revolutionised how we look atand model the picture beneath theground surface, particularly at depth.This has enabled <strong>Anglo</strong> <strong>American</strong>to discover significant depositssuch as Gamsberg East (zinc)in Namaqualand, South Africa.Conventional TransientElectromagnetic (TEM) methodswould not have been enable toidentify the flat-lying metallicconductor located 250 metresbeneath the ground surface, ordistinguish between two metallicsulphide types that have differentlevels of electromagneticconductance. The LT-SQUID sensoralso helped to define the geometricdimensions of the Gamsberg Eastdeposit as it enabled a greaterpenetration depth to be reached.Another example is at the Sakattipolymetallic project in Finland.Owing to the highly conductive natureof the interconnected mineralisationat the project, normal TEMgeophysical techniques were notable to provide accurate readings.The team then used the LT-SQUIDsystem, and that informationultimately supported the discoveryof the main mineralised body.Images01 Project geoscientist Circé Malo-Lalandewith the LT-Squid.02 Exploration manager Mattias Johansson(foreground) and exploration geologistCraig Hartshorne examine drill cores.03 Drilling in progress at the Sakatti drill site.04 Drill operators Jarmo Kairaaja (left), andTiejo Apukairaasa on Sakatti rig No. 8.<strong>Anglo</strong> <strong>American</strong> plc <strong>Annual</strong> <strong>Report</strong> <strong>2012</strong> 41
OPERATING AND FINANCIAL REVIEW GROUP FINANCIAL PERFORMANCEFINANCIALPERFORMANCEUNDERLYING OPERATING PROFIT(2011: $11.1 bn)$6.2 bnUNDERLYING EARNINGS(2011: $6.1 bn)$2.8 bnUNDERLYING EARNINGSPER SHARE(2011: $5.06)$2.26(LOSS)/PROFIT ATTRIBUTABLETO EQUITY SHAREHOLDERS(2011: $6.2 bn)$(1.5) bnREVIEW OF GROUP RESULTS<strong>Anglo</strong> <strong>American</strong> reported underlyingearnings of $2.8 billion, comparedwith $6.1 billion in 2011, withunderlying operating profit of$6.2 billion, 44% lower than 2011.This decrease in underlying operatingprofit was mainly driven by thePlatinum, Metallurgical Coal, Iron Oreand Manganese and Copper businessunits, whose financial performancewas affected by lower prices andhigher costs, with the exception ofMetallurgical Coal where costsdecreased. There was a decline inrealised prices across the majority ofcommodities produced by the Group.Iron Ore and Manganese generatedan underlying operating profit of$2,949 million, 33% lower. Within thiscommodity group, Kumba Iron Orereported an underlying operatingprofit of $2,980 million, 34% lowerthan 2011, owing to lower averageprices, the unprotected strike atSishen and an increase in wastestripping, partially offset by the rampup of Kolomela mine. Samancorreported an underlying operatingprofit of $103 million, 38% lower,driven by lower ore prices, partiallyoffset by lower costs.Metallurgical Coal delivered anunderlying operating profit of$405 million, a 66% decrease,primarily due to lower realised exportselling prices, partially offset by recordproduction and higher sales.Thermal Coal’s underlying operatingprofit of $793 million was 36%lower, mainly as a result of lowerexport thermal coal prices for bothSouth African and Colombian coaland, in South Africa, above inflationcost increases. This was partiallyoffset by increased sales volumes,mainly from the full incorporation ofZibulo as an operating asset, anddespite the closure of high costproduction sections.Copper delivered an underlyingoperating profit of $1,687 million,31% lower, as a result of lower realisedsales prices, lower by-productquantities and higher operating,exploration and study costs, partlyoffset by increased sales volumes.Nickel reported an underlyingoperating profit of $26 million, 54%lower, due to lower realised pricesand an extended export ban imposedby the Venezuelan government fromthe beginning of June <strong>2012</strong> resultingin the cessation of production inSeptember <strong>2012</strong>, partially offset by aself-insurance recovery of $59 million.Platinum generated an underlyingoperating loss of $120 million, due tolower metal prices, higher unit costsand the illegal strike that significantlyaffected production and sales duringthe final four months of the year,partially offset by a $172 millionpositive stock adjustment.Diamonds underlying operating profit(on a 100% basis) fell by $676 millionto $815 million, 45% lower, reflectingthe impact of difficult tradingconditions brought about bypredominantly weaker demand andchanging product requirements fromSightholders. <strong>Anglo</strong> <strong>American</strong>’s shareof De Beers underlying operating profittotalled $496 million, a decrease of25%, the overall reduction being partlyoffset by <strong>Anglo</strong> <strong>American</strong>’s highershareholding.Other Mining and Industrial Coredelivered a combined underlyingoperating profit of $169 million, adecrease of 8% compared to theprior year. This was driven by higherlabour costs at both the Phosphatesand Niobium operations and lowerphosphate prices, partiallyoffset by an increase in sales volumesof both phosphates and niobium.Production change% change versus 2011(8%)(11%)1%4%11%10%35%-20 -10 0 10 20 30 40Kumba Iron OreMetallurgical CoalThermal CoalCopperNickelPlatinumDiamondsProductionincreases weredelivered atthe KumbaIron Ore,MetallurgicalCoal, ThermalCoal, Copper,Nickel, and thePhosphatesand Niobiumbusiness units.42 <strong>Anglo</strong> <strong>American</strong> plc <strong>Annual</strong> <strong>Report</strong> <strong>2012</strong>
Underlying operating profit$ millionUnderlying operating profit from thenon-core businesses was $168 million,a $37 million increase, due to lowerdepreciation as a result of thetransfer of Tarmac Quarry Materialsand Scaw South Africa to ‘held for sale’and the reversal of penalty provisionsat Amapá which were in place at theend of 2011, partly offset by lowerrealised iron ore prices at Amapá.Exploration costs for the year were$206 million, a 70% increase, mainlydriven by the inclusion of explorationcosts at De Beers (following theacquisition of the additional 40%interest), increased drilling due tofavourable weather conditions inAustralia and Chile, and a ramp upin drilling activities at the Sakattipolymetallic project in Finland.Corporate costs (after cost allocations)of $203 million were incurred in <strong>2012</strong>.In 2011, following the reassessment ofestimates of likely outcomes of existinginsurance claims, liabilities decreasedsignificantly in the insurance captive,offsetting the unallocated corporatecosts and resulting in an operatingprofit for 2011 of $15 million.ProductionProduction increases weredelivered at the Kumba Iron Ore,Metallurgical Coal, Thermal Coal,Copper, Nickel, Phosphates andNiobium business units.Year ended31 Dec <strong>2012</strong>Year ended31 Dec 2011Iron Ore and Manganese 2,949 4,400Metallurgical Coal 405 1,189Thermal Coal 793 1,230Copper 1,687 2,461Nickel 26 57Platinum (120) 890Diamonds 496 659Other Mining and Industrial 337 315Exploration (206) (121)Corporate activities and unallocated costs (203) 15Operating profit including associates before special itemsand remeasurements 6,164 11,095Iron Ore and Manganese – productionof iron ore increased by 4% to 43.1 Mtdue to the ramp up of Kolomela,partially offset by the unprotected strikewhich resulted in lost production ofapproximately 5 Mt. Manganese oreproduction increased by 20% to 3.3 Mt.Metallurgical Coal – productionincreased by 11% to 30.6 Mt, withrecord metallurgical coal productionof 17.7 Mt, benefiting fromproductivity improvements at boththe open cut and undergroundoperations and a reduction in weatherrelated stoppages.Thermal Coal – production improvedby 1% to 68.7 Mt, despite the closureof high cost production sections inSouth Africa, driven by the Zibuloramp up and strong operationalperformance supported by favourableweather conditions at Cerrejón.Copper – production increased by10% to 659,700 tonnes, mainly owingto the ramp up of the Los Broncesexpansion project, partly offsetby expected lower ore grades atCollahuasi and operationalchallenges at the Los Bronces mineand at Collahuasi.Nickel – production increased by 35%to 39,300 tonnes due to the ramp up ofBarro Alto, partially offset by thecessation of production at Loma deNíquel from September <strong>2012</strong>.Platinum – equivalent refinedproduction was 8% lower than 2011mainly due to the illegal strike actionthat occurred between September andNovember <strong>2012</strong> at the Rustenburg,Amandelbult, Union and Bokoni minesand operational challenges in the firsthalf of the year.Diamonds – production decreasedby 11% to 27.9 million carats, withDebswana production impacted bythe Jwaneng slope failure. In lightof prevailing rough diamondmarket trends, and in keeping withDe Beers’ stated production strategyfor <strong>2012</strong>, operations continued tofocus on maintenance and wastestripping backlogs.Phosphates – record productionof 1.1 Mt of fertiliser, a 5% increaseyear on year, due to a number ofasset optimisation initiatives whichimproved overall performance atCatalão and Cubatão.Niobium – production increased 13%,as declining ore quality was more thanoffset by improvements in boththroughput and recoveries.FINANCIAL OVERVIEWGroup underlying operating profit was$6,164 million, 44% lower than 2011.The main reason for the reduction inunderlying operating profit was adecline in the realised prices of mostof the commodities produced by theGroup. These included falls in realisedprices of 29% in the case of exportmetallurgical coal, 19% in SouthAfrican export thermal coal and 23%in iron ore.The Group’s results are affected bycurrency fluctuations in the countrieswhere the operations are based. Thestrengthening of the US dollar againstthe South African rand and the Brazilianreal resulted in a $945 million positiveexchange variance in underlyingoperating profit compared to 2011. CPIinflation had a negative $591 millionimpact on underlying operating profitcompared to the prior year.Sales volumes were higher than 2011,owing to increased production atKolomela and Los Bronces as theexpansion projects ramped up,offset by operational issues at theLos Bronces mine and Collahuasi, asOperating and financial review<strong>Anglo</strong> <strong>American</strong> plc <strong>Annual</strong> <strong>Report</strong> <strong>2012</strong> 43
OPERATING AND FINANCIAL REVIEW GROUP FINANCIAL PERFORMANCEwell as the industrial action at Kumbaand Platinum and the extended banand subsequent loss of miningconcessions at Loma de Níquel.Industry-wide, above-CPI costpressures continued, particularly inSouth Africa and Australia, althoughwere mitigated by the continuedpositive performance of our assetoptimisation and procurementprogrammes.Group underlying earnings were$2,839 million, a 54% decreaseon 2011, which reflects the operationalresults above and a reduction inour shareholding in <strong>Anglo</strong> <strong>American</strong>Sur (AA Sur), partially offset by theincreased holding in Kumba Iron Ore.Net finance costs, beforeremeasurements, excludingassociates, were $288 million(2011: $20 million).The effective rate of tax, before specialitems and remeasurements andincluding attributable share ofassociates’ tax, increased from 28.3%in 2011 to 29.0%.Group underlying earnings per sharewere $2.26 compared with $5.06in 2011.Special items andremeasurementsOperating special itemsMinas-RioAn impairment charge of$4,960 million has been recorded inrelation to the Minas-Rio iron oreproject (Iron Ore Brazil). Of this charge,$1,105 million has been recordedagainst goodwill and $3,855 millionhas been recorded against miningproperties, with an associated deferredtax credit of $960 million. The post-taximpairment charge is $4,000 million.Platinum operationsThe impairment charge of $860 millionrelates to certain Platinum projectsand other assets, not in use, that arenot considered economically viable inthe current market environment. Thecharge includes a write-off of fair valueuplifts associated with these assetsheld at a Group level of $89 million.Reversal of De Beers inventory upliftInventory held by De Beers at the dateof the acquisition is required to berecognised at fair value underInternational Financial <strong>Report</strong>ingStandards (IFRS). This results inSummary income statement$ millionYear ended31 Dec <strong>2012</strong>Year ended31 Dec 2011Operating profit before special items5,405 9,668and remeasurementsOperating special items (6,977) (164)Operating remeasurements (116) (65)Operating (loss)/profit from subsidiaries and joint (1,688) 9,439venturesNon-operating special items and remeasurements 1,394 183Share of net income from associates432 977(see reconciliation below)Total profit from operations and associates 138 10,599Net finance costs before remeasurements (288) (20)Financing remeasurements (89) 203(Loss)/profit before tax (239) 10,782Income tax expense (375) (2,860)(Loss)/profit for the financial year (614) 7,922Non-controlling interests (879) (1,753)(Loss)/profit for the financial year attributable(1,493) 6,169to equity shareholders of the CompanyBasic earnings per share ($) (1.19) 5.10Group operating profit including associatesbefore special items and remeasurements (1) 6,164 11,095Operating profit from associates before special itemsand remeasurements759 1,427Operating special items and remeasurements (58) (18)Net profit on disposals – 20Net finance costs (before special items and remeasurements) (58) (48)Financing special items and remeasurements 1 (7)Income tax expense (after special items and remeasurements) (205) (384)Non-controlling interests (after special items and remeasurements) (7) (13)Share of net income from associates 432 977(1)Operating profit before special items and remeasurements from subsidiaries and joint ventureswas $5,405 million (2011: $9,668 million) and attributable share from associates was $759 million(2011: $1,427 million). For special items and remeasurements, see note 5 to the financial statements.44 <strong>Anglo</strong> <strong>American</strong> plc <strong>Annual</strong> <strong>Report</strong> <strong>2012</strong>
negligible margins being realised uponthe subsequent sale of inventory heldat the acquisition date. The reversalof fair value uplifts on inventory soldin <strong>2012</strong> of $421 million has beenexcluded from the Group’s underlyingearnings so as not to distort theoperating margins of De Beers andto provide more useful informationabout the performance of the Group.OtherA charge of $159 million has arisenat Loma de Níquel due to thecancellation of its mining concessionsin November <strong>2012</strong>.Other impairments and relatedcharges of $230 million(2011: $70 million) relates to variousimpairments across the Group,including an impairment of $42 millionof fixed assets relating to onerouscontracts at Callide (MetallurgicalCoal); an impairment of $44 millionrelating to Wesizwe, an available forsale asset held in Platinum where thefair value has had a significant andprolonged decline; and $50 millionof asset impairments recognised inSamancor, an associate investment.The charge of $386 million inrelation to onerous contractsprincipally reflects a provisionincrease of $292 million for coalsupply agreements inherited onacquisition of Callide in 2000.Operating remeasurementsOperating remeasurements reflect anet loss of $112 million (2011: loss of$74 million) principally in respect ofnon-hedge derivatives related tocapital expenditure in Iron Ore Brazil.Derivatives which have been realisedduring the period had a cumulative netgain since their inception of $71 million(2011: $383 million). The depreciationcharge arising due to the fair valueuplift on the pre-existing 45%shareholding of De Beers, which wasrequired on acquisition of a controllingstake, is $41 million in <strong>2012</strong>.Non-operating special itemsIn May <strong>2012</strong>, the CompetitionCommission approved the formationof a 50:50 joint venture between theGroup and Lafarge combining theircement, aggregates, ready-mixconcrete, asphalt and asphaltsurfacing, maintenance services, andwaste services businesses in the UKsubject to a number of prior conditions.Full year underlying operating profit variances$bn12.011.010.09.08.07.06.05.04.03.02.01.00Actual 2011 11.1Bulks (2.9)Traded (1.0)Price (1) (3.9)Exchange 0.9Inflation (2) (0.6)7.6Sales volume (3) 0.2Cash costs (4) (0.3)Strikes (5) (0.5)Depreciation (0.2)Associates (0.3)De Beers (6) (0.2)Other (0.1)Actual <strong>2012</strong> 6.2Price (1) (3.9)Exchange 0.9Inflation (2) (0.6)Sales volume (3) 0.2Cash costs (4) (0.3)Strikes (5) (0.5)Depreciation (0.2)Associates (0.3)De Beers (6) (0.2)Other (0.1)(1)Price variance calculated as increase/decrease in price multiplied by current period sales volume.(2)Inflation variance calculated using CPI on prior period cash operating costs that have been impacteddirectly by inflation.(3)Volume variance calculated as the increase/decrease in sales multiplied by prior period profit margin;Full impact of Los Bronces expansion project ($0.6bn) and Kolomela ($0.4bn) operating profit vs. 2011is included within Volume.(4)Includes stripping and inventory movements.(5)Lost sales volume measured at forgone <strong>2012</strong> cash contribution.(6)De Beers was acquired on 16 August <strong>2012</strong>. Variance reflects all movements associated with De Beersin <strong>2012</strong>.Reconciliation of loss for the year to underlying earnings$m7,0006,0005,0004,0003,0002,0001,0000-1,000-2,000(1,493)7,039112594(1,988)88(1,110)(403)2,839Loss for the year (1,493)Operating special items 7,039Operating remeasurements 112Non-operating special items 594Non-operating remeasurement (1,988)Financing remeasurements 88Special items and remeasurements tax (1,110)Non-controlling interests on special items (403)Underlying earnings 2,839Operating and financial review<strong>Anglo</strong> <strong>American</strong> plc <strong>Annual</strong> <strong>Report</strong> <strong>2012</strong> 45
OPERATING AND FINANCIAL REVIEW GROUP FINANCIAL PERFORMANCETax$ million (unlessotherwise stated)Beforespecialitems andremeasurementsYear ended 31 Dec <strong>2012</strong> Year ended 31 Dec 2011Associates’tax andnoncontrollinginterestsIncludingassociatesBeforespecialitems andremeasurementsAssociates’tax andnoncontrollinginterestsIncludingassociatesProfit before tax 5,610 208 5,818 10,626 401 11,027Tax (1,488) (202) (1,690) (2,741) (385) (3,126)Profit for the financial year 4,122 6 4,128 7,885 16 7,901Effective tax rate includingassociates 29.0% 28.3%In July <strong>2012</strong>, the Group acceptedthe conditions of the CompetitionCommission and consequently theassociated assets of Tarmac QuarryMaterials were classified as held forsale and recognised at fair value lesscosts to sell. This resulted in a lossbeing recognised of $135 million.In December <strong>2012</strong> the Group agreedthe sale of its 70% interest in theAmapá iron ore system. The net assetshave been reclassified to held for saleand recognised at fair value less coststo sell. This resulted in a loss beingrecognised of $404 million.Non-operating remeasurementsThe non-operating remeasurementof $1,988 million (2011: nil) reflectsthe gain of $2,017 million, net oftransaction costs, resulting from theremeasurement to fair value of theGroup’s existing 45% shareholdingheld in De Beers at the date acontrolling stake was acquired.This includes a $2.7 billion uplift ondepreciable assets which will unwindthrough operating remeasurementsin the current and future years.Financing remeasurementsFinancing remeasurements reflecta net loss of $88 million (2011: gainof $205 million) and relates to anembedded interest rate derivative,non-hedge derivatives relating to debtand other financing remeasurements.Special items andremeasurements taxSpecial items and remeasurementstax amounted to a credit of$1,110 million (2011: charge of$118 million). This relates to a creditfor one-off tax items of $922 million(2011: credit of $137 million), a taxremeasurement charge of $189 million(2011: charge of $230 million) and atax credit on special items andThe completionof ouracquisition ofan additional40% interestin De Beers inAugust <strong>2012</strong>resulted in acash outflow of$4,816 million,net of cashacquired.remeasurements of $377 million(2011: charge of $25 million).The credit for one-off tax itemsof $922 million (2011: credit of$137 million) relates principally to thenet deferred tax credit of $960 millionat Minas-Rio and a net deferred taxcredit of $70 million owing to thereassessment of deferred tax assetsas a result of changes in tax regimeswithin operating segments, partiallyoffset by the write-off of the deferredtax asset in Amapá of $108 millionfollowing the decision to sell the mine.Net finance costsNet finance costs, beforeremeasurements, excludingassociates, were $288 million(2011: $20 million). This increase wasdriven by a decrease in investmentincome of $71 million, owing to loweraverage levels of cash and a higherinterest expense of $103 million,reflecting the increase in debt duringthe year. Foreign exchange losses onnet debt also increased by $74 millioncompared with 2011.TaxThe effective rate of tax before specialitems and remeasurements includingattributable share of associates’ tax forthe year ended 31 December <strong>2012</strong>was 29.0%. The increase compared tothe equivalent effective rate of 28.3%for the year ended 31 December 2011is due to the reduced impact of certainnon-recurring factors. The nonrecurringfactors in <strong>2012</strong> includefurther recognition of previouslyunrecognised tax losses and thereassessment of certain withholdingtax provisions across the Group. Infuture periods it is expected that theeffective tax rate, including associates’tax, will remain above the UnitedKingdom statutory tax rate.Balance sheetEquity attributable to equityshareholders of the Company was$37,657 million at 31 December <strong>2012</strong>(31 December 2011: $39,092 million).This decrease reflects the loss for theperiod of $1,493 million. Investments inassociates were $2,177 million lowerthan at 31 December 2011, principallyas a result of De Beers becoming asubsidiary following the acquisition ofa further 40% shareholding. Property,plant and equipment increasedby $4,540 million compared to31 December 2011, as a result ofongoing investment in growth projectsand the acquisition of De Beers,partially offset by an increase indepreciation, the transfer of Amapáand Tarmac Quarry Materials to ‘heldfor sale’ and the disposal of ScawSouth Africa.Cash flowNet cash inflows from operatingactivities were $5,562 million(2011: $9,362 million). UnderlyingEBITDA was $8,686 million, adecrease of 35% from $13,348 millionin the prior year, reflecting weakerprices across the Group’s corecommodities and changes inoperational performance.Net cash used in investingactivities was $9,821 million(2011: $4,853 million). Purchasesof property, plant and equipment,net of related derivative cash flows,amounted to $5,678 million, adecrease of $86 million, reflecting theGroup’s disciplined approach to capitalallocation in the current economicenvironment while maintainingexpenditure on strategic growthprojects. Proceeds from disposals,principally the disposal of Scaw SouthAfrica (net of cash and cashequivalents disposed), were$100 million (2011: $533 million).Movements in non-controlling interestduring the year resulted in a cashinflow of $1,220 million mainly$1,907 million from the disposal of25.4% of AA Sur, partly offset by thepurchase of 4.5% of Kumba for$698 million.Net cash inflow from financingactivities was $1,950 million comparedwith $1,474 million in 2011. During theyear the Group paid dividends of$970 million to company shareholders,46 <strong>Anglo</strong> <strong>American</strong> plc <strong>Annual</strong> <strong>Report</strong> <strong>2012</strong>
Sensitivity analysis in respect of currency and commodity pricesSet out below is the impact on underlying earnings of a 10% fluctuationin certain of the Group’s commodity prices and exchange rates(1)Average price10%(7)Commodity<strong>2012</strong> 2011sensitivityUS$ millionPlatinum (2) $1,555/oz $1,725/oz 150Metallurgical Coal (3) $178/t $251/t 195Thermal Coal (4) $92/t $114/t 209Copper (5) 361c/lb 400c/lb 280Nickel (5) 794c/lb 1,035c/lb 37Iron Ore (6) $122/t $158/t 191Palladium (2) $647/oz $736/oz 41ZAR/USD 8.21 7.26 434AUD/USD 0.97 0.97 190CLP/USD 486 484 69(1)‘oz’ denotes ounces, ‘t’ denotes tonnes, ‘c’ denotes cents, ‘lb’ denotes pounds.(2)Source: Johnson Matthey Plc.(3)Average realised FOB price of export metallurgical coal.(4)Average realised FOB price of export thermal coal (South Africa).(5)Being the average LME price.(6)Average price represents average iron ore (South Africa) export price achieved.(7)Excludes the effect of any hedging activities. Stated after tax at marginal rate. Sensitivities are the averageof the positive and negative and the impact of a 10% change in the average prices received and exchange ratesduring <strong>2012</strong>. Increases in commodity prices increase underlying earnings and vice versa. A strengthening ofthe South African rand, Australian dollar and Chilean peso relative to the US dollar reduces underlying earningsand vice versa.and $1,267 million in dividends tonon-controlling interests.The completion of our acquisition of anadditional 40% interest in De Beers inAugust <strong>2012</strong> resulted in a cash outflowof $4,816 million, net of cash acquired.Liquidity and fundingNet debt, including related hedges,was $8,615 million, an increase of$7,241 million from $1,374 million at31 December 2011. The increase innet debt reflects weaker operatingcash flows owing to lower commodityprices in <strong>2012</strong> and the acquisition of40% of De Beers, partially offset bythe disposal of 25.4% in AA Sur.Net debt at 31 December <strong>2012</strong>comprised $17,759 million of debt,partially offset by $9,312 million ofcash and cash equivalents, and thecurrent position of derivative liabilitiesrelated to net debt of $168 million. Netdebt to total capital (1) at 31 December<strong>2012</strong> was 16.4%, compared with 3.1%at 31 December 2011.At 31 December <strong>2012</strong>, the Group hadundrawn committed bank facilities of$9.3 billion.(1)Net debt to total capital is calculated as net debtdivided by total capital. Total capital is net assetsexcluding net debt.The Group’s forecasts and projections,taking account of reasonably possiblechanges in trading performance,indicate the Group’s ability to operatewithin the level of its current facilitiesfor the foreseeable future.Corporate activities andunallocated costsCorporate costs which are consideredto be value adding to the business unitsare allocated to each business unit.Costs reported externally as Groupcorporate costs only comprise costsassociated with parental or directshareholder-related activities.Dividends<strong>Anglo</strong> <strong>American</strong>’s dividend policy willprovide a base dividend that will bemaintained or increased through thecycle. Consistent with the policy, theBoard has recommended a finaldividend of 53 cents per share,giving a total rebased dividend forthe year of 85 cents per share, subjectto shareholder approval at the <strong>Annual</strong>General Meeting to be held on19 April 2013. This reflects confidencein the underlying business andcompletes the reinstatementjourney to rebase the dividend to becompetitive with diversified peers.This recommendation is consistentwith the commitment to have adisciplined balance between themaintenance of a strong investmentgrade rating, returns to shareholdersand sequencing of future investmentin line with resulting funding capacity.From time to time any cash surplusto requirements will be returnedto shareholders.Analysis of dividendsUS cents per share <strong>2012</strong> 2011Interim dividend 32 28Recommendedfi n a ld i v i d e n d 53 46Total dividends 85 74Related party transactionsRelated party transactions aredisclosed in note 37 to the financialstatements.Basis of disclosureThis operating and financial review(OFR) describes the main trends andfactors underlying the development,performance and position of<strong>Anglo</strong> <strong>American</strong> plc (the Group)during the year ended 31 December<strong>2012</strong>, as well as those likely to affectthe future development, performanceand position. It has been prepared inline with the guidance provided in thereporting statement on the operatingand finance review issued by theUK Accounting Standards Board inJanuary 2006.Forward looking statementsThis OFR contains certain forwardlooking statements with respect tothe financial condition, results,operations and businesses of theGroup. These statements andforecasts involve risk and uncertaintybecause they relate to events anddepend on circumstances that occurin the future. There are a numberof factors that could cause actualresults or developments todiffer materially from thoseexpressed or implied by theseforward looking statements.Operating and financial review<strong>Anglo</strong> <strong>American</strong> plc <strong>Annual</strong> <strong>Report</strong> <strong>2012</strong> 47
OPERATING AND FINANCIAL REVIEW RISKEFFECTIVE RISKMANAGEMENTDavid ChallenChairman, AuditCommittee“Understanding our key risks and developingappropriate responses is critical to our future success.We are committed to a robust system of riskidentification and an effective response to such risks.”<strong>Anglo</strong> <strong>American</strong> assessment of strategic, operational, project and sustainable development related risks1. Identifying risksA consistently appliedmethodology is used to identifykey risks across the Group; atbusiness units, operationsand projects. This has beeneffected through thedevelopment, roll-out andongoing implementation ofa Group integrated riskmanagement standard.2. Analysing risks andcontrols to manageidentified risksOnce identified, the processwill evaluate identified risks toestablish root causes, financialand non-financial impactsand likelihood of occurrence.Consideration of risk treatmentsis taken into account toenable the creation of aprioritised register.3. Determiningmanagement actionsrequiredEffectiveness and adequacyof controls are assessed.If additional controls arerequired these will be identifiedand responsibilities assigned.4. <strong>Report</strong>ing and monitoringManagement is responsible formonitoring progress of actionsto treat key risks and issupported through the Group’sinternal audit programme,which evaluates the design andeffectiveness of controls.The risk management processis continuous, key risks arereported to the AuditCommittee with sustainabilityrisk also being reported to theS&SD Committee.HOW WEMANAGE RISKManagement of risk is critical tothe success of <strong>Anglo</strong> <strong>American</strong>.Our Group is exposed to a varietyof risks that can have a financial,operational or reputational impact.Effective management of risksupports the delivery of ourobjectives and the achievementof sustainable growth.HOW DOES RISK RELATE TOOUR STRATEGIC INTENTS?Risks can arise from events outsideof our control or from operationalmatters. Each of the key risksdescribed on the following pages canhave an impact on our ability to achieveour strategic intents. This is illustratedby reference to each of our strategicintents; namely:• Investing in world class assets inthe most attractive commodities• Organising efficiently and effectively• Operating safely, sustainablyand responsibly• Employing the best people.As mining is a business that can spandecades, many of its attendant risksare long term in nature, and theremay not be any significant changeyear on year. During <strong>2012</strong>, however,we experienced changes in our riskprofile; these are indicated in eachof our risk descriptions, withappropriate commentary wherewe have seen change.We also recognise that risks cannotbe viewed in isolation. Emergenceof one risk may be caused by one ormore other risks or may cause anotherrisk to emerge. For example, projectdelivery risk can be influenced byrisks relating to supply, inflation,political matters, legal and regulatoryrequirements, infrastructure orcommunity relations. Thisinterconnectivity and the relationshipof risks to our abovementionedfour strategic elements requiressignificant emphasis to be placedon the management of risk and theeffectiveness of our risk controls, withthe identification and understanding ofour risks being the first step in what is acontinuous process.48 <strong>Anglo</strong> <strong>American</strong> plc <strong>Annual</strong> <strong>Report</strong> <strong>2012</strong>
EXTERNAL RISKSLinking to our 4 strategic pillars for more informationINVESTING Page 14 ORGANISING Page 18OPERATING Page 22EMPLOYING Page 32Change in risk during <strong>2012</strong>No change in riskIncreased riskDecreased riskCOMMODITY PRICESCommodity prices for all products that <strong>Anglo</strong> <strong>American</strong> producesare subject to wide fluctuation.Impact: Commodity price volatility can result in a material andadverse movement in the Group’s operating results, asset values,revenues and cash flows. Falling commodity prices could preventus from completing transactions that are important to the businessand which may have an adverse effect on <strong>Anglo</strong> <strong>American</strong>’sfinancial position – e.g. the inability to sell assets at the values orwithin the timelines expected.If commodity prices remain weak for a sustained period, our abilityto deliver growth in future years may be adversely affected asgrowth projects may not be viable at lower prices, and we maynot be able to compete for new, complex projects that requiresignificant capital investment.Root cause: Commodity prices are determined primarily byinternational markets and global supply and demand. Demand forcommodities will largely be determined by the strength of theglobal economic environment.Mitigation: The diversified nature of the commodities that<strong>Anglo</strong> <strong>American</strong> produces provides some protection to this risk,and our policy is not to engage in commodity price hedging. Weconstantly monitor the markets in which we operate, reviewingcapital expenditure programmes accordingly so as to ensure thesupply of our products reflects forecast market conditions.Commentary: During <strong>2012</strong>, prices in all the commodities we minefell as a result of global economic weakness. Further detail of pricemovements is provided on page 5.Increased riskINVESTING Page 14 ORGANISING Page 18OPERATING EMPLOYINGCLIMATE CHANGEOur operations are exposed to changes in climate and the needto comply with changes in the regulatory environment aimed atreducing the effects of climate change.Impact: Potential impacts from climate change are difficult toassess and will depend on the circumstances at individual sites,but could include increased rainfall, flooding, water shortages andhigher average temperatures. These may increase costs, reduceproduction levels or impact the results of operations.Policy developments at an international, national and sub-nationallevel, including those related to the 1997 Kyoto Protocol andsubsequent international agreements and emissions tradingschemes, could adversely affect the profitability of the Group.Regulatory measures may influence energy prices, demand or themargins achieved for carbon intensive products such as coal.Root cause: <strong>Anglo</strong> <strong>American</strong> is a significant user of energy. We arealso a major coal producer and exporter.Mitigation: In addition to the initiatives to monitor and limit theimpact of operations on the environment, we continuously seek toreduce energy input levels at our operations. Our asset optimisationprogramme seeks to make operations more energy efficient.No change in riskINVESTING ORGANISING Page 18OPERATING Page 22 EMPLOYINGLIQUIDITY RISKOur Group is exposed to liquidity risk in terms of being able tofund operations and growth.Impact: If we are unable to obtain sufficient credit as a result ofprevailing capital market conditions, we may not be able to raisesufficient funds to develop new projects, compete for new complexprojects requiring significant capital expenditure, fund acquisitionsor meet our ongoing financing needs. As a result, our revenues,operating results, cash flows or financial position may beadversely affected.Root cause: Liquidity risk arises from uncertainty or volatility inthe capital or credit markets owing to perceived weaknesses of theglobal economic environment, or possibly as a response to shockevents. Liquidity risk also arises when lenders are insecure aboutour long term cash generative capacity.Mitigation: We have an experienced Treasury team which isresponsible for ensuring that there are sufficient committed loanfacilities in place to meet short term business requirements aftertaking into account cash flows from operations and holdingsof cash, as well as any Group distribution restrictions that exist.We limit exposure on liquid funds through a policy of minimumcounterparty credit ratings, daily counterparty settlement limitsand exposure diversification.No change in riskINVESTING ORGANISING Page 18OPERATING EMPLOYINGPOLITICAL, LEGAL AND REGULATORYWherever we operate, our businesses may be affected by politicalor regulatory developments, including changes to fiscal regimes orother regulatory regimes.Impact: Potential impacts include restrictions on the export ofcurrency, expropriation of assets, imposition of royalties or othertaxes targeted at mining companies, and requirements for localownership or beneficiation. Political instability can also result incivil unrest and nullification of existing agreements, mining permitsor leases. Any of these may adversely affect the Group’s operationsor results of those operations.Root cause: The Group has no control over local political acts orchanges in local tax rates. It recognises that its licence to operatethrough mining rights is dependent on a number of factors,including compliance with regulations.Mitigation: The Group actively monitors regulatory and politicaldevelopments on a continuous basis.Commentary: During <strong>2012</strong> we saw new or increased taxesand royalties introduced in Australia, Brazil, Chile, Colombia,South Africa and Zimbabwe, resolution of a legal dispute in Chileregarding the option over ownership of part of our <strong>Anglo</strong> <strong>American</strong>Sur assets and the loss of our mining concession in Venezuela.These matters are further explained on pages 62, 70 and 73respectively and all are indicative of a more difficult political, legaland regulatory environment.Increased riskINVESTING Page 14 ORGANISING Page 18OPERATING Page 22 EMPLOYING Page 32Operating and financial review<strong>Anglo</strong> <strong>American</strong> plc <strong>Annual</strong> <strong>Report</strong> <strong>2012</strong> 49
OPERATING AND FINANCIAL REVIEW RISKEXTERNAL RISKS continuedLinking to our 4 strategic pillars for more informationOPERATIONAL RISKSLinking to our 4 strategic pillars for more informationINFLATIONThe Group is exposed to potentially high rates of inflation in thecountries in which it operates.Impact: Higher rates of inflation may increase future operationalcosts if there is no concurrent depreciation of the local currencyagainst the US dollar, or an increase in the dollar price of theapplicable commodity.This may have a negative impact on profit margins andfi n a n c i a lr e s u l t s .Root cause: Cost inflation in the mining sector is more apparentduring periods of high commodity prices as demand for inputgoods and services can exceed supply.Mitigation: We closely manage costs through our assetoptimisation and supply chain initiatives and, where necessary,through adjusting employee and contractor numbers.Commentary: Despite commodity price reductions throughout<strong>2012</strong>, cost inflation in the mining sector continued during the period,which, combined with commodity price reductions, squeezedoperating margins. Further detail is provided on pages 42–47.Increased riskINVESTING ORGANISING Page 18OPERATING EMPLOYINGCOUNTERPARTY RISKThe Group is exposed to counterparty risk from customers,certain suppliers and holders of cash.Impact: Financial losses may arise should those counterpartiesbecome unable to meet their obligations to the Group.Root cause: Severe economic conditions or shock events asexperienced in recent years can have a major impact on the abilityof financial institutions and other counterparties with whom wehave relationships to meet their obligations.Mitigation: Our Group Treasury team is responsible for managingcounterparty risk with banks where <strong>Anglo</strong> <strong>American</strong> places cashdeposits. However, the Treasury operations of joint venturesand associates are independently managed and may exposethe Group to financial risks greater than the Group’s own policieswould permit.For other counterparty risks our businesses have creditmanagement procedures in place.No change in riskINVESTING ORGANISING Page 18OPERATING EMPLOYINGCURRENCY RISKThe Group is exposed to currency risk when transactions arenot conducted in US dollars.Impact: Fluctuations in the exchange rates of the most importantcurrencies influencing our own operating costs and asset valuations(the South African rand, Chilean peso, Brazilian real, Australiandollar, and pound sterling) may materially affect the Group’sfi n a n c i a lr e s u l t s .Root cause: The global nature of the Group’s businesses exposesthe Group to currency risk.Mitigation: Given the diversified nature of the Group, the Group’spolicy is generally not to hedge currency risk. Mitigation in the formof foreign exchange hedging is limited to debt instruments andcapital expenditure on major projects.HEALTH AND SAFETYFailure to maintain the high levels of safety management canresult in harm to our employees, contractors, communities nearour operations and damage to the environment.Occupational health risks to employees and contractorsinclude noise-induced hearing loss, occupational lung diseasesand tuberculosis (TB).In sub-Saharan Africa in particular, HIV/AIDS is a threat toeconomic growth and development.Impact: In addition to injury, health and environmental damage,impacts could include fines and penalties, liability to employeesor third parties, impairment of <strong>Anglo</strong> <strong>American</strong>’s reputation,industrial action or inability to attract and retain skilled employees.Government authorities may force closure of mines on a temporaryor permanent basis or refuse mining right applications.The recruitment and retention of skilled people required to meetgrowth aspirations can be affected by high rates of HIV/AIDS.Root cause: Mining is a hazardous industry and workingconditions such as weather, altitude and temperature can addto the inherent dangers of mining, whether underground or inopen pit mines.Mitigation: <strong>Anglo</strong> <strong>American</strong> sets a very high priority on safetyand health matters. A safety risk management process, globalstandards and a safety and environment assurance programmeform part of a consistently applied robust approach to mitigatingsafety risk.<strong>Anglo</strong> <strong>American</strong> provides anti-retroviral therapy to employeeswith HIV/AIDS and undertakes education and awarenessprogrammes to help prevent infection or spread of infection.No change in riskINVESTINGOPERATING Page 22ORGANISINGEMPLOYINGENVIRONMENTCertain of our operations create environmental risk in the form ofdust, noise or leakage of polluting substances from site operationsand uncontrolled breaches of tailings dam facilities, generatingharm to our employees, contractors, the communities near ouroperations, air quality, water purity and land contamination.Impact: Potential impacts include fines and penalties, statutoryliability for environmental remediation and other financialconsequences that may be significant.Governments may force closure of mines on a temporary orpermanent basis or refuse future mining right applications.Root cause: The mining process, including blasting andprocessing of orebodies, can generate dust and noise and requiresthe storage of waste materials in liquid form.Mitigation: The Group implements a number of initiatives tomonitor and limit the impact of its operations on the environment.No change in riskINVESTINGOPERATING Page 22ORGANISINGEMPLOYINGNo change in riskINVESTING ORGANISING Page 18OPERATING EMPLOYING50 <strong>Anglo</strong> <strong>American</strong> plc <strong>Annual</strong> <strong>Report</strong> <strong>2012</strong>
INVESTING Page 14 ORGANISING Page 18OPERATING Page 22EMPLOYING Page 32Change in risk during <strong>2012</strong>No change in riskIncreased riskDecreased riskEXPLORATIONExploration and development are costly activities, with noguarantee of success, but are necessary for future growth.Impact: Failure to discover and develop new mineral resourcesof sufficient magnitude could have an adverse bearing on futureresults and the Group’s financial condition.Root cause: Exploration and development are speculativeactivities and often take place in challenging or remote locationsfrom a climate, altitude or political perspective.Mitigation: The Group invests considerable sums each year infocused exploration programmes to enable resource discoveryand development to reserves. This investment includes the useof leading technology in exploration activity.No change in riskINVESTING Page 14 ORGANISING Page 18OPERATING Page 22 EMPLOYINGORE RESERVES AND MINERAL RESOURCES<strong>Anglo</strong> <strong>American</strong>’s Ore Reserves and Mineral Resources estimatesare subject to a number of assumptions that may be incorrect.Impact: Deviations from the estimated price of commodities,production costs and mining and processing recovery ratesmay have an impact on the financial condition and prospectsof the Group.Root cause: All assumptions related to Ore Reserves andMineral Resources are long term in nature and are subject tovolatility owing to economic, regulatory or political influences.Mitigation: <strong>Anglo</strong> <strong>American</strong> is experienced in managing OreReserves and Mineral Resources and has robust procedures inplace to reduce the likelihood of significant variation. All factorsare consistently monitored by management.The Group’s procedure on reporting of Ore Reserves and MineralResource estimates is summarised on page 191.Operating and financial reviewSUPPLY RISKThe inability to obtain key consumables, raw materials, miningand processing equipment in a timely manner.Impact: Any interruption to the Group’s supplies or increasein costs has a negative effect on our financial position andfuture performance.Root cause: During strong commodity cycles, increaseddemand can be experienced for such supplies, resulting in periodswhen supplies are not always available to meet demand.<strong>Anglo</strong> <strong>American</strong> has limited influence over manufacturersand suppliers.Mitigation: We take a proactive approach to developingrelationships with critical suppliers and to leveraging the Group’spurchasing power. Contingency plans are developed to mitigateloss of critical supplies.No change in riskINVESTING ORGANISING Page 18OPERATING Page 22 EMPLOYINGCONTRACTORSInability to employ the services of contractors to meet businessneeds or at expected cost levels.Impact: Disruption of operations or increased costs may ariseif key contractors are not available to meet production needs.Delays in start-up of new projects may also occur.Root cause: Mining contractors are used at several Groupoperations to develop mining projects, mine and deliver ore toprocessing plants. In periods of high commodity prices, demand forcontractors may exceed supply.Mitigation: Effective planning and the establishment of effectiveworking relationships with critical contractors help mitigate this risk.No change in riskINVESTINGOPERATINGORGANISINGEMPLOYING Page 32No change in riskINVESTING Page 14 ORGANISING Page 18OPERATING EMPLOYINGOPERATIONAL PERFORMANCE AND PROJECT DELIVERYFailure to meet production targets or project delivery timetablesand budgets.Impact: Increased unit costs may arise from failure to meetproduction targets, thus affecting our operational and financialperformance. Failure to meet project delivery timetables andbudgets may delay cash inflows, increase capital costs andreduce profitability, as well as have a negative impact on theGroup’s reputation.Root cause: Increasing regulatory, environmental, accessand social approvals can increase construction costs andintroduce delays.Operational performance can be influenced by technical andengineering factors as well as events or circumstances that havean impact on other critical inputs to the mining and processingof minerals.Mitigation: Management oversight of operating performanceand project delivery through regular executive managementbriefings, a continuous focus on improvement of operationsthrough our asset optimisation programme, and consistentapplication of the company’s methodology for new projectsare vital aspects in managing this risk.Commentary: While some of our growth projects ramped upproduction during <strong>2012</strong> as planned, our key project in Brazil,Minas-Rio is behind schedule as a result of permit delays and legalchallenges, as described on pages 58 and 59. In addition, some ofour business units did not meet expected production volumes dueto operational performance challenges as indicated on page 43.Production performance was also affected by industrial strikeaction in South Africa as described on pages 57 and 80.Increased riskINVESTING Page 14 ORGANISING Page 18OPERATING Page 22 EMPLOYING Page 32<strong>Anglo</strong> <strong>American</strong> plc <strong>Annual</strong> <strong>Report</strong> <strong>2012</strong> 51
OPERATING AND FINANCIAL REVIEW RISKOPERATIONAL RISKS continuedLinking to our 4 strategic pillars for more informationEVENT RISKDamage to physical assets from fire, explosion, naturalcatastrophe or breakdown of critical machinery.Impact: The direct costs of repair or replacement combinedwith business interruption losses can result in financial losses.Root cause: Some of our operations are located in areas exposedto natural catastrophes such as earthquake/extreme weatherconditions. The impact of climate change may intensify theseverity of weather events.The nature of our operations exposes us to potential failureof mining pit slopes and tailings dam walls, fire, explosionand breakdown of critical machinery, with long lead timesfor replacement.Mitigation: Specialist consultants are engaged to analyse suchevent risks on a rotational basis and provide recommendationsfor management action in order to prevent or limit the effects ofsuch a loss.Contingency plans are developed to respond to significant eventsand restore normal levels of business activity. <strong>Anglo</strong> <strong>American</strong>purchases insurance to protect itself against the financialconsequences of an event, subject to availability and cost.No change in riskEMPLOYEESINVESTINGOPERATING Page 22ORGANISINGEMPLOYINGThe ability to recruit, develop and retain appropriate skills forthe Group.Strikes or other industrial relations disputes frequently occur.Impact: Failure to retain skilled employees or to recruit new staffmay lead to increased costs, interruptions to existing operationsand delay in new projects.Industrial disputes have an adverse effect on production levels,costs and the results of operations.Root cause: We are subject to global competition for skilledlabour. Our assets and development projects are often in remoteplaces or in countries where it is a challenge to recruit suitablyskilled employees.In the key countries where the Group operates, the majority ofemployees are members of trade unions. Negotiations overwage levels or working conditions can sometimes fail to resultin agreement.Mitigation: <strong>Anglo</strong> <strong>American</strong>’s objective is to be the employer ofchoice in the mining sector. A comprehensive human resourcesstrategy has been devised to support that objective, focused on theattraction, retention and development of talented employees andthe effective deployment of talent across the Group. The Groupseeks constructive relationships and dialogue with trade unionsand employees in all its businesses.Commentary: During the second half of <strong>2012</strong> we suffered fromstrike action in our Platinum and Kumba Iron Ore business units inSouth Africa. These strikes had a significant impact on productionlevels as described on pages 57 and 80.BUSINESS INTEGRITYFailure to prevent acts of fraud, bribery, corruption oranti-competitive behaviour.Impact: Potential impacts include prosecution, fines, penaltiesand reputational damage.<strong>Anglo</strong> <strong>American</strong> may suffer financial loss if it is the victim of afraudulent act.Root cause: In certain countries where the Group operates therisk of corruption is high, as indicated by indices prepared byindependent non-governmental organisations (NGOs).Mitigation: <strong>Anglo</strong> <strong>American</strong> has very clear principles on themanner in which it conducts its business and expects allemployees to act in accordance with its values. Policies,procedures and awareness programmes are in place to ensureconsistent understanding of the Group’s expectations.The Group’s internal control environment is designed to preventfraud and is regularly reviewed by an internal audit team to provideassurance that controls are designed and operating effectively.Commentary: The continued implementation of our programmeof measures to raise awareness, understanding and managementof bribery risk during <strong>2012</strong> should have a positive impact inreducing the likelihood of this risk materialising. The global spreadof our business, however, means we can never eliminate this risk.Decreased riskJOINT VENTURESFailure to achieve expected standards of health, safety andenvironment performance in joint ventures.Impact: If similar standards are not implemented in joint ventures,higher costs or lower production may result and have a bearing onoperational results, asset values or the Group’s reputation.Root cause: Some of the Group’s operations are controlled andmanaged by joint venture partners, associates or by othercompanies. Management of non-controlled assets may notcomply with the Group’s standards.Mitigation: The Group seeks to mitigate this risk by way of athorough evaluation process before commitment to any jointventure and through implementation of ongoing governanceprocesses in existing joint ventures.Commentary: During <strong>2012</strong>, we completed the acquisition of theOppenheimer family shares in the De Beers business, whichincludes a number of joint ventures. We also completed the Tarmacjoint venture with Lafarge in early 2013, (refer page 89). Thus, asthe number of joint ventures in the Group increases, the profile ofthis risk has increased in consequence.Increased riskINVESTINGOPERATING Page 22ORGANISINGEMPLOYINGINVESTING Page 14 ORGANISING Page 18OPERATING Page 22 EMPLOYINGDecreased riskINVESTINGOPERATINGORGANISINGEMPLOYING Page 3252 <strong>Anglo</strong> <strong>American</strong> plc <strong>Annual</strong> <strong>Report</strong> <strong>2012</strong>
ACQUISITIONS AND DIVESTMENTSFailure to achieve expected benefits from any acquisition or valuefrom assets or businesses sold.Impact: Failing to deliver expected benefits from acquisitions canresult in adverse financial performance, lower production volumesor problems with product quality. The Group could find itself liablefor past acts or omissions of the acquired business without anyadequate right of redress.Failure to achieve expected values from the sale of assets ordelivery beyond expected receipt of funds may result in higherdebt levels, underperformance of those businesses and possibleloss of key personnel.Root cause: Benefits may not be achieved as a result of changingor incorrect assumptions or materially different market conditionsor deficiencies in the due diligence process.Delays in the sale of assets or reductions in value may arise due tochanging market conditions.Mitigation: Rigorous guidelines are applied to the evaluation andexecution of all acquisitions, including those that require theapproval of the Investment Committee and Group ManagementCommittee and, subject to size, the Board.Commentary: The acquisition of Oppenheimer family sharesin De Beers has enabled benefits to be identified that will bedelivered during the integration process. This acquisitionincreases the profile of this risk. Please refer to pages 83–85for further detail.COMMUNITY RELATIONSDisputes with communities may arise from time to time.Impact: Failure to manage relationships with local communities,government and NGOs may disrupt operations and negativelyaffect <strong>Anglo</strong> <strong>American</strong>’s reputation as well as our ability to bringprojects into production.Root cause: We operate in several countries where ownershipof rights in respect of land and resources is uncertain and wheredisputes in relation to ownership or other community mattersmay arise.The Group’s operations can have an impact on local communities,including the need, from time to time, to relocate communities orinfrastructure networks such as railways and utility services.Mitigation: We have developed comprehensive processes toenable our business units to effectively manage relationships withcommunities and we actively seek to engage with all communitiesimpacted by our operations.No change in riskINVESTING ORGANISING Page 18OPERATING Page 22 EMPLOYINGOperating and financial reviewIncreased riskINVESTING Page 14 ORGANISING Page 18OPERATING Page 22 EMPLOYINGINFRASTRUCTUREInability to obtain adequate supporting facilities, servicesand installations (water, power, road, rail and port, etc.).Impact: Failure to obtain supporting facilities may affect thesustainability and growth of the business, leading to loss ofcompetitiveness, market share and reputation.Failure of rail or port facilities may result in delays and increasedcosts as well as lost revenue and reputation with customers.Failure to procure shipping costs at competitive market ratesmay reduce profit margins.Root cause: The potential disruption of ongoing generationand supply of power is a risk faced by <strong>Anglo</strong> <strong>American</strong> in anumber of countries in which it operates. Our operations andprojects can be located in countries or regions where power andwater supplies are not certain and may be affected by populationgrowth, the effects of climate change or lack of investment byowners of infrastructure.We rely upon effective rail and port facilities for transporting ourproducts and will be expected to provide shipment of product insome circumstances to customers’ premises. We use third partiesto provide these services.Mitigation: We seek to work closely with suppliers ofinfrastructure to mitigate the risk of failure and have establishedcontingency arrangements. Long term agreements with suppliersare sought where appropriate.No change in riskINVESTING ORGANISING Page 18OPERATING Page 22 EMPLOYING<strong>Anglo</strong> <strong>American</strong> plc <strong>Annual</strong> <strong>Report</strong> <strong>2012</strong> 53
OPERATING AND FINANCIAL REVIEW IRON ORE AND MANGANESEIRON ORE ANDMANGANESENorman MbazimaCEO – KumbaPauloCastellari-PorchiaCEO – Iron Ore Brazil01UNDERLYING OPERATING PROFIT(2011: $4,400 m)$2,949 mSHARE OF GROUP UNDERLYINGOPERATING PROFIT(2011: 40%)48%UNDERLYING EBITDA(2011: $4,586 m)$3,198 m01 Construction of the pump station at ourMinas-Rio iron ore project in Brazil.Key financial and non-financial performance indicators$ million (unless otherwise stated) (1) <strong>2012</strong> 2011Underlying operating profit 2,949 4,400Kumba Iron Ore 2,980 4,491Iron Ore Brazil (5) (141)Samancor 103 165Projects and Corporate (129) (115)Underlying EBITDA 3,198 4,586Net operating assets 9,356 12,427Capital expenditure 2,077 1,659Share of Group underlying operating profit 48% 40%Share of Group net operating assets 18% 28%Non-financial indicators (2) <strong>2012</strong> 2011Number of fatal injuriesKumba Iron Ore 2 –Iron Ore Brazil – 1Lost-time injury frequency rateKumba Iron Ore 0.10 0.08Iron Ore Brazil 0.01 0.01Total energy consumed in 1,000 GJKumba Iron Ore 7,603 7,045Iron Ore Brazil 713 2,074Total greenhouse gas emissions in 1,000 tonnes CO 2eKumba Iron Ore 945 907Iron Ore Brazil 49 112Total water used for primary activities in 1,000 m 3Kumba Iron Ore 8,803 8,179Iron Ore Brazil 895 5,273(1)In <strong>2012</strong>, Amapá was reclassified from Iron Ore and Manganese to Non-core within the Other Mining and Industrial (OMI) segment to align withinternal management reporting. Financial comparatives have been reclassified to align with current presentation.(2)In a given year, non-financial data is reported within the business unit that had management control of the operation; therefore non-financial datafor Amapá is reported within OMI and Iron Ore Brazil for <strong>2012</strong> and 2011 respectively.54 <strong>Anglo</strong> <strong>American</strong> plc <strong>Annual</strong> <strong>Report</strong> <strong>2012</strong>
<strong>2012</strong> Iron ore demandGlobal 1,092 Mt (1)North America49 MtEurope92MtJapan and rest of Asia 132 MtChina628MtIndia54 MtCIS71 MtIncorporating:South America39 MtRest of World27 MtSource: CRU, AME, company reports and<strong>Anglo</strong> <strong>American</strong> Commodity Research estimates(1)Global iron ore, Fe unit basis<strong>2012</strong> Iron ore productionGlobal 1,092 Mt (1)North America61 MtSouth America288 MtChina159 MtIndia82 MtCIS110 MtAustralia295MtIncorporating:Europe48MtRest of World49MtSource: CRU, AME, company reports and<strong>Anglo</strong> <strong>American</strong> Commodity Research estimates(1)Global iron ore, Fe unit basisBUSINESS OVERVIEWOur Iron Ore portfolio is based inSouth Africa and Brazil. In South Africa,we have a 69.7% (2011: 65.2%)shareholding in Kumba Iron OreLimited, a leading supplier of seaborneiron ore. Our Brazilian interestscomprise the Minas-Rio project(composed of Iron Ore Brazil’s 100%share in <strong>Anglo</strong> Ferrous Minas-RioMineração S.A., and its 49% holdingin LLX Minas-Rio, which owns the portof Açu currently under construction,and from which the project’s iron orewill be exported). Our 70% interest inthe Amapá iron ore system is now heldin Other Mining and Industrial.Kumba, listed on the JohannesburgStock Exchange, produces a leadingquality lump ore and also producespremium fine ore, in a lump-to-fineratio of 60:40. Kumba operatesthree mines – Sishen mine in theNorthern Cape, which produced33.7 million tonnes (Mt) of iron ore in<strong>2012</strong>; the new Kolomela mine, situatedclose to Sishen mine, which wasbrought into production during 2011and produced 8.5 Mt during <strong>2012</strong>;and Thabazimbi mine in Limpopo,with an output of 0.8 Mt.Export ore is transported via theSishen/Kolomela-Saldanha iron oreexport channel (IOEC) to SaldanhaPort. The rail and port operations areowned and operated by the SouthAfrican parastatal, Transnet.Kumba is well positioned to supplythe growing Asia-Pacific andMiddle East markets and Europeansteel markets. In <strong>2012</strong>, the companyexported 90% of its total iron oresales volumes of 44.4 Mt, with 69%of these exports destined for Chinaand the remainder for Europe, Japan,South Korea and India.Our Minas-Rio iron ore project islocated in the states of Minas Geraisand Rio de Janeiro and will includeopen pit mines and a beneficiationplant in Minas Gerais producinghigh grade pellet feed. Oncompletion of Phase 1, ore will betransported through a 525 kilometreslurry pipeline to the port of Açu inRio de Janeiro state.Kumbaproduces aleading qualitylump ore andalso producesa premiumfine ore.OPERATINGDRIVING PITSAFETY TO ANEW LEVELAs its vehicle population increases,one of the world’s biggest openpit operations is tackling the issueof vehicle collisions.As no suitable, off-the-shelfsolutions were available, Sishen’sengineers joined forces withFLARM, specialists in aviationcollision avoidance technology,to design a system tailor-madefor open pit mining.The ensuing collision avoidancesystem (CAS) links all vehiclesand safety features in oneintelligent system. It allowsfor vehicles to be remotelymonitored, and manual controlto be overridden. Notably, CASeliminates haul trucks’ notoriouslyblind spots, giving drivers amuch better all-round view.As operators gain experiencein CAS, Sishen is seeing asignificant fall in vehicle collisionsand ‘near misses’.Meanwhile, FLARM hasestablished SAFEmine, acompany set up specifically tobring Sishen’s CAS technologyto a worldwide market.ImageKumba’s Keitumetse Hynes has been trainedin CAS. She drives a haul truck at the Sisheniron ore mine in South Africa.Operating and financial review<strong>Anglo</strong> <strong>American</strong> plc <strong>Annual</strong> <strong>Report</strong> <strong>2012</strong> 55
OPERATING AND FINANCIAL REVIEW IRON ORE AND MANGANESEOur Manganese interests consistof a 40% shareholding in SamancorHoldings, which owns HotazelManganese Mines and Metalloys,both in South Africa, and a 40%shareholding in each of the Australianbasedoperations Groote EylandtMining Company (GEMCO) andTasmanian Electro MetallurgicalCompany (TEMCO), with BHP Billitonowning 60% and having managementcontrol. Samancor is the world’slargest producer of manganese oreand is among the top global producersof manganese alloy. Its operationsproduce a combination of ores andalloys from sites in South Africaand Australia.<strong>Anglo</strong> <strong>American</strong>has a uniqueiron oreresourceprofile, withextensive,high qualityresource basesin South Africaand Brazil.Iron ore price (FOB Australia)$/t20018016014012010080Jan 11 Jun 11 Dec 11Jun 12Dec 12Spot QAMOM (1)Source: <strong>Anglo</strong> <strong>American</strong> Commodity Research(1)QAMOM is a pricing mechanism based on average quarter in arrears minus one month.INDUSTRY OVERVIEWGlobal demand for iron ore is linkedprimarily to the state of the globalsteel industry and, more specifically,to the steel manufacturing sector inChina. The country is the largest steelproducer and consumer in the worldand accounts for more than two-thirdsof global seaborne iron ore imports.Manganese alloy is a key input intothe steelmaking process. Manganesehigh-grade ore is particularly valuableto alloy producers because it isproportionately more efficient thanlow-grade ore in the alloying process.STRATEGYA key element of <strong>Anglo</strong> <strong>American</strong>’sstrategy is to grow its position in ironore and to supply premium iron oreproducts against a background ofdeclining quality global iron oresupplies. We have a unique iron oreresource profile, with extensive, highquality resource bases in South Africaand Brazil.Kumba seeks to maximise totalshareholder value by enhancing thevalue of its current operations throughits asset optimisation programmes,capturing value across the value chainthrough its commercial and logisticsstrategies, executing its growthprojects efficiently, and ensuring thatit has the organisational capability toexecute its strategy.The company plans to grow itsbusiness organically in order toachieve production of 70 Mtpa fromSouth Africa and, in the longer term,through expanding its productionfootprint into other countries in Africa.Minas-Rio will capture a significantpart of the pellet feed market with itspremium product featuring high ironcontent and low contaminants. Phase1 of the Minas-Rio project will produce26.5 Mtpa, with potential optimisationto 29.8 Mtpa.During the year <strong>Anglo</strong> <strong>American</strong>completed a detailed cost andschedule review of the Minas-Rioiron ore project. The review includedthird party input and examined theoutstanding capital expenditurerequirements in light of currentdevelopment progress and thedisruptive challenges faced by theproject. The review included a detailedre-evaluation of all aspects of theoutstanding schedule, with a focus onmaximising value and mitigating risk.Following completion of the review,capital expenditure for the Minas-Rioproject is projected to increase to$8.8 billion, if a centrally held riskcontingency of $600 million is utilisedin full. On the basis of the revisedcapital expenditure requirements andassessment of the full potential ofPhase 1 of the project (excludingat this stage the potential forfuture expansions to 90 mtpa),<strong>Anglo</strong> <strong>American</strong> has recorded animpairment charge of $4 billion at31 December <strong>2012</strong>, on a post-taxbasis. The first phase of the project willbegin its ramp up at the end of 2014.Operating safely, sustainablyand responsiblyKumba faces a number of materialissues in its current operatingenvironment and at the forefrontis meeting rising expectations anddemands from stakeholders –including government, employees,communities and shareholders – ina financially and resource constrainedeconomic and social environment.Achieving and maintaining our licenceto operate also remains of the utmostimportance – including social andenvironmental compliance – amidstincreasing regulatory, cost andgovernance requirements in SouthAfrica. The attraction, retention anddevelopment of human resourcesremain critical priorities for Kumba.We address these issues through aconsidered and proactive approachto talent management and retentionas well as workplace health andsafety, responsible environmentalmanagement, and the application ofleading social performance standardsand management systems. At the coreof each of these strategic work streamsis a culture of regular and transparenttwo-way engagement.56 <strong>Anglo</strong> <strong>American</strong> plc <strong>Annual</strong> <strong>Report</strong> <strong>2012</strong>
01 Moving sections intoposition along the525 kilometre ironore slurry pipeline atour Minas-Rio projectin Brazil.02 Preparation workunder way on installingpower supply at thesite of Minas-Rio’smilling plant.01Followingsuccessfulcommissioningin 2011,Kolomelacontinued itsramp up aheadof expectationsand deliveredan outstandingperformance in<strong>2012</strong>, producing8.5 Mt ofiron ore.end of <strong>2012</strong>, with steel mills returningto the market, which was reflected ina marked increase in index iron oreprices. Overall, index prices averaged$130/t (CFR 62% Fe Platts) in <strong>2012</strong>,23% lower than the $169/t averageachieved in 2011.Operating performanceKumba Iron OreUnderlying operating profit decreasedby 34% from $4,491 million to$2,980 million principally as a resultof 23% weaker average export iron oreprices, partly offset by a 7% increase inexport sales volumes. Total operatingcosts rose by 16%, driven primarily bya $254 million increase in operatingcosts at Kolomela mine owing tooperating costs being capitalised in2011, above inflation cost increasesand the mining of 14.5 Mt of additionalwaste at Sishen mine.Total production of iron ore increasedby 4% to 43.1 Mt due to the ramp upof Kolomela, partially offset by theimpact of the unprotected strike duringthe fourth quarter. Total tonnes minedat Sishen rose by 4% to 171.6 Mt(2011: 165.0 Mt), of which wastemined amounted to 133.5 Mt, anincrease of 12% (2011: 119.0 Mt). Ironore production at Sishen, however,decreased by 13% to 33.7 Mt(2011: 38.9 Mt) mainly owing to theeffects of the unprotected strike.On 3 October, around 300 Sishenemployees commandeered mostof the mining equipment at the mine.The situation ended on 16 Octoberand production recommenced on20 October, though on a limitedbasis as attendance in the miningsection remained low in the immediateaftermath of the strike. Operationsare subsequently being ramped up.Production rates continue to improveand are expected to return to normaloperating levels by the end of the firsthalf of 2013.Sishen lost around 5 Mt of productionas a result of the industrial action andthe subsequent ramp up of operations.These losses exacerbated theproduction challenges experiencedearlier in the year resulting frommining feedstock and qualityconstraints that affected the availabilityof material supplied to the mine’s twoprocessing plants.Operating and financial review02FINANCIAL ANDOPERATIONAL OVERVIEWUnderlying operating profit decreasedby 33% from $4,400 million to$2,949 million, principally as a resultof weaker average export iron oreprices at Kumba and lower pricesand alloy volumes at Samancor. Thiswas partially offset by an increase inexport iron ore at Kumba and recordmanganese ore volumes at Samancor.Safety and environmentKumba Iron OreRegrettably, Kumba suffered its firstloss of life since 2010, when twoemployees were fatally injured atSishen mine during <strong>2012</strong>. Kumbarecorded a lost-time injury rate (LTIFR)of 0.10 (2011: 0.08), a 25% increaseyear on year. Kolomela continued itsimpressive safety record and achieved29 million man-hours without a fatalincident or LTI between March 2010and October <strong>2012</strong>.Iron Ore BrazilThere were no losses of life at Iron OreBrazil sites in the year. The LTIFR of0.01 was in line with the prior year.MarketsGlobal crude steel productionincreased by 2% in <strong>2012</strong> to 1,550 Mt(2011: 1,526 Mt). This increase wasdriven primarily by China, where crudesteel output increased by around 3%to 717 Mt (2011: 695 Mt). In the rest ofthe world, crude steel output was fairlyflat at 833 Mt.Seaborne iron ore supplies weresubject to adverse weather conditionsin both Brazil and Australia in the firstquarter of <strong>2012</strong>, and ongoing Indiansupply disruptions following the ban oniron ore mining in Goa. For the year asa whole, seaborne supplies were 0.3%higher, reaching a level of 1,062 Mt.Considerable price volatility marked<strong>2012</strong>, especially during the thirdquarter when prices fell by as much as36%, as Chinese steel mills depletedstockpiles and reduced raw materialinventory levels to as little as 17 days’worth of production requirements.Iron ore prices reached a high of$151/t (62% Fe CFR China) in April<strong>2012</strong>, but fell to a low of $89/t in earlySeptember, before stabilising ataround $130/t towards the end of theyear. The market recovered at the<strong>Anglo</strong> <strong>American</strong> plc <strong>Annual</strong> <strong>Report</strong> <strong>2012</strong> 57
OPERATING AND FINANCIAL REVIEW IRON ORE AND MANGANESEFollowing successful commissioningin 2011, Kolomela continued its rampup ahead of schedule and delivered anoutstanding performance in <strong>2012</strong>,producing 8.5 Mt. Production hasexceeded monthly design capacitysince July <strong>2012</strong>, and reached recordlevels during the second half of theyear. Total tonnage mined increasedby 26% to 43.5 Mt (2011: 34.6 Mt),of which waste mined was 33.5 Mt,11% higher than the prior year figureof 30.3 Mt.Kumba’s sales volumes were 2%higher at 44.4 Mt (2011: 43.5 Mt).Export sales volumes for the yearincreased by 7% to 39.7 Mt(2011: 37.1 Mt) as production lossesat Sishen were offset by productionfrom Kolomela and by sales fromstock. The production losses causedby the unprotected strike reducedexport stock levels across the valuechain and impacted export spot salesvolumes. Notwithstanding the impactof the strike, Kumba met all its exportcustomer sales commitments for<strong>2012</strong>. Domestic sales volumes toAMSA reduced by 27% to 4.7 Mt(2011: 6.4 Mt). Export sales volumesto China accounted for 69% of thecompany’s total export volumes forthe year, compared to 68% in 2011.Iron Ore BrazilIron Ore Brazil generated an underlyingoperating loss of $5 million, reflectingthe pre-operational state of theMinas-Rio project.SamancorUnderlying operating profitdeclined by 38% to $103 million(2011: $165 million), driven by lowerprices and lower alloy volumes, partlyoffset by lower costs and strong oresales volumes. A slowdown in steelproduction weighed heavily on oreand alloy prices.Production of ore increased by20% from 2.8 Mt to a record 3.3 Mt(attributable basis) owing to aconsistently strong operatingperformance and improved plantavailability at both GEMCO in Australiaand Hotazel in South Africa. Alloyproduction, however, decreased by34% to 198,400 tonnes (attributablebasis) following the termination ofenergy-intensive silica-manganeseproduction at the Metalloys plant inSouth Africa and the temporarysuspension of production at TEMCOin Australia during the first half of theyear. TEMCO subsequently returnedto full capacity during the third quarter.ProjectsThe components of Kumba’sgrowth include new developments,expansions at existing operations, andgrowth though technological advancesthat will allow the processing of lowergrade ore.Kumba is currently studyingopportunities to expand Kolomela’sproduction through a beneficiationprocess, which could add a further6 Mtpa to its output. The project hasprogressed to pre-feasibility study andfurther decisions will be made in duecourse, depending on prevailingmarket conditions.The SEP 1B commenced constructionduring the year, and is expected tobe commissioned in 2013, within the$48 million capex budget.The growth portfolio is constantlybeing reviewed taking into account themacroeconomic environment, theoutcome of project studies and thestatus of the IOEC expansion study.Construction is under way at the firstphase of the 26.5 Mtpa Minas-Rioiron ore project, with optimisationto 29.8 Mtpa. <strong>Anglo</strong> <strong>American</strong>announced in December <strong>2012</strong> that allthree injunctions that had disrupted theproject in the year, contributing to thedelay of first ore on ship (FOOS)to the end of 2014, had been lifted.We announcedin December<strong>2012</strong> thatall threeinjunctions thathad disruptedthe Minas-Rioproject duringthe year,contributingto the delayof first ore onship to the endof 2014, hadbeen lifted.Construction progress is in line withthe revised construction scheduleannounced in July <strong>2012</strong>, namely:• The mine and beneficiation plantare on track – 92% of the earthworkshave been completed at thebeneficiation plant, the first of twogrinding mills has been installed andthe civil works for the secondarycrusher are complete;• At the 525 kilometre slurry pipeline,almost 50% of the pipeline has beenlaid (approximately 247 kilometres),with 76% of the land cleared forearthworks and pipe installation totake place;• The filtration plant is on schedulefor completion by June 2013;• The port’s two stackers andreclaimer have been erected and theshiploader installation is under way.010258 <strong>Anglo</strong> <strong>American</strong> plc <strong>Annual</strong> <strong>Report</strong> <strong>2012</strong>
01 At the Kumba/Kolomela rail loadingfacility iron ore is transferred to railwagons for the 861 kilometre journeyto the dedicated iron-ore exportterminal at Saldanha Bay onSouth Africa’s Atlantic coast.02 The jig plant at Sishen mine is oneof the biggest of its type in the world.The primary drivers of the capitalexpenditure increase from theprevious estimate in 2011 relate to:• The delay in FOOS from late 2013to late 2014;• Scope changes, including thoseagreed as part of the review processand taking into considerationadditional land access costs andpurchases, increased earth and civilworks required following access tovarious sites along the pipeline andthe increased costs of meetinglicence conditions;• Construction inflation costs,including contract adjustments andmining equipment price increases;• A centrally held risk contingencyof $600 million to accommodatea number of potential factors toachieve the FOOS date of the endof 2014, including the potential foradditional price escalation,productivity acceleration andfinalisation of the extent of earthand civil works required on landthat is yet to be accessed.Following its approval in 2011, the$279 million GEEP2 project(<strong>Anglo</strong> <strong>American</strong>’s 40% share:$112 million) will increase GEMCO’sbeneficiated product capacity from4.2 Mtpa to 4.8 Mtpa through theintroduction of a dense media circuitby-pass facility. The project is expectedto be completed, on schedule andbudget, in late 2013. The expansion willalso address infrastructure constraintsby increasing road and port capacity to5.9 Mtpa, creating 1.1 Mtpa of latentcapacity for future expansion.The addition of a $91 million (ona 100% basis) high carbon ferromanganesefurnace at the Metalloyssmelter in South Africa will add anadditional 130,000 tonnes of capacityper year. Hot commissioning wascompleted, on schedule, in thefourth quarter of <strong>2012</strong>, with fullproduction expected in the secondquarter of 2013.Kolomelamine remainson track toproduce 9 Mtin 2013, in linewith designcapacity.OutlookA similar level of growth in globalcrude steel production is expectedfor 2013, with China’s productionrising marginally to about 740 Mt,while growth in production in otherdeveloping countries is expected tobe countered by a reduction in outputin some of the developed markets.In 2013, Indian iron ore productionis expected to remain under pressureas a result of domestic policy changes.However, new supply capacity,primarily from Australia, is expectedto partially offset this reduction inIndian supply.The start of 2013 has seen a rapidrecovery in iron ore prices. Theconsensus view is that this rally will notbe sustained throughout the year;however some positive sentiment inrelation to Chinese steel consumptiongrowth has been restored and isexpected to provide support to pricesthroughout the year. Seaborne iron oresupply growth may lead to iron oreprices softening in the second half of2013, but on average prices areanticipated growth to be firmer than in<strong>2012</strong>.The knock-on effect of the <strong>2012</strong>unprotected strike at Sishen mine isexpected to result in lower productionvolumes than originally planned in2013. Sishen mine is anticipated toproduce at least 37.0 Mt in 2013. Theramp up in waste mining at Sishenmine continues and will continue to putupward pressure on the mine’s cashunit costs. Kolomela mine remains ontrack to produce 9 Mt in 2013, in linewith design capacity. Export salesvolumes are expected to be in linewith <strong>2012</strong> levels.Due to a weaker market, a supplyside response provided price supportfor manganese ore in the latter partof <strong>2012</strong>. The recovery in pricingis expected to continue into 2013,however, muted demand expectationsare expected to limit the rate andextent of the recovery in the near term.Kumba Iron Ore updateSishen supply agreementarbitrationA dispute arose between Sishen IronOre Company Proprietary Limited(SIOC) and ArcelorMittal South AfricaLimited (AMSA) in February 2010, inrelation to SIOC’s contention that thecontract mining agreement concludedbetween them in 2001 had becomeinoperative as a result of the fact thatAMSA had failed to convert its old ordermining rights. This dispute has beenreferred to arbitration. On 9 December2011, SIOC and AMSA agreed to delaythe arbitration proceedings in relationto the Sishen Supply Agreement untilthe final resolution of the mining rightsdispute. This arbitration is only expectedto commence in the fourth quarter of2013, with possible resolution onlyexpected in the third quarter of 2014at the earliest.An Interim Pricing Agreement (IPA2)between SIOC and AMSA was in placeuntil 31 July <strong>2012</strong> and was extended to31 December <strong>2012</strong>.In December <strong>2012</strong> a further interimagreement was concluded, afternegotiations which were facilitated bythe Department of Trade and Industry(DTI). The further interim agreementwill govern the sale of iron ore from theSishen mine to AMSA for the period1 January 2013 to 31 December 2013,or until the conclusion of the legalprocesses in relation to the 2001Sishen Supply agreement (whicheveris sooner), at a weighted average priceof $65/t. Of the total 4.8 Mt, about1.5 Mt is anticipated to be railed toSaldanha Steel and the rest to AMSA’sinland operations.21.4% undivided share of theSishen mine mineral rightsOn 3 February <strong>2012</strong> both theDepartment of Mineral Resources(DMR) and Imperial Crown Trading 289Proprietary Limited (ICT) submittedapplications for leave to appeal againstthe High Court judgment. SIOC appliedfor leave to present a conditionalcross-appeal, in order to protect itsrights. The Supreme Court of Appeal(SCA) hearing will be held on19 February 2013, and the SCAjudgement is expected to be receivedearly in the second half of 2013.The High Court order did not affect theinterim supply agreement betweenAMSA and SIOC, which was in placeuntil 31 July <strong>2012</strong> and was extended to31 December <strong>2012</strong>. SIOC will continueto take the necessary steps to protect itsshareholders’ interests in this regard.Operating and financial review<strong>Anglo</strong> <strong>American</strong> plc <strong>Annual</strong> <strong>Report</strong> <strong>2012</strong> 59
OPERATING AND FINANCIAL REVIEW METALLURGICAL COALMETALLURGICAL COALSeamus FrenchCEOUNDERLYING OPERATING PROFIT(2011: $1,189 m)$405 mSHARE OF GROUP UNDERLYINGOPERATING PROFIT(2011: 11%)7%UNDERLYING EBITDA(2011: $1,577 m)$877 mKey financial and non-financial performance indicators$ million (unless otherwise stated) <strong>2012</strong> 2011Underlying operating profit 405 1,189Underlying EBITDA 877 1,577Net operating assets 5,219 4,692Capital expenditure 1,028 695Share of Group underlying operating profit 7% 11%Share of Group net operating assets 10% 11%01Non-financial indicators <strong>2012</strong> 2011Number of fatal injuries 0 0Lost-time injury frequency rate 1.75 2.47Total energy consumed in 1,000 GJ 14,787 13,695Total greenhouse gas emissions in 1,000 tonnes CO 2e 3,919 3,629Total water used for primary activities in 1,000 m 3 14,717 14,38501 Mine site officer Nicolette Martens andproduction supervisor Gordon Barwickinspect the conveyor near the coalhandling and preparation plant atMoranbah North, in Queensland, Australia.60 <strong>Anglo</strong> <strong>American</strong> plc <strong>Annual</strong> <strong>Report</strong> <strong>2012</strong>
(1)Throughout theMetallurgical Coalcommentary,all volumes are expressedon an attributable basis.(2)CRU Metallurgical CoalMarket <strong>Report</strong>(February 2013)(3)Customs Information(Global TradeInformation ServicesInc.)BUSINESS OVERVIEW<strong>Anglo</strong> <strong>American</strong> is Australia’s secondlargest metallurgical coal producerand third largest global exporter ofmetallurgical coal. (1)Its coal operations in Australia arebased on the east coast, from wherethe business serves a range ofcustomers throughout Asia and theIndian sub-continent, Europe andSouth America. Our operation inCanada, Peace River Coal, mainlyserves customers in Europe, Japanand South America.Metallurgical Coal operates six minesin Australia and one metallurgical coalmine, Peace River Coal, in BritishColombia, Canada. In Australia thereis one wholly owned mine, and five inwhich Metallurgical Coal has a majorityinterest. Five of the mines are locatedin Queensland’s Bowen Basin:Moranbah North (metallurgical coal),Capcoal (metallurgical and thermalcoal), Foxleigh (metallurgical coal),Dawson (metallurgical and thermalcoal) and Callide (thermal coal).Drayton mine (thermal coal) is in theHunter Valley, New South Wales. Allof the mines are in well-establishedlocations and have direct access torail and port facilities at Dalrymple Bayand Gladstone in Queensland andNewcastle in New South Wales.Moranbah North (88%) is anunderground longwall miningoperation with a mining leasecovering 100 km 2 . Coal is minedfrom the Goonyella Middle Seam,approximately 200 metres below thesurface. The mine’s annual capacityis 4.5 million tonnes (Mt) of hardcoking coal for steel manufacturing.Capcoal (70%) operates twounderground mines and an opencut mine. Together, they producedaround 6.0 Mt of hard coking,pulverised coal injection (PCI) andthermal coals in <strong>2012</strong>.Dawson (51%) is an open cutoperation, with production of 4.6 Mtof coking and thermal coal in <strong>2012</strong>.Foxleigh (70%) is an open cutoperation which produced 1.9 Mtof high quality PCI coal in <strong>2012</strong>.Peace River Coal (100%) is an opencut operation in Canada, with an outputof 1.4 Mt of metallurgical coal in <strong>2012</strong>,an increase of 47% over the prior year.Metallurgical Coal owns an effective23% interest in the Jellinbah andLake Vermont mines in Queensland,producing 2.1 Mt of coking, PCI andthermal coals in <strong>2012</strong>.<strong>Anglo</strong> <strong>American</strong> has agreed to acquirea 58.9% interest in the Revuboèmetallurgical coal project inMozambique from the Talbot Estatefor a total cash consideration ofA$540 million (approximatelyUS$555 million). The Revuboè projectis an incorporated joint venture andincludes Nippon Steel Corporation(33.3% interest) and POSCO (7.8%interest). Revuboè comprises hardcoking and thermal coal suitable foropen cut mining, with the potentialto support the export of 6 to 9 milliontonnes per annum (Mpta) on a100% basis.The transaction remains subject toa number of conditions and is in linewith <strong>Anglo</strong> <strong>American</strong>’s strategiccommitment to grow the globalmetallurgical coal business to supplyour customers from each of the keymetallurgical coal supply regions ofAustralia, Canada and Mozambique.Metallurgical Coal’s resource base,consisting of Measured, Indicated andInferred (in LOM) Resources additionalto Coal Reserves, totals 3.8 billiontonnes on a 100% basis (2.7 billiontonnes on an attributable basis).Details of Metallurgical CoalResources appear in the CoalReserves and Resources section ofthe <strong>Annual</strong> <strong>Report</strong>, pages 200–203.INDUSTRY OVERVIEWMetallurgical coal, composed ofcoking coal and PCI coal, is anessential raw material in blast-furnacesteel production, which representsapproximately 70% of global crudesteel output.Global metallurgical coal supplyamounts to approximately 1 billiontonnes per year. China is the biggestconsumer of metallurgical coal, withtotal consumption of approximately730 Mt (2) in <strong>2012</strong>. Owing to its largedomestic metallurgical coalproduction, China only needs toimport about 7%, or 50 Mt (3) , of its totalmetallurgical coal requirement. This,however, represents a significantportion (20%) of the total globalseaborne metallurgical coal market.Metallurgicalcoal, composedof coking coaland PCI coal,is an essentialraw materialin blast-furnacesteel production.ORGANISINGCAPCOALOPEN CUT –AUSTRALIANMINE OFTHE YEARMetallurgical Coal’s CapcoalOpen Cut operation won theMining Prospect Award’sAustralian Mine of the YearAward in <strong>2012</strong> owing to safetyimprovements, increasedthroughput at the coal handlingand preparation plant (CHPP) andproduction milestones deliveredover an 18 month period.The site experienced a real stepchange in safety, with the totalrecordable case frequency ratedecreasing by 75% since 2010and the electrical maintenanceworkshop achieving 22 years’lost-time injury free in July <strong>2012</strong>.The site experienced the benefitsof an upgrade to the CHPP, whichincreased capacity at the plantwith the installation of a new 5 Mtcapacity module. In June <strong>2012</strong>,the CHPP achieved record feedtonnes with 1.4 Mt of coalprocessed through the plant inthe month.The introduction of a new ropeshovel at Capcoal has allowedthe site to take advantage ofdouble sided loading. In thefirst half of <strong>2012</strong>, the mineexperienced record metallurgicalcoal production, delivering itshighest first half of the year runof mine tonnes at 3.3 Mt, a 28%improvement on the previousbest half production.ImageMetallurgical Coal’s Capcoal open cut minein Queensland.Operating and financial review<strong>Anglo</strong> <strong>American</strong> plc <strong>Annual</strong> <strong>Report</strong> <strong>2012</strong> 61
OPERATING AND FINANCIAL REVIEW METALLURGICAL COAL<strong>2012</strong> Metallurgical coal demandGlobal 1,095 MtNorth America 29 MtWestern Europe 73 MtJapan65 MtChina746 MtIndia41MtCIS66 MtIncorporating:South America 21MtOther Asia47MtRest of World6 MtSource: AME, Wood Mackenzie, CRU, company reportsand <strong>Anglo</strong> <strong>American</strong> Commodity Research estimates<strong>2012</strong> Metallurgical coal productionGlobal 1,095 MtChina669 MtOceania169 MtNorth America 109 MtCIS100 MtMongolia20 MtRest of World 29 MtSource: AME, Wood Mackenzie, CRU, company reportsand <strong>Anglo</strong> <strong>American</strong> Commodity Research estimatesIn <strong>2012</strong>, the international seabornemetallurgical coal market totalledaround 250 Mt (2) , the major consumingregions being Japan, South Korea,Taiwan, Europe, India, China andBrazil. On average, Australia suppliesroughly two-thirds of the seabornemetallurgical coal market.Historically, annual contract pricing haspredominated in the market. A shift toshorter term pricing in 2010–<strong>2012</strong>saw the majority of contracts pricedon a quarterly basis, with a growingproportion being priced on amonthly basis.The Queensland State Budget wasdelivered in September <strong>2012</strong>, witha royalty rate increase which equatesto a 22% increase on the royalty ratepayable per tonne of coal sold for$200/t or more, with effect from1 October <strong>2012</strong>.STRATEGYEmerging markets, particularly in theAsia-Pacific region, are likely to remainthe driving force behind metallurgicalcoal demand. In light of this,Metallurgical Coal’s strategy is toincrease the value of the business byoptimising existing operations andinvesting in growth projects in thesupply regions best placed to producethe high-margin export metallurgicalcoals sought by our customers. Toimplement this strategy:• A structured programme of assetoptimisation has been designed todeliver industry-best operationalperformance over the existing assetbase, targeting longwall performanceat the underground operations andkey equipment at the open cut mines;• An attractive organic growthpipeline with the potential to triplehard coking coal production tosatisfy growing market demand,including opportunities in Australiaand Canada. To underpin itsindustry leading growth plans,<strong>Anglo</strong> <strong>American</strong> has several exportport options under study inQueensland, Australia, and hassecured port access for the RomanProject in Canada;MetallurgicalCoal has anattractiveorganic growthpipeline withthe potentialto triple hardcoking coalproduction tosatisfy growingmarket demand.• In line with demand from thesteelmaking industry in bothexisting and emerging markets,Metallurgical Coal is realisingincreased value from developingsuperior specialised productofferings tailored to individualcustomers in the steel sector.Operating safely, sustainablyand responsiblyWater management and rehabilitationare key environmental focus areas forMetallurgical Coal. Climate variabilityin the regions in which we operaterequires water management strategiesthat are equally effective in periods offlood and drought. Our rehabilitationstrategy requires disciplinedmanagement of disturbed land and thedevelopment of mine closure plans.To play our part in mitigating theemissions which may contributeto climate change and reduce ourexposure to the carbon pricingmechanism, we have invested morethan $120 million over the past fiveyears to abate 8 Mt of CO 2e emissionsusing available commercial-scaletechnologies.FINANCIAL AND OPERATIONALOVERVIEWMetallurgical Coal recorded anunderlying operating profit of$405 million, 66% lower than the 2011record of $1,189 million. This wasdriven by a 29% decrease in exportmetallurgical coal prices, partiallyoffset by a 25% increase inmetallurgical coal sales volumes.Productivity improvements at both theopen cut and underground operationsand a reduction in weather relatedstoppages, supported by the rigorouspreparation for seasonal rain, led to asignificant increase in metallurgicalcoal production and sales.Year-on-year FOB cash unit costsimproved, with a 10% reduction atthe Australian export operations,and a 20% reduction achieved in thesecond half of the year.Safety and environmentThere were no fatal injuries at ourMetallurgical Coal operations in<strong>2012</strong>. The lost-time injury frequencyrate of 1.75 is the lowest on recordand represented a 29% improvement62 <strong>Anglo</strong> <strong>American</strong> plc <strong>Annual</strong> <strong>Report</strong> <strong>2012</strong>
over 2011 and was attributable tovisible and proactive leadershipand accountability at all levels, afocus on contractor management,and a reduction in the number ofrisks associated with vehiclesand machinery.Markets<strong>Anglo</strong> <strong>American</strong>weighted averageachieved salesprices ($/tonne) <strong>2012</strong> 2011Exportmetallurgical coal 178 251(FOB)Export thermal coal(FOB)96 101Domesticthermal coal 37 35Export metallurgical coal productionincreased by 24% to 17.7 Mt, withrecord production in the second half,and the full year, while thermal coalproduction was in line with the prioryear at 13.0 Mt. Production improvedat both underground and open cutoperations by 29% and 22%respectively, with record run of mineproduction achieved at all of theexport open cut operations. Increasedproduction was driven by assetoptimisation programmes and areduction in rain-related stoppages,supported by rain mitigation initiativesimplemented during 2011.Record coal production wasachieved at the Capcoal open cutmine, with a 28% increase over theprior year, driven by best in classrates on large capacity shovels andoptimal alignment of equipment topit conditions.Dawson delivered a notableturnaround in performance with totalproduction increasing by 18% to arecord of 4.6 Mt. This was due toimproved equipment performance andthe optimisation of the terrace minedesign that was implemented in <strong>2012</strong>.Peace River Coal in Canadasignificantly lifted its coal productionby 47%, underpinned by productivityimprovements and upgrades to thecoal handling and preparation plant.At the underground operations inAustralia, production increased by29%, driven by improved longwallperformance. Moranbah delivered a45% increase in volumes as a result ofa recovery from the partial drift failureand a 47% increase in cutting hours inthe second half of the year comparedto the first half.Thermal coal production was impactedby wet weather in New South Walesand industrial action in the first quarterat Drayton.ProjectsPhase 1 of our wholly ownedGrosvenor project continues tobe developed on schedule. All keypermits and licences are in placeand engineering and procurementactivities are progressing to plan.Construction has commenced on site,with the access road complete andbulk earthworks well under way.Production of longwall coal is forecastto commence in 2016.Record coalproductionwas achievedat the Capcoalopen cut mine,with a 28%increase overthe prior year.Studies for the next phase of ourinvestment programme includeGrosvenor Phase 2, a 6 Mtpa secondlongwall; and Moranbah South,a 12 Mtpa (on a 100% basis),50%-owned joint venture, comprisingtwo longwalls. Exploration andenvironmental approval activities tosupport these projects are in progress.Concept studies are also under wayto develop options to further expandour operations in Australia and BritishColumbia. The Drayton South projectis planned to replace export thermalcapacity for the Drayton mine inNew South Wales.OutlookStrong production from Australiacombined with exports from the USled to oversupply into the weakenedmarket during <strong>2012</strong>, resulting insubstantially lower spot and monthlysettlement prices in the third andfourth quarters. It is anticipated thatthere will be a rebalancing of themarket during the first half of 2013,with demand recovery from Chinaand idling of some high cost USand Australian production. Pricedifferentiation between premium andlower quality products is expected toremain, with continued supply ofsecond tier products from the US.Metallurgical Coal is positioned totake advantage of any future coalprice increases as a result of thefocus on delivering high margin,low cost capacity, and thedemonstrated benefits of assetoptimisation initiatives.Operating and financial reviewAttributablesales volumes(’000 tonnes) <strong>2012</strong> 2011Exportmetallurgical coal17,413 13,983Export thermal coal 6,043 6,274Domesticthermal coal 6,921 7,455Prices for seaborne metallurgical coaldropped sharply in the latter half of theyear, resulting in the average <strong>2012</strong> hardcoking coal price falling by 27% to$210/t from the 2011 average hardcoking coal benchmark price of$289/t. Overall supply of metallurgicalcoal was ahead of 2011 levels, owing toincreased exports from the US, whileAustralian hard coking coal supplyremained below 2010 levels.Hard coking coal prices fell, withlower quality PCI and semi-soft pricesfalling more significantly. The majorityof <strong>Anglo</strong> <strong>American</strong>’s metallurgicalcoal sales were placed against termcontracts with quarterly negotiatedprice settlements.Hard coking coal accounted for67% of Metallurgical Coal’s exportmetallurgical coal sales in <strong>2012</strong>.Operating performanceAttributableproduction(’000 tonnes) <strong>2012</strong> 2011Export17,664 14,190metallurgical coalExport thermal6,046 6,064coalDomestic thermal6,925 7,362coal<strong>Anglo</strong> <strong>American</strong> plc <strong>Annual</strong> <strong>Report</strong> <strong>2012</strong> 63
OPERATING AND FINANCIAL REVIEW THERMAL COALTHERMAL COALGodfrey GomweCEOUNDERLYING OPERATING PROFIT(2011: $1,230 m)$793 mSHARE OF GROUP UNDERLYINGOPERATING PROFIT(2011: 11%)13%UNDERLYING EBITDA(2011: $1,410 m)$972 m01Key financial and non-financial performance indicators$ million (unless otherwise stated) <strong>2012</strong> 2011Underlying operating profit 793 1,230South Africa 482 779Colombia 358 482Projects and corporate (47) (31)Underlying EBITDA 972 1,410Net operating assets 1,965 1,886Capital expenditure 266 190Share of Group underlying operating profit 13% 11%Share of Group net operating assets 4% 4%01 Production geologist Elsie Phelaneand drilling assistant Thabo Mdlulicheck core samples in October 2011at Zibulo, now Thermal Coal’snewest colliery.Non-financial indicators <strong>2012</strong> 2011Number of fatal injuries 2 2Lost-time injury frequency rate 0.20 0.19Total energy consumed in 1,000 GJ 5,742 5,823Total greenhouse gas emissions in 1,000 tonnes CO 2e 1,620 2,583Total water used for primary activities in 1,000 m 3 8,525 8,26064 <strong>Anglo</strong> <strong>American</strong> plc <strong>Annual</strong> <strong>Report</strong> <strong>2012</strong>
BUSINESS OVERVIEWOur Thermal Coal business operatesin South Africa and Colombia. InSouth Africa, Thermal Coal whollyowns and operates seven mines. Italso has a 73% stake in two mines,Kriel and the new Zibulo colliery,a multi-product operation whichproduces thermal coal for both exportand Eskom, the state-owned powerutility, with the balance held by InyosiCoal, a broad-based black economicempowerment entity. In addition,Thermal Coal has a 50% interest inthe Mafube colliery and Pholawashing plant.Six of the mines collectively supply23 million tonnes per annum (Mtpa)of thermal coal to both the exportand local markets. New Vaal,New Denmark and Kriel collieriesare domestic product operationssupplying 29 Mtpa of thermalcoal to Eskom. Isibonelo mineproduces 5 Mtpa of thermal coalfor Sasol Synthetic Fuels, thecoal-to-liquids producer, under a20 year supply contract.Thermal Coal’s South Africanoperations currently route all exportthermal coal through the Richards BayCoal Terminal (RBCT), in which it hasa 24.2% shareholding, to customersthroughout the Mediterranean-Atlanticand Asia-Pacific regions. Exportproduction volumes are expected toincrease in the future owing to yieldimprovements and increasedproduction of lower calorific value coal.In Colombia, <strong>Anglo</strong> <strong>American</strong>,BHP Billiton and Xstrata each havea one-third shareholding in Cerrejón,the country’s largest thermal coalexporter. In 2011, an expansion (P40)was approved to increase this capacityby 8 Mtpa to 40 Mtpa by 2015(13.3 Mtpa attributable). Cerrejónowns and operates its own rail anddeep water port facilities and sells intothe export thermal and pulverised coalinjection (PCI) markets.Thermal Coal’s attributable measuredand indicated resources in addition tocoal reserves totals some 2.6 billiontonnes as detailed in the CoalReserves and Resources section ofthe <strong>Annual</strong> <strong>Report</strong>, pages 204–207.Demand forseabornethermal coalhas increasedby 73.5%since 2001.INDUSTRY OVERVIEWThermal coal is the most abundantsource of fossil fuel energy in theworld. Exceeding known reservesof oil and gas, it accounts for more than40% of electricity generation. Thermalcoal has dominated global energydemand, accounting for 45% ofprimary energy demand growth from2011–<strong>2012</strong>. The near 55% increasein coal demand over the past decadeis roughly equivalent to three timesUS coal consumption on an energyadjustedbasis.The bulk of coal production is usedin power generation; decisionsthat affect the energy mix of powergeneration therefore influence coaldemand. These include long termindustry dynamics for nuclear, gasand renewable power generationand policy decisions on climate/environmental legislation.In <strong>2012</strong>, export seaborne thermalcoal accounted for 910 Mt or 17.5%of total coal production, with a largeproportion of seaborne productioncoming from four key basins:Indonesia, Australia, Colombia andSouth Africa. Demand for seabornethermal coal has increased by 73.5%since 2001, and is expected tocontinue to grow for at least the nextdecade, driven by India and China’simport requirements.Consequently, the key risks tothe medium term growth of exportseaborne thermal revolve aroundthe ability of India and China to sustaintheir rates of economic growth, aswell as logistical constraints and costinflation pressures.In the last few years, the coal industryhas seen growth in US exports,particularly to Europe, due to theavailability of low priced US naturalgas. In <strong>2012</strong>, US exports peaked to55 Mt from 25 Mt in 2010, driving downexport coal prices. US power utilitiescontinue to substitute coal withgas-powered generation; howeverthe long term view is that the naturalgas price will remain between$4-6/million British Thermal Unit(mmBtu), at which point mostof the coal volumes currently lostto gas should revert to beingeconomically viable.ORGANISINGCARRYINGTHEIR PROPERWEIGHTLoading of haul trucks has beenidentified as one of Landau’sbiggest opportunities forimprovement.An internal survey found thatcontractor operators had beenconsistently underloading thecolliery’s fleet of haul trucks.They did so to avoid the vehicles’cut-out switch being activatedautomatically once a truckreached its maximum permittedcapacity – a practice that resultedin throughput inefficiencies at thisround the clock operation.Faced with this under-performance,the mine instigated a plan thatincluded comparing Landau’shaul truck operations with itspeers, using the lessons learnedto adopt best-practice operatortraining. This was thensupplemented by systematicrecalibration of truck loads withcalibrated weights.These actions resulted in a20% improvement in truck loadfactor in <strong>2012</strong> and significantcost savings.ImageA front end loader loads coal on to aconveyor belt in the open pit.Operating and financial review<strong>Anglo</strong> <strong>American</strong> plc <strong>Annual</strong> <strong>Report</strong> <strong>2012</strong> 65
OPERATING AND FINANCIAL REVIEW THERMAL COAL01 Engineering professionalsin training Keith Roelofseand Clair Nel carrying out aroutine lift-cage inspectionat Zibulo.<strong>2012</strong> Thermal coal demandGlobal 910 MtSTRATEGYThe business is focused on beinga high margin producer of thermalcoal, with a growth strategy basedon participating in and expanding intothe most attractive export markets,while maintaining its domestic marketcommitments. It aims to deliver onthis ambition, in the near term, bydeveloping its current portfolio ofexpansion projects. In the longer term,if appropriate, the business willconsider asset purchases tosupplement growth.Thermal coal demand is being drivenby Asian economic growth and itsreliance on low cost, readily availablesupply. China and India will constitutethe majority of thermal coal growth,with demand likely to exceed domesticthermal coal supply, thereby causingan upswing in seaborne thermal coalmarkets in future years. In SouthAfrica, demand for new coal supply isincreasing and is expected to continueto grow in order to supply Eskom’sfuture coal requirements.In support of its strategy to maximisethe value of its portfolio of operatingmines, Thermal Coal’s current primaryfocus is on implementing a collectionof asset optimisation initiatives(Project Khulisa) and integrated mineplanning (Project EVO). The goalof Khulisa (meaning ‘to grow’) isto determine Thermal Coal’s trueperformance potential and implementprogrammes to achieve these targets.In <strong>2012</strong>, the project identified andpursued a total of 88 initiatives, rangingfrom operational improvements tochanging mind-sets and behaviours.Project Khulisa will continue in 2013.In addition to developing and growingoperations in its existing geographies,Thermal Coal is constantly evaluatingpotential opportunities in new andstrategic geographies.EuropeJapanSouth KoreaTaiwanIndiaChinaIncorporating:USARest of World158 Mt125 Mt107 Mt61Mt96 Mt236 Mt8 Mt119 Mt<strong>2012</strong> Thermal coal productionGlobal 910 MtIndonesia 358MtAustralia182MtColombia80MtRussia100 MtSouth Africa 74MtUSA50 MtIncorporating:China5 MtMozambique 1MtRest of World 62 MtSource: Wood Mackenzie, AME, IEA, McCloskey,and <strong>Anglo</strong> <strong>American</strong> Commodity Research estimatesIn <strong>2012</strong>,Thermal Coalidentified andpursued a totalof 88 assetoptimisationinitiatives aspart of ProjectKhulisa.Operating safely, sustainablyand responsiblyTwo principal risks facing ThermalCoal are water and climate change.Coal mining has the potential to affectthe quality of water in catchments thatare already under stress – a risk that ismitigated by careful operational watermanagement and our leading watertreatment facilities. Two carbon- andenergy-related risks Thermal Coalis engaging on are the South Africangovernment’s proposed energy priceincreases, which could double theenergy bill in South Africa over thenext few years, and the anticipatedintroduction of a long term priceon carbon. In South Africa, we areparticipating in a fact-buildingexercise with the government tohelp shape effective carbon policythat is aligned with the country’sdevelopment objectives.FINANCIAL ANDOPERATIONAL OVERVIEWThermal Coal generated an underlyingoperating profit of $793 million, a36% decrease, mainly driven by loweraverage export thermal coal pricesand above-inflation cost pressures.This was partly offset by the closureof high cost sections, a weakerSouth African rand and increasedsales volumes from the fullincorporation of Zibulo as an operatingasset, supported by record productionat Cerrejón.0166 <strong>Anglo</strong> <strong>American</strong> plc <strong>Annual</strong> <strong>Report</strong> <strong>2012</strong>
Safety and environmentSadly, two colleagues lost their liveswhile working at Thermal Coaloperations in South Africa in <strong>2012</strong>.Thorough incident investigationswere conducted to ensure that theroot causes of these incidents areunderstood, corrected and sharedacross the Group.Thermal Coal has been on a journeyof continuous improvement in safetyover the past five years, reflected inthe decrease in the lost-time injuryfrequency rate (LTIFR) from 0.31 in2008 to the current 0.20.Markets<strong>Anglo</strong> <strong>American</strong>weighted averageachieved sales prices($/tonne) <strong>2012</strong> 2011South Africa exportthermal coal (FOB) 92 114South Africadomesticthermal coal 21 21Colombia exportthermal coal (FOB) 89 101Attributablesales volumes(‘000 tonnes) <strong>2012</strong> 2011South Africa exportthermal coal (1) 17,151 16,532South Africadomesticthermal coal (1) (2) 40,110 40,454Colombia exportthermal coal 10,926 10,685(1)Includes capitalised sales from Zibulo mine of1,580,800 (export) and 632,200 (domestic) tonnesfor the year ended 31 December 2011.(2)Includes domestic metallurgical coal of 91,800tonnes for the year ended 31 December <strong>2012</strong>(year ended 31 December 2011: 318,000 tonnes).The international seaborne marketexperienced an overall decline inprices during the year owing tooversupply. The average API4index price fell by 20% to $93/t(2011: $116/t) and closed the yearat $90/t (2011: $105/t).Although international seabornedemand grew by 14% to 910 Mt, itremained below supply growth as aresult of unprecedented US exportvolumes, strong production growthand fewer weather-related supplydisruptions from the major supplyregions of Indonesia, Australia,Colombia and South Africa. CheapUS natural gas displaced a significantvolume of US domestic thermal coal inSouth Africanthermal coalexports intoAsia continuedto increase,principallydriven by India.<strong>2012</strong>, as utility companies switchedfrom coal to gas.For the South African thermal coalindustry, exports into Asia continued toincrease, principally driven by India. Asiaaccounted for 66% of South Africanthermal coal shipments (2011: 64%).South African thermal coal exportsincreased by 4% to 68.3 Mt(2011: 65.7 Mt), supported by a morestable performance by Transnet FreightRail (TFR) and drawdown fromstockpiles. TFR railed 68.5 Mt to theRBCT, a 4% increase over 2011.Operating performanceAttributableproduction(‘000 tonnes) <strong>2012</strong> 2011South Africa exportthermal coal (1) (2) 17,132 16,328Colombia exportthermal coal 11,549 10,752South AfricaEskom coal (1) 33,706 35,296South Africadomestic other (2) 6,293 5,383(1)Includes capitalised production from Zibulo mineof 1,521,800 (export) and 633,400 (domestic)tonnes for the year ended 31 December 2011.(2)Includes domestic metallurgical coal of 91,800tonnes for the year ended 31 December <strong>2012</strong>(year ended 31 December 2011: 323,400 tonnes).South AfricaUnderlying operating profit fromSouth African operations decreasedby 38% to $482 million, driven bylower average export thermal coalprices and above-inflation costincreases in labour, power andfuel. This was partly offset by theincorporation of Zibulo as an operatingasset, a weaker South African randand higher sales volumes, supportedby a more stable TFR rail performance.Export production increased by 5% asa result of Zibulo’s continued ramp upand a change to include lower calorificvalue coals, resulting in higher yieldingproducts at Zibulo and Goedehoop,partly offset by the planned closure ofhigh cost sections at Goedehoop,Greenside and pits at Kleinkopje.ColombiaAt Cerrejón, underlying operatingprofit of $358 million was 26% downon 2011 owing to the impact of lowerthermal coal prices, compensated tosome extent by a strong operationalperformance and drier weatherconditions, with record productionand sales.ProjectsFeasibility studies on the New Largoproject were completed in <strong>2012</strong>. Thereare two stages to the project: Stage 1comprises a 23 kilometre overlandconveyor, which will run from anexisting coal processing plant toEskom’s Kusile power station,transporting a secondary product aswell as other third-party coal. Stage 2entails the construction of a newopencast colliery and associatedinfrastructure. The project is expectedto be presented for board approvalonce all environmental permitshave been obtained for both stagesof the project and the coal supply andother commercial agreements havebeen concluded.The Cerrejón expansion project (P40),to increase the port and logisticschain capacity to handle a totalmine output of 40 Mtpa (currently32 Mtpa), is being implemented and isexpected to be delivered on schedule.OutlookThe international seaborne thermalcoal market is expected to remainoversupplied into 2013. Pricingpressure, therefore, is expected toremain. Thermal coal production cutsare already taking effect to someextent and producers around theglobe continue to review operationsand growth projects which couldfavourably impact prices. Globalseaborne demand is expected tocontinue to grow in 2013, drivenmainly by China and India. The Chinesedomestic market price and the highUS break-even price for producersshould act, respectively, as a naturalfloor and ceiling for seaborne thermalcoal prices.Operating and financial review<strong>Anglo</strong> <strong>American</strong> plc <strong>Annual</strong> <strong>Report</strong> <strong>2012</strong> 67
OPERATING AND FINANCIAL REVIEW COPPERCOPPERJohn MacKenzieCEOUNDERLYING OPERATING PROFIT(2011: $2,461 m)$1,687 mSHARE OF GROUP UNDERLYINGOPERATING PROFIT(2011: 22%)27%01UNDERLYING EBITDA(2011: $2,750 m)$2,179 mKey financial and non-financial performance indicators$ million (unless otherwise stated) <strong>2012</strong> 2011Underlying operating profit 1,687 2,461Underlying EBITDA 2,179 2,750Net operating assets 8,536 7,643Capital expenditure 996 1,570Share of Group underlying operating profit 27% 22%Share of Group net operating assets 17% 17%Non-financial indicators <strong>2012</strong> 2011Number of fatal injuries 0 1Lost-time injury frequency rate 0.20 0.19Total energy consumed in 1,000 GJ 15,559 12,887Total greenhouse gas emissions in 1,000 tonnes CO 2e 1,601 1,467Total water used for primary activities in 1,000 m 3 35,667 28,70101 José Arancibia, operator, at theMantoverde electrowinning coppercathode plant.68 <strong>Anglo</strong> <strong>American</strong> plc <strong>Annual</strong> <strong>Report</strong> <strong>2012</strong>
Applicationsthat makeuse of copper’selectricalconductivitymake upapproximately60% of totalglobal demand.BUSINESS OVERVIEWWe have interests in six copperoperations in Chile. The MantosBlancos and Mantoverde mines arewholly owned and we hold a 50.1%interest in <strong>Anglo</strong> <strong>American</strong> Sur(AA Sur), which includes theLos Bronces and El Soldado minesand the Chagres smelter. We alsohave a 44% shareholding in theCollahuasi mine. The mines produce acombination of copper in concentrateand copper cathode together withassociated by-products such asmolybdenum and silver.In addition, we have a controllinginterest in the Quellaveco (81.9%)and Michiquillay (100%) projectsin Peru and a 50% interest in thePebble project in Alaska.INDUSTRY OVERVIEWCopper’s principal use is in the wireand cable markets because of themetal’s electrical conductivity andcorrosion resistance. Applicationsthat make use of copper’s electricalconductivity, such as wire (includingthe wiring used in buildings), cablesand electrical connectors, make upapproximately 60% of total globaldemand. The metal’s corrosionresistantproperties find numerousapplications, particularly plumbing pipeand roof sheeting, in the constructionindustry, which accounts for a further20% of demand. Copper’s thermalconductivity also makes it suitable foruse in heat-transfer applications suchas air conditioning and refrigeration,which constitute some 10% of totaldemand. Other applications includestructural and aesthetic uses.Access to quality orebodies, locatedin regions providing stable political,social and regulatory support forresponsible and sustainable mining,are likely to continue to be the keyfactor distinguishing project returnsand mine profitability. However, suchorebodies are scarce, and it will beincreasingly necessary for miningcompanies to develop mines in morechallenging environments. With nofundamental technological shiftsexpected in the short to medium term,forecast long term demand is likely tobe underpinned by robust growth incopper’s electrical uses, particularlywire and cable in construction,automobiles and electricityinfrastructure. The key growth areawill continue to be the developingworld, led by China and, in the longerterm, India, where early-stageindustrialisation and urbanisationon a large scale continues to propelcopper demand growth. Moreover,the intensity of copper consumptionis still at a high level in the case ofChina, while in India it is on anupward trajectory. This is in contrastwith the advanced economies andtheir much lower levels of intensity.In spite of near term supply growth thatcould well be noticeably above that ofthe past six or seven years, constraintson the supply side are likely to prove astructural feature of the market. Thiswill be driven by continuing declinesin ore grades at maturing existingoperations and new projects, a lackof capital investment and underexplorationin the industry, as well aspolitical and environmental challengesin many current and prospectivecopper areas.The industry is capital-intensiveand is likely to become more soas high grade surface deposits areexhausted and deeper and/or lowergrade deposits are developed in morechallenging locations. Combined withthe need to develop infrastructure innew geographies, this requires greatereconomies of scale if mines are to becommercially viable. Scarcity of waterin some countries, such as Chile andPeru, is also necessitating theconstruction of capital- and energyintensivedesalination plants.During the period 2000–2011, Chinaincreased its share of first-use refinedmetal consumption from 12% to anestimated 39%. Consumptioncontinued to increase in <strong>2012</strong>, whiledemand elsewhere fell in aggregatefor the second year running, movingChina’s share of refined demandabove 40%.OPERATINGWATERMANAGEMENTIN THE ANDESOur Copper business in Chilewas faced with the challenge ofincreased water requirementsin an already water-constrainedenvironment. With significantdemand on water by various localusers, the Los Bronces operationneeded to minimise its use offresh water from the MetropolitanRegion catchment area, home tomore than 7 million people.When expanding Los Bronces,we constructed a waterrecirculation system stretchingfrom the Las Tórtolas tailings damback to the Los Bronces mine.The system returns water,previously used to transport ore,back to the mine, located some3,600 metres above sea level.Water is pumped through apipeline 52.5 kilometres long,with a total elevation differenceof 2.5 kilometres from end to end.At a total cost of $180 million,the decision to opt for a waterrecirculation system went wellbeyond short term economicconsiderations. A feat of worldclass engineering was required– entailing a trade-off betweenhigher energy requirements andcarbon emissions on the onehand and water savings on theother – if the mine was tohave the capability to adaptsuccessfully to current andanticipated future watersupply limitations.The initiative has reduced themine’s water requirement from0.81 to 0.52 million m 3 /tonne,with more than 22 million m 3being recirculated during <strong>2012</strong>.ImageLas Tórtolas tailings dam, close to theLos Bronces copper mine in Chile.Operating and financial review<strong>Anglo</strong> <strong>American</strong> plc <strong>Annual</strong> <strong>Report</strong> <strong>2012</strong> 69
OPERATING AND FINANCIAL REVIEW COPPERSTRATEGYWe continue to believe our Copperbusiness has attractive long termfundamentals. Short term growth isbeing delivered from the successfulramp up of the Los Bronces expansionfollowing delivery of its first productionin the fourth quarter of 2011. Theexpansion produced a total of196,100 tonnes of copper in <strong>2012</strong>and is now running at full capacity.Additional growth in the mediumterm is expected to come from theQuellaveco project in Peru, which istargeted to be put forward for boardapproval in 2013. We continue toexplore for low operating cost and longlife development opportunities andevaluate longer term projects,including Michiquillay, Pebble,Los Bronces District and West Wall.On 24 August <strong>2012</strong>, <strong>Anglo</strong> <strong>American</strong>completed the disposal of 25.4%of AA Sur, to a Codelco and Mitsuijoint venture company for a cashconsideration of $1.9 billion. As part ofthis transaction, all litigation between<strong>Anglo</strong> <strong>American</strong> and Codelco hasbeen terminated. The agreementdemonstrates our focus on deliveringvalue to shareholders. We remain fullycommitted to our major inwardinvestment programme in the Chileanbusiness and to continuing oursignificant social and communityinvestment commitments in Chile.In September 2011, we announcedour participation in a sales processto dispose of our effective 16.8%interest in Palabora Mining Companyin South Africa. On 11 December <strong>2012</strong>,we reached an agreement to sellour interest for ZAR893 million(approximately $103 million), subjectto regulatory approvals in South Africaand China which are expected to takefour to six months.We continue toexplore for lowoperating costand long lifedevelopmentopportunitiesand evaluatelonger termprojects,includingMichiquillay,Pebble,Los BroncesDistrict andWest Wall.Copper stocks and priceCopper stocks (kt)1,0007505002500Jan 09 Jan 10Jan 11Jan 12Shanghai StocksComex StocksLME StocksCopper price (c/lb)Source: <strong>Anglo</strong> <strong>American</strong> Commodity ResearchOperating safely, sustainablyand responsiblyWater efficiency, re-use and recyclingare a particular focus for our Copperoperations, which are situated inextremely water-scarce regions. Thebusiness is implementing 11 differentwater projects to achieve its waterreduction target.FINANCIAL ANDOPERATIONAL OVERVIEWCopper generated an underlyingoperating profit of $1,687 million, a31% decrease. Higher sales volumesfrom the Los Bronces expansion weremore than offset by the lower averagecopper price and higher operating,exploration and study costs. Lowergrade profiles in particular impactedproduction, and consequently unitcosts, at Collahuasi, Los Bronces,and Mantos Blancos.Safety and environmentCopper’s lost-time injury frequencyrate (LTIFR) was 0.20 (2011: 0.19),while no fatal incidents occurred atmanaged operations. The business’safety efforts have involved closinggaps identified in the risk and changemanagement reviews conductedin 2011, with a particular focus onleadership, contractor management,and fighting fatigue.500450400350300250200150100Copper’s energy initiatives havedelivered a 3-4% reduction, if theimpact of the Los Bronces expansionis excluded. A portfolio of additionalenergy savings programmes is underway to sustain the progress madein <strong>2012</strong>.MarketsAverage price <strong>2012</strong> 2011Average marketprices (c/lb) 361 400Average realisedprices (c/lb) 364 378The copper price rose in the early partof <strong>2012</strong>, from 343 c/lb at the start ofthe year to 387 c/lb by May. AsEurope’s sovereign debt crisis tookhold and Chinese economic growthslowed, concerns grew over theoutlook for the world economy and theprice softened into the second halfof the year. Yet despite an environmentof macroeconomic uncertainty, whichcontinues to have an impact ondemand, the price recovered inSeptember, held up on the back ofsupply-side shortfalls, and ended theyear at 359 c/lb. For the full year, therealised price averaged 364 c/lb, adecrease of 4% compared with 2011.This included a positive provisionalprice adjustment for <strong>2012</strong> of$47 million versus a net negativeadjustment in the prior year of$278 million.Copper price (c/lb)70 <strong>Anglo</strong> <strong>American</strong> plc <strong>Annual</strong> <strong>Report</strong> <strong>2012</strong>
Operating performanceAttributableproduction (tonnes) <strong>2012</strong> 2011Copper 659,700 599,000Total copper production (includingour share of the Collahuasi jointventure) of 659,700 tonnes was 10%higher than in 2011. This was mainlydue to the increased contribution fromthe Los Bronces expansion, offset bylower production at the establishedLos Bronces operation and atCollahuasi and Mantos Blancos.Production at Los Bronces was 65%higher at 365,300 tonnes, with themine benefiting from the 196,100tonnes (2011: 19,000 tonnes) achievedfrom the expansion as it ramped up tofull production. The new processingplant reached throughput designcapacity ahead of expectations inAugust <strong>2012</strong>. This increase in outputwas partially offset by lower gradesaccessed during the year. Productionat the established Los Broncesoperation was impacted by reduced pitflexibility, lower stockpiles and safetydriven reductions in slope angles.Production at El Soldado increasedby 15% to 53,800 tonnes, owingto improved plant performance,expected higher ore grades andbetter recoveries. Production atMantoverde also increased, by 6%,to 62,300 tonnes, driven by improvedLeading copper consumers(<strong>2012</strong> estimated refined copper consumption)<strong>2012</strong> estimated world total: 19.9MtMtChinaEurope3.88.2crushing performance. MantosBlancos’ production of 54,200 tonnesdecreased by 25%, affectedby an incident involving a loadernecessitating a change in mine plan,resulting in a lower ore grade areabeing mined.Our share of production at Collahuasifell by 38% to 124,100 tonnes, partlyowing to anticipated lower gradesbeing mined during the year. Thiswas exacerbated by lower recoveries,adverse weather conditions in theearly months, safety stoppages anda ball mill failure.In response to the performance issuesat Collahuasi, the joint venture partnersput in place a business improvementplan, with an <strong>Anglo</strong> <strong>American</strong> andXstrata joint management teamassuming leadership from July. Theteam has implemented a number ofimprovement plans aimed at deliveringimproved operating performancein 2013. A new CEO was appointedat Collahuasi with effect from19 December <strong>2012</strong>.ProjectsIn Peru, the Quellaveco projectreceived three critical permits in thefourth quarter: an amendment to theenvironmental impact assessment,the beneficiation concession andthe key water permit. Communityengagement continued throughthe ‘dialogue table’ process, whereagreement was reached in July inrelation to water usage, environmentalresponsibility and <strong>Anglo</strong> <strong>American</strong>’ssocial contribution over the life of themine. <strong>Anglo</strong> <strong>American</strong> is targetingsubmission of the project to its Boardfor approval in 2013. The concept levelstudy for the Michiquillay project wascompleted and is under review.Activity at the Pebble project inAlaska continues, with the focus oncompleting a pre-feasibility studyand preparing to commencepermitting. The draft Bristol BayWatershed Assessment was releasedby the Environmental ProtectionAgency (EPA) in May <strong>2012</strong>. TheEPA has announced that it has revisedthe draft watershed assessmentreport to take account of feedbackand it intends to have the revisedassessment peer reviewed andcommented on publicly with a viewto finalising the assessment in 2013.In Peru, theQuellavecoproject receivedthree criticalpermits in thefourth quarter:an amendmentto theenvironmentalimpactassessment, thebeneficiationconcessionand the keywater permit.At Collahuasi, the project to increaseconcentrator plant throughput to160,000 tonnes of ore per daywas reduced in scope and thepre-feasibility study on the furtherexpansion potential was put on hold,both pending restoring operationalstability of current operations.OutlookProduction levels in 2013 areexpected to benefit from theexpanded Los Bronces operationrunning at full capacity for the full year.Mine development and improvingmine flexibility will be a continued focusat Los Bronces, which will also impactcosts. Increased production is alsoexpected at Collahuasi followingimplementation of the improvementplans put in place during <strong>2012</strong>, as wellas the No. 3 ball mill coming back into operation from November <strong>2012</strong>,and planned mining of higher oregrade phases.Challenges remain in managingcontinuing industry-wide input costpressures, and this will be a keyfocus for the business in 2013.Ongoing market concerns arisingfrom uncertainties over the near termoutlook for the global economy maylead to short term volatility in thecopper price. The medium to long termfundamentals for copper, however,remain strong, predominantly drivenby robust demand from the emergingeconomies and supply constraintsowing to ageing mines and steadilydeclining average grades.Operating and financial reviewRest of worldN. America1.9JapanSouth KoreaIndiaBrazil0.60.41.00.73.3Source: Brook Hunt – a Wood Mackenzie company<strong>Anglo</strong> <strong>American</strong> plc <strong>Annual</strong> <strong>Report</strong> <strong>2012</strong> 71
OPERATING AND FINANCIAL REVIEW NICKELNICKELWalter De SimoniCEOUNDERLYING OPERATING PROFIT(2011: $57 m)$26 mSHARE OF GROUP UNDERLYINGOPERATING PROFIT(2011: 1%)0.4%UNDERLYING EBITDA(2011: $84 m)$50 mKey financial and non-financial performance indicators$ million (unless otherwise stated) <strong>2012</strong> 2011Underlying operating profit 26 57Underlying EBITDA 50 84Net operating assets 2,509 2,535Capital expenditure 100 398Share of Group underlying operating profit 0.4% 1%Share of Group net operating assets 5% 6%01Non-financial indicators <strong>2012</strong> 2011Number of fatal injuries 1 –Lost-time injury frequency rate 0.11 0.23Total energy consumed in 1,000 GJ 19,154 15,364Total greenhouse gas emissions in 1,000 tonnes CO 2e 1,421 1,423Total water used for primary activities in 1,000 m 3 7,090 7,13801 Risk engineer Renner Ferreira deFreitas on the observatory of theBarro Alto ferronickel plant, which issteadily ramping up to full capacity.72 <strong>Anglo</strong> <strong>American</strong> plc <strong>Annual</strong> <strong>Report</strong> <strong>2012</strong>
BUSINESS OVERVIEWOur Nickel business unit comprisestwo Brazilian operating assets:Codemin and Barro Alto, bothferronickel producers in the state ofGoiás. Within the portfolio there arealso two promising growth projects,Jacaré and Morro Sem Boné, bothlaterite deposits which are also locatedin Brazil.In Venezuela, despite attempts byMinera Loma de Níquel to obtainconcession and permit renewal toenable a continuation of ouroperations, the application for renewalwas refused and the concessions andpermits granted by the governmentexpired on 10 November <strong>2012</strong>.As of 10 November <strong>2012</strong>, therefore,<strong>Anglo</strong> <strong>American</strong>’s mining andproduction activities at Loma de Níquelceased permanently and, in light ofthis, <strong>Anglo</strong> <strong>American</strong> has taken actionto end its working relationship withthe majority of its Loma de Níquelemployees and is seeking to wind upthe operations in an orderly fashion.INDUSTRY OVERVIEWNickel demand is linked to the stateof the stainless steel industry, whichconsumes two-thirds of the metaland all ferronickel production. Nickelused in the manufacture of alloy steeland other non-ferrous alloys accountsfor a further 17% of output.China is the largest stainless steelproducing country, with more than44% of world production in <strong>2012</strong>, with70% of the related nickel requirementproduced domestically. Of this, nickelpig iron (NPI) accounted for around60% in <strong>2012</strong>. The next most importantproducer is Europe, which accountsfor 22% of world output, while the USproduces 6%.Nickel can be produced from twodifferent ore types: sulphides andlaterites. This has resulted in a largenumber of processing technologiesthat have made the industry a verycomplex one, with high processingcosts and capital intensity. Productionis concentrated among the biggestfive producers, which between themare responsible for almost half ofglobal output.The nickel industry faced a varietyof challenges in <strong>2012</strong>. Demand wasaffected by the European debt crisisand the slowdown in the Chineseeconomy, while the supply sidecontinued to face increased capitalexpenditure pressure and technicalissues that delayed the ramp up ofmany projects in the industry.STRATEGYOur Nickel business focuses on thesafe and responsible operation ofworld class assets that have long lifeof mine and competitive productioncosts. We leverage our expertise inoperating ferronickel plants to ensurewe have optimal processes in placeacross our operations; our Codeminplant celebrated 30 years of operationsin <strong>2012</strong>.Delivery of efficient production issupported by our asset optimisationinitiatives which are driving improvedoutput, reduced costs and revenueenhancements, and will extend thelives of both our operations.At full production, both Barro Alto andCodemin are positioned in the first halfof the industry’s cash cost curve.In addition to driving value fromexisting operations, Nickel continuesto assess its portfolio of expansionaryand exploration projects.Our strategy and growth ambitionsrely on attracting and retaining asuitably qualified workforce. Themining industry in Brazil continuesto face a difficult labour market, witha shortage of qualified people withspecific knowledge of the miningindustry. Only by addressing andovercoming this challenge will we beable to deliver on our strategy. One ofthe ways we are doing so is through ourtailored trainee programme designedto develop engineers and otherprofessionals capable of meeting ourfuture needs.Our Nickelbusinessfocuses onthe safe andresponsibleoperation ofworld classassets thathave long lifeof mine andcompetitiveproductioncosts.EMPLOYINGTRAINING OURFUTUREPROFESSIONALSOne of the ways we areaddressing the shortage ofqualified people at our Nickeloperations in Brazil is throughour tailored trainee programmeto develop engineers intofuture leaders.The selection process for theinaugural intake in <strong>2012</strong> tookplace during the preceding year,with 11,649 graduates competingfor 31 vacancies. Those selectedwere knowledgeable in suchareas as: supply chain, sustainabledevelopment, geology,production and maintenance,human resources andinformation management.In early <strong>2012</strong>, the trainees weresent to gain hands-on workexperience at Barro Alto,Niquelândia, our São Paulocorporate office and Nickel’sproject office in Belo Horizonte.The trainees are working, on arotation basis, at the various sites,until the programme ends in mid-2013. On successful completionof the programme, the traineeswill be considered completelyprepared professionals, readyto meet the challenges of theircareer in <strong>Anglo</strong> <strong>American</strong>.ImagePart of the inaugural intake of graduatetrainees at our Nickel business in Brazil.Operating and financial review<strong>Anglo</strong> <strong>American</strong> plc <strong>Annual</strong> <strong>Report</strong> <strong>2012</strong> 73
OPERATING AND FINANCIAL REVIEW NICKEL01 Electricians Cesar Augustode Lima and AntonioMilhomen Silva next to oneof Barro Alto’s 185 metrerotary kilns, wherenickel-bearing ore isreduced prior to smelting.Operating safely, sustainablyand responsiblySafety and sustainable developmentare central to our strategy. We managesafety and environment risks throughour Integrated Management System,which is certified to the ISO 9001,ISO 14001 and OHSAS 18001 globalstandards and we continue to focuson risk identification and control,employee training and leadershipcommitment. Our environmentalstrategy includes a focus on water,energy and greenhouse gas emissions.We have made pleasing progress inthese areas and incorporated what wehave learned from Codemin into thedesign of Barro Alto.Our opencast mining processescan have a notable impact on thelandscape, and can be difficult tofully rehabilitate, particularly insloped areas. We have partneredwith biodiversity NGOs andscientific groups to develop regionalspecific plans for the remediation offauna and flora in order to determinethe best solutions to overcome thisdifficulty, while aligning them to ourclosure plans.Recognising the importance of therole we play in the local community,we also have invested significantlyin long term programmes related tofemale empowerment, sexual andreproductive health, citizenship andrural entrepreneurship. In recognitionof this work, the business received the‘Sustainable Company of the Year<strong>2012</strong>’ award from Exame businessmagazine, one of the most prestigioussustainability awards in Brazil.Nickel’senvironmentalstrategyincludes afocus on water,energy andgreenhousegas emissionsand we haveincorporatedwhat we havelearned fromCodemin intothe design ofBarro Alto.Nickel stocks and priceNickel stocks (kt)18016014012010080604020252015105Nickel price (c/lb)01FINANCIAL ANDOPERATIONAL OVERVIEWUnderlying operating profit for the yearwas $26 million (net of $32 millionproject evaluation operating costs),54% lower than in 2011. It included aself-insurance recovery of $59 million(offset at <strong>Anglo</strong> <strong>American</strong> Group)and an amount of $12 million in termsof the favourable settlement of anoutstanding tax claim with the Braziliangovernment. The results, however,were affected significantly by a 23%decline in the London Metal Exchange(LME) nickel price and by an extended0Jan 09 Jan 10Jan 11Jan 12LME StocksLME PriceSource: <strong>Anglo</strong> <strong>American</strong> Commodity Research074 <strong>Anglo</strong> <strong>American</strong> plc <strong>Annual</strong> <strong>Report</strong> <strong>2012</strong>
Leading nickel consumers(<strong>2012</strong> estimated refined nickel consumption)<strong>2012</strong> estimated world total: 1,700 ktktChinaEuropeJapanN. America144South Korea79India66South Africa22163Rest of World58Taiwan57404Source: Brook Hunt – a Wood Mackenzie company705export ban imposed by the Venezuelangovernment from the beginning ofJune, resulting in the cessation ofproduction in September. Theunderlying operating result for BarroAlto was capitalised throughout <strong>2012</strong>.Safety and environmentRegrettably, a fatal incident occurredat the Barro Alto mine, ending Nickel’srecord five year fatality-free period.The incident has sparked renewedefforts to prevent further harm.The business’ lost-time injuryfrequency rate (LTIFR) improved by52% to 0.11 (2011: 0.23).MarketsAverage nickel price(c/lb) <strong>2012</strong> 2011Average marketprice (LME, cash) 794 1,035Average realisedprice (c/lb) 765 1,015Despite LME nickel pricestrengthening at the start of <strong>2012</strong>, withthe nickel price reaching 983 c/lb atthe end of January, prices droppedto a low of 689 c/lb in August owingto the worsening macroeconomicenvironment which affected stainlesssteel production and nickel demand.The nickel market recorded a surplusof 50,000 tonnes for the yearcompared with a surplus of 32,000tonnes in 2011. Nickel consumptionincreased by 4.9% to 1.7 million tonnes(Mt), but supply also rose following theramping up of a number of new nickelplants. The growth in supply was lowerthan expected as a result of problemsat many new operations.Operating performanceAttributableproduction(tonnes) <strong>2012</strong> 2011Nickel 39,300 29,100Nickel production increased by 35%to 39,300 tonnes, with the increasingproduction profile from Barro Altooffsetting the lower output fromLoma de Níquel.Barro Alto, which produced its firstmetal in March 2011, delivered around21,600 tonnes of nickel in <strong>2012</strong>.Production and the ramp up scheduleat the new operation was, however,affected by three major stoppagesduring the year in order to address kilnperformance issues and to rebuild thesidewalls in line 1’s electric furnace,following a partial collapse.Since the end of the final stoppage,with the furnace returning to atemperature which can support normaloperations in mid-December, line 1has achieved a feed rate averaging85% of nominal capacity.As a preventative measure, line 2’selectric furnace sidewalls are now alsobeing rebuilt and following this, theoperation is expected to completeits ramp up to nominal capacity.Issues in the furnace hearths werediscovered during the year. Thesituation is being closely monitoredby the operation, together with thesupplier, and since discovery hasnot worsened. With continued closemonitoring this is not expected to alterthe ability to reach nominal capacity.Barro Alto,which producedits first metalin March 2011,deliveredaround 21,600tonnes of nickelin <strong>2012</strong>.Production from Loma de Níqueltotalled 8,100 tonnes in the year, 40%lower than 2011, as a result of thecessation of operations, exacerbatedby the extended export ban.Codemin’s production was stable ataround 9,600 tonnes, with a decline ingrade being offset by a series of assetoptimisation initiatives.ProjectsThe unapproved projects in thepipeline at Jacaré and Morro SemBoné have the potential to significantlyincrease the Group’s total nickelproduction. The pre-feasibility studyof Jacaré was completed in the yearand we will focus on obtainingenvironmental licences during 2013.OutlookProduction in 2013 is expected to behigher than <strong>2012</strong> as the increasingcontribution from Barro Alto more thanoffsets the loss of Loma de Níquel.Barro Alto is targeting to reach fullcapacity during 2013.Both demand and supply are expectedto increase further in 2013 and asurplus of 13,000 tonnes is forecast.The market is expected to remainrelatively challenging owing to theprevailing macroeconomicenvironment and ramp up of newnickel supply, including NPI – thoughany further underachievement interms of the ramping up of new nickelsupply could provide some upside tocurrent forecasts.Operating and financial review<strong>Anglo</strong> <strong>American</strong> plc <strong>Annual</strong> <strong>Report</strong> <strong>2012</strong> 75
OPERATING AND FINANCIAL REVIEW PLATINUMPLATINUMChris GriffithCEO –<strong>Anglo</strong> <strong>American</strong>Platinum LimitedUNDERLYING OPERATING(LOSS)/PROFIT(2011: $890 m)$(120) mSHARE OF GROUP UNDERLYINGOPERATING PROFIT(2011: 8%)(2)%UNDERLYING EBITDA(2011: $1,672 m)$580 m01Key financial and non-financial performance indicators$ million (unless otherwise stated) <strong>2012</strong> 2011Underlying operating (loss)/profit (120) 890Underlying EBITDA 580 1,672Net operating assets 10,419 11,191Capital expenditure 822 970Share of Group underlying operating profit (2)% 8%Share of Group net operating assets 20% 25%Non-financial indicator <strong>2012</strong> 2011Number of fatal injuries 7 12Lost-time injury frequency rate 1.15 1.27Total energy consumed in 1,000 GJ 24,399 25,168Total greenhouse gas emissions in 1,000 tonnes CO 2e 5,743 5,991Total water used for primary activities in 1,000 m 3 28,755 31,24801 No. 1 shaft at Siphumelele, one of ourPlatinum business’ five mines at itsRustenburg section, the world’s biggestproducer of primary platinum.76 <strong>Anglo</strong> <strong>American</strong> plc <strong>Annual</strong> <strong>Report</strong> <strong>2012</strong>
BUSINESS OVERVIEWOur Platinum business, based inSouth Africa, is the world’s leadingprimary producer of platinum, andaccounts for approximately 40% of theworld’s newly mined production of themetal. Platinum mines, processes andrefines the entire range of platinumgroup metals (PGMs): platinum,palladium, rhodium, ruthenium, iridiumand osmium. Base metals such asnickel, copper and cobalt sulphate areimportant secondary products and aresignificant contributors to earnings.Platinum’s operations exploit theworld’s richest reserve of PGMs,known as the Bushveld Complex,which contains PGM-bearingMerensky, UG2 and Platreef ores.Access to an excellent portfolio of orereserves ensures Platinum is wellplaced to be the world’s major platinumproducer for many years to come.Platinum wholly owns 10 miningoperations currently in production,a tailings re-treatment facility, threesmelters, a base metals refineryand a precious metals refinery.Concentrating, smelting and refiningof the output are undertaken atRustenburg Platinum Mines’ (RPM)metallurgical facilities.Platinum’s 100%-owned miningoperations currently consist of thefive mines at Rustenburg Section –Khomanani, Bathopele, Siphumelele,Thembelani and Khuseleka;Amandelbult Section’s two mines,Tumela and Dishaba; as well asMogalakwena and Twickenhammines. Union mine is 85% held, with ablack economic empowerment (BEE)partner, the Bakgatla-Ba-Kgafelatraditional community, holdingthe remainder. The Unki mine inZimbabwe is currently wholly ownedpending the implementation ofthe state’s recently approvedindigenisation plan.Platinum also has 50:50 joint ventureswith a BEE consortium, led by AfricanRainbow Minerals, at Modikwaplatinum mine; and with XK PlatinumPartnership in respect of the Mototolomine. In addition, Platinum has 50:50pooling and sharing agreementswith Aquarius Platinum covering theshallow reserves of the Kroondal andSince 2000,China has beenthe leadingplatinumjewellerymarket,followed byEurope, Japanand NorthAmerica.Marikana mines. The companyowns 49% of Bokoni mine andholds, through RPM, 27% of AtlatsaResources. Platinum is in partnershipwith Royal Bafokeng Resources,and has a 33% shareholding in thecombined Bafokeng-Rasimoneplatinum mine (BRPM) and Styldriftproperties. Platinum, through RPM,holds 12.6% of RB Plats’ issuedshare capital.INDUSTRY OVERVIEWPGMs have a wide range of industrialand high technology applications.Demand for platinum is drivenprimarily by its use in autocatalyststo control emissions from bothgasoline and diesel engine vehicles,and in jewellery. These uses areresponsible for 70% of total netplatinum consumption. PGMs,however, have a wide range of otherapplications, predominantly in thechemical, electronic, medical, glassand petroleum industries.Our Platinum business is the majorfunder and supporter of the PlatinumGuild International (PGI), which playsa key role in encouraging demand forplatinum and in establishing newplatinum jewellery markets. Since2000, China has been the leadingplatinum jewellery market, followedby Europe, Japan and North America.Industrial applications for platinumare driven by technology and,especially in the case of autocatalysts,by legislation. With the rapid spread ofexhaust emissions legislation, morethan 94% of new vehicles now haveautocatalysts fitted. The intensifyingstringency of emissions legislationwill drive growth in PGM demand.Palladium’s principal application,accounting for some 45% of demand,is in autocatalysts, particularly ingasoline vehicles. The metal is alsoused in electronic components, dentalalloys and, more recently, has becomean emerging jewellery metal inmarkets such as China.Rhodium is an important metal inautocatalytic activity, which accountsfor nearly 80% of net demand.STRATEGICPORTFOLIOREVIEWOn 15 January 2013, <strong>Anglo</strong><strong>American</strong> announced theproposals of its portfolio review,the objective of which was toassess the options available tocreate a sustainable, competitiveand profitable <strong>Anglo</strong> <strong>American</strong>Platinum. The entire value chainwas reviewed, including costs,resources, mining, processing,the marketing and commercialstrategy, as well as the optimalshape and size of the portfolio.The main recommendation is toreduce Platinum’s productiontarget by around 400,000 ouncesa year to between 2.1 and2.3 million ounces per annum andto more closely align output withexpected demand, while retainingthe flexibility to meet potentialincreased demand. Thisrecommendation may beachieved through the proposalsmade within the consultationprocess embarked upon in termsof the requirements of the LabourRelations Act 66 of 1995, i.e. theclosure of Khuseleka andKhomanani mines (four shafts)and placing them on long termcare and maintenance, andthrough consolidatingRustenburg into three operatingmines. Should these proposalsultimately be implemented,production at Rustenburg mineswould reduce to a sustainablelevel of between 320,000 and350,000 ounces a year.Production from high cost assetswill be replaced with that fromlow cost, high quality assets overthe next decade. The productionprofile indicates excess smeltingand refining capacity in the shortto medium term and provides anopportunity to improve capitalefficiency. Options are beingevaluated to fill capacity andreduce costs. The cost basewill also be reduced to align withthe revised production levels,with a focus on labour andorganisational structure.Operating and financial review<strong>Anglo</strong> <strong>American</strong> plc <strong>Annual</strong> <strong>Report</strong> <strong>2012</strong> 77
OPERATING AND FINANCIAL REVIEW PLATINUMSTRATEGYIn reformulating its strategy,Platinum has reviewed the businessacross the entire value chain toaddress structural challenges thathave eroded profitability over timewith the intention of creating a safe,sustainable, competitive and profitableplatinum business for the long termbenefit of all its stakeholders.This will be achieved through thealignment of baseline productionwith long term demand expectations,focusing on a high quality portfolioof operations to produce PGMs onan economically sustainable basis.An organisational design has beendeveloped to ensure that theoperations are supported by anappropriate level of overhead, whilethe commercial strategy aims toensure value and stability for Platinumand customers, while promoting newPGM applications. Operationally, thebusiness intends to increase exposureto lower risk, higher margin, lesscapital intensive mines, supporting asignificant reduction in the cost baseand a more efficient allocation ofcapital. Flexibility for long termgrowth options will nevertheless beretained, ensuring Platinum is wellpositioned should demand increaseabove expectation.Platinum continues to take its socialresponsibility seriously, particularlyto its employees and surroundingcommunities. The implementationof the strategy aims to deliver a stable,competitive and profitable businessthat will be best placed to sustain andcreate employment over the long term.Operating safely, sustainablyand responsiblyThe journey to zero harm remains akey strategic objective. Although thecompany’s safety strategy remainssound, it continues to review andadjust it in order to ensure that itspecifically targets the major causesof injuries and fatalities. Platinum isalso working tirelessly with its partnersin government and its workforce toimplement more effective meansof addressing major risks andnon-compliance with standards.Platinum’simplementationof its strategyaims todeliver a stable,competitiveand profitablebusiness thatwill be bestplaced tosustain andcreateemploymentover thelong term.Platinum price$ (oz)2,0001,8001,6001,4001,2001,000800H1 2011 marketprice: $1,792/ozH1 2011 achievedbasket price:R20,194/ozH2 2011 marketprice: $1,650/ozH2 2011 achievedbasket price:R19,061/ozJan 11Jun 11Rand Pt. basketPlatinumSource: <strong>Anglo</strong> <strong>American</strong> Commodity ResearchGross platinum demandby application’000 oz2008200920102011<strong>2012</strong>Dec 110 4,500 9,000AutocatalystJewelleryChemicalElectricalGlassinvestmentIncorporating:Medical and BiomedicalPetroleumOtherSource: Johnson Matthey Interim Review <strong>2012</strong>H1 <strong>2012</strong> marketprice: $1,558/ozH1 <strong>2012</strong> achievedbasket price:R20,086/ozJun 12H2 <strong>2012</strong> marketprice: $1,551/ozH2 <strong>2012</strong> achievedbasket price:R19,504/ozGross platinum supplyby country’000 oz2008200920102011<strong>2012</strong>25,00020,00015,00010,0005,0000Dec 12Rand (oz)0 3,500 7,000South AfricaRussiaNorth AmericaZimbabweOthersSource: Johnson Matthey Interim Review <strong>2012</strong>78 <strong>Anglo</strong> <strong>American</strong> plc <strong>Annual</strong> <strong>Report</strong> <strong>2012</strong>
01 At Mogalakwena North,maintenance work takesplace on a spare grizzlyunit, which forms part ofthe mine’s secondarycrusher circuit. Keepinga complete spare unit inworking order cuts downtimeto a minimum when theoriginal grizzly has to go infor maintenance.FINANCIAL ANDOPERATIONAL OVERVIEWPlatinum recorded an underlyingoperating loss of $120 million in<strong>2012</strong>, compared with $890 millionunderlying operating profit in 2011.This was primarily due to lowersales volumes, the impact of highermining inflation on costs and loweraverage realised prices. Platinumsales volumes for the period werelower owing to the two month illegalindustrial action experienced atmost of the mining operations in thefourth quarter. This was compensatedin part by a weaker average randagainst the dollar and a positivestock adjustment of $172 million.Cash operating costs perequivalent refined platinum ounceincreased by 21% to ZAR16,364(2011: ZAR13,552), primarily due tothe impact of the strike and increasesin the costs of labour, electricity,diesel and key inputs of processingoperations. Productivity decreasedby 4% to 6.05m 2 (2011: 6.32m 2 ).Refined platinum productionand sales decreased by 6% and17% respectively.Safety and environmentSeven employees lost their lives duringthe period and Platinum extends itssincere condolences to their families,friends and colleagues. The causes ofthe loss of life included falls of groundand transport related incidents. Thecompany’s safety performance hasimproved since 2007, and the fatalinjury and lost-time injury frequencyrates have come down by 54% and44% respectively.The proactive management of safetyrisks resulted in a decrease in thenumber of safety stoppages duringthe year. In <strong>2012</strong>, there were 52 safetystoppages in Platinum’s operations,compared with 81 in 2011. Since thesafety stoppages were contained tothe areas where deviations wereobserved, the impact on productionwas considerably reduced in <strong>2012</strong>.MarketsGross platinum demand declinedby 140,000 ounces, or 2%, in<strong>2012</strong>, as a result of weaker demandfor autocatalyst and industrialapplications more than offsettingincreases in jewellery demand initiatedby lower platinum pricing. Primarysupply of platinum was negativelyaffected by labour stoppages and mineclosures in South Africa. In addition,autocatalyst recycling decreased by16% in the year, in response to lowerplatinum prices.The palladium market moved from asurplus in 2011 to a significant deficit in<strong>2012</strong>. South African output was lowerfor the same reasons as for platinum,while less metal was sold fromRussian stockpiles. Gross demand forpalladium rose by 15%, or 900,000ounces, in <strong>2012</strong>, following an increasein demand from the autocatalyst sectorand a return of investor interest.Following a prolonged surplus, therhodium market moved into balancein <strong>2012</strong>, with reductions in supplybalancing increased demand fromthe autocatalyst and chemical sectors.AutocatalystsGlobal light vehicle sales grew by 5%in <strong>2012</strong> to 81 million units reflecting,for vehicles lighter than 3.5 tonnes,growth in North America, Japan andthe BRIC nations (Brazil, Russia, Indiaand China). This growth was offset byweakness in Europe and other regions.Ongoing economic uncertainty inEurope, for example, continued toimpact demand for new vehicles there,with sales approximately 8% belowthose in 2011.Increased substitution of palladiumfor platinum, together with a rise inthe production of gasoline vehiclesin North America and China, resultedin a 7% increase in demand forpalladium. Higher output of gasolinevehicles in <strong>2012</strong> also underpinned a6% increase in rhodium demand.Supplies of PGMs from recycling ofspent catalysts decreased by 12% to2.8 million ounces.01Operating and financial review<strong>Anglo</strong> <strong>American</strong> plc <strong>Annual</strong> <strong>Report</strong> <strong>2012</strong> 79
OPERATING AND FINANCIAL REVIEW PLATINUM01 Unki mine’sconcentrator plantin Zimbabwe.02 Fitter assistant MosesNyamunda and chairliftoperator Sankie Mafokoworking on maintainingthe conveyorsat Marikana No. 4shaft decline.JewelleryGross platinum demand for thefabrication of jewellery rose by 10%to 2.7 million ounces, as strongdemand from China and Indiabalanced generally weaker economicconditions across the globe. Withplatinum trading at a discount to goldthroughout the year, manufacturerswere able to receive higher margins,encouraging the use of platinum inChina, while demand in India continuesto grow faster than other markets inpercentage terms.Gross demand for platinum for thefabrication of jewellery in China roseby 14% in <strong>2012</strong>, to approximately1.9 million ounces, of which recycledplatinum jewellery represented halfa million ounces. Platinum purchasesby manufacturers increased by 16%to 1.4 million ounces.IndustrialFollowing record demand for platinumin 2011, as purchasers addresseddelayed consumption, platinum offtakefor industrial applications decreasedby 16% to 1.7 million ounces.InvestmentInvestment demand for platinumwas flat at 460,000 ounces in <strong>2012</strong>,although the performance during theyear was erratic. Japanese buyers oflarge bars were very active in themonths when the price was lower thanYen 4,000/gram ($1,550 per ounce).The release of the Canadian PlatinumMaple Leaf and the AustralianPlatinum Platypus bullion coinsalso boosted interest in demand.After significant liquidation ofpalladium ETFs in 2011, positivesentiment resulted in a 16%increase in net holdings in <strong>2012</strong>,to 2.04 million ounces.010280 <strong>Anglo</strong> <strong>American</strong> plc <strong>Annual</strong> <strong>Report</strong> <strong>2012</strong>
Operating performanceProductionPlatinum’s own mines, includingWestern Limb Tailings Retreatment,produced 1.46 million of equivalentrefined platinum ounces, a decreaseof 9%.The illegal strike action at our miningoperations from 18 September to15 November <strong>2012</strong> resulted in a lossof platinum production of 306,000ounces, of which 82,000 ounceswere lost during the subsequent rampup period.Equivalent refined platinum productionfor the year totalled 2.22 millionounces, 8% down on 2011.Production at the Western Limboperations (Rustenburg, Union andAmandelbult mines) was negativelyaffected by the industrial action duringthe second half of <strong>2012</strong>. Productionat the Rustenburg Complex minesdecreased by 43,300 ounces, or 8%,while Union and Amandelbult mines’production decreased by 13% and23% respectively.Mogalakwena mine output decreasedby 2% to 300,200 ounces, followinglower throughput at the concentratorsand lower head grade. The fall inproduction was partly compensatedby higher volumes from Unki mine.Equivalent refined platinumproduction at Unki increased by20% to 62,100 ounces as the mineexceeded its ramp up schedule,reaching steady state productionlevels ahead of schedule.The new nickel tank house at theBase Metal Refinery continuesto experience some operationalchallenges and this is expectedto impact production in 2013.Refined platinum productiondecreased by 6% to 2.38 millionounces as the processing of pipelinestocks into refined ounces in thesecond half of <strong>2012</strong> reduced theimpact of the industrial action.ProjectsSeveral projects were halted duringthe year owing to the current difficulteconomic and operating environment,including the Thembelani 2 shaft,Tumela 4 shaft, and slag cleaningfurnace 2 projects. The subsequentwrite-down for Thembelani 2 shaftproject was ZAR2.2 billion($251 million) while the write-downfor Tumela 4 shaft, slag cleaningfurnace 2 and other projects wasZAR4.4 billion ($579 million).OutlookDespite the lacklustre outlook forglobal economic growth, Platinumbelieves that global platinum demandis likely to be balanced in the shortterm. Overall platinum demand isexpected to grow marginally in 2013,despite the lack of economic growthin the European market. Tighteningemissions legislation in all markets,and the overall global increase invehicle production, especially in Chinaand India, is expected to offset lowervolumes in Japan, North <strong>American</strong>and Europe. Jewellery demand isexpected to grow, primarily owing tothe continuing growth in the popularityof platinum jewellery in China and Indiaand the expansion of retail outlets inChina by Hong Kong jewellers.Primary supply challenges areexpected to continue during 2013,with higher mining inflation exertingmargin pressure and the increased riskof supply disruptions from industrialaction in South Africa. The ongoingconstraint on capital investmentposed by low prices continues to limitSouth African output. However,supplies of metal from the recyclingof spent autocatalysts are expected torise as pipeline stocks are processed.Palladium demand is expected togrow in 2013, supported by globalvehicle production growth, particularlyin China, and tightening emissionslegislation. Primary supply is alsoexpected to be constrained by thesame factors as those affectingplatinum production. As a result,the palladium market is expectedto remain in deficit in 2013.The rhodium market is expectedto remain in balance during 2013.Modest growth in autocatalyst andnew industrial demand is likely tobe balanced by an increase inrecycled supply.Following the conclusion of the recentportfolio review, Platinum expects toproduce between 2.1 and 2.3 millionounces of refined platinum in 2013.Cost inflation challenges are likely tocontinue in 2013, with mining inflationexpected to remain above the averageinflation rate in South Africa. In spite ofthe difficult inflationary environment,Platinum aims to contain cash unitcosts to between ZAR16,000 andZAR16,500 per equivalent refinedplatinum ounce. The unit cost targetexcludes the cost of implementing theportfolio review proposals.Platinum’s project portfolio has beenaligned with the proposals of theportfolio review, with the capitalexpenditure target reduced by 25%to ZAR100 billion over the nextdecade. Capital allocation will continueto focus on the highest return andlowest risk opportunities.Operating and financial review<strong>Anglo</strong> <strong>American</strong> plc <strong>Annual</strong> <strong>Report</strong> <strong>2012</strong> 81
OPERATING AND FINANCIAL REVIEW DIAMONDSDIAMONDSPhilippe MellierCEO – De BeersGroupUNDERLYING OPERATING PROFIT(2011: $659 m)$496 mSHARE OF GROUP UNDERLYINGOPERATING PROFIT8%UNDERLYING EBITDA(2011: $794 m)$711mKey financial and non-financial performance indicators$ million (unless otherwise stated)Year ended 31 Dec <strong>2012</strong> Year ended 31 Dec 2011De Beers(100%)<strong>Anglo</strong><strong>American</strong>share (1)<strong>Anglo</strong>De Beers <strong>American</strong>(100%) (2) share (1)Underlying operating profit 815 496 1,491 659Underlying EBITDA 1,075 711 1,763 794Net operating assets 12,944 12,944Capital expenditure 249 94Share of Group underlying operating profit n/a 8%Share of Group net operating assets n/a 25%Group’s associate investment in De Beers (3) n/a n/a n/a 2,23001Non-financial indicators <strong>2012</strong> 2011Number of fatal injuries 3 7Lost-time injury frequency rate 0.13 0.15(1)Amounts based on the Group’s 45% shareholding to 16 August <strong>2012</strong> and a 100% basis thereafter. Underlying earnings from 16 August <strong>2012</strong>excludes the 15% non-controlling interest.(2)Underlying operating profit and underlying EBITDA for 2011 on a 100% basis is provided for information.(3)Excludes outstanding loans owed by De Beers, including accrued interest of $301 million in 2011.01 The diamond recovery processplant at Venetia, South Africa’sbiggest diamond mine, whichproduced just over 3 millioncarats in <strong>2012</strong>.82 <strong>Anglo</strong> <strong>American</strong> plc <strong>Annual</strong> <strong>Report</strong> <strong>2012</strong>
BUSINESS OVERVIEWDe Beers is the world’s leadingdiamond company. Together withits joint venture partners, De Beersproduces approximately 35% of theworld’s rough diamonds by value, andemploys more than 23,000 peoplearound the world.In August <strong>2012</strong>, <strong>Anglo</strong> <strong>American</strong>completed its acquisition of the 40%shareholding in De Beers, for a totalcash consideration of $5.2 billion,thereby increasing <strong>Anglo</strong> <strong>American</strong>’sshareholding in De Beers to 85%.The remaining interest is held by theGovernment of the Republic ofBotswana (GRB).De Beers operates across key partsof the diamond value chain, includingexploration, production, the sellingof rough diamonds, the marketingof polished diamonds through itsproprietary diamond brand,Forevermark, and retail sales throughDe Beers Diamond Jewellers (DBDJ),a 50:50 joint venture with LVMHMoët Hennessy Louis Vuitton SA.De Beers’ mines are located in fourcountries: Botswana, Canada, Namibiaand South Africa. All operations areopen pit with the exception of SnapLake, an underground mine in Canada,and Namdeb Holdings’ alluvial andmarine mining operations in Namibia.Consumer demand forecasts$ Polished wholesale prices<strong>2012</strong>USA 37%China/Hong Kong 13%India 9%Japan 10%Gulf 8%Rest of World 22%Source: De BeersIn Botswana, De Beers’ interests areheld through the Debswana DiamondCompany, a 50:50 joint venture withthe GRB. Debswana’s operationsinclude Jwaneng, the world’s richestdiamond mine; Orapa, the world’slargest open-pit diamond mine;Letlhakane; and Damtshaa.In South Africa, De Beers has a 74%interest in De Beers ConsolidatedMines (DBCM), with the remaining26% held by Ponahalo Holdings, whichis a black economic empowermentconsortium. DBCM’s operationsinclude Venetia, which produces about70% of De Beers production fromSouth Africa; Voorspoed, a source oflarge and exotic coloured diamonds;and Kimberley Mines, a tailingsprocessing facility.In Namibia, De Beers’ interests areheld through Namdeb Holdings (NH),a 50:50 joint venture with theGovernment of the Republic ofNamibia (GRN). Diamonds are minedon land by Namdeb, and at sea byDebmarine Namibia, both of whichare wholly owned by NH. Marinemining is performed by a fleet offive mining vessels.In Canada, De Beers wholly owns itstwo mining operations; Victor, locatedin Northern Ontario; and Snap Lake, inthe Northwest Territories. De BeersConsumer demand forecasts$ Polished wholesale prices2017 FUSA 34%China/Hong Kong 17%India 14%Japan 7%Gulf 9%Rest of World 19%Source: De BeersDe Beers’mines arelocated in fourcountries:Botswana,Canada,Namibia andSouth Africa.INVESTINGFOREVERMARK– A UNIQUEPROMISEWhen it comes to purchasingluxury products, consumers wantassurance of the superior qualityand provenance of the product.De Beers Group provides thisthrough Forevermark, ourproprietary diamond brand,available in over 900 retailpartners in 12 markets includingthe core diamond jewellerymarkets of China, Japan, Indiaand the US.Every Forevermark diamondcomes with a promise of qualityand integrity, symbolised by theunique inscription inside thediamond. Each one is inscribedwith the Forevermark icon anda unique identification numberusing patented technologydeveloped by the De BeersGroup. Since the launch ofForevermark, more than 500,000diamonds have received theForevermark inscription asevidence that they have met thebrand’s high standards of quality,ethical integrity and provenance.The rigorous standards thatapply to Forevermark incorporatethe De Beers Best PracticePrinciples Assurance Programmethat provides consumers withassurance that the entire journeyof their diamond has met thehighest standards of ethical,social and environmentalperformance, and can be wornwith pride.ImageThe unique Forevermark inscription.Operating and financial reviewNote: These figures provide estimates and forecasts of the size and growth of main diamond consumer marketsbased on pipeline and consumer research commissioned by De Beers Group Strategy. <strong>2012</strong> results are preliminary.For more information turn to page 84<strong>Anglo</strong> <strong>American</strong> plc <strong>Annual</strong> <strong>Report</strong> <strong>2012</strong> 83
OPERATING AND FINANCIAL REVIEW DIAMONDSalso has a 51% shareholding in a jointventure in Gahcho Kué, a project in thevicinity of Snap Lake. The project is atan advanced permitting stage. Whenoperational, Gahcho Kué is expectedto produce approximately 4.5 millioncarats per annum over a life of mineof 11 years.De Beers sells rough diamondsthrough two distribution channels:over 90% is sold via long termcontract sales to clients (known asSightholders), with the remainderbeing sold via regular auctions.De Beers is also an equal joint venturepartner in DTC Botswana and inNamibia DTC with the GRB and GRN,respectively. The local companiesfacilitate local sales and beneficiation,and are intermediaries in the globalselling function.As part of its long term contractsales, De Beers sorts and valuesproduction into 14,000 price points.These diamonds are aggregated andsold to Sightholders at one of 10 Sightseach year.De Beers is a global leader in the useof innovative online systems to auctionrough, uncut diamonds to small,mid-tier and large manufacturing,retailing and trading businesses.De Beers participates at the polishedend of the value chain through itsproprietary diamond brand,Forevermark, and, at the retail end,through DBDJ.Diamonds inscribed as Forevermarkprovide consumers with confidencethat their diamonds are beautiful, rareand responsibly sourced. They areavailable in carefully selected,authorised jewellers in the majorconsumer markets around the world.DBDJ’s high-end retail stores arelocated in the most fashionable areasin the world, including New York,Beijing, Hong Kong, London, Paris,Tokyo and Dubai.Element Six is the global leader in thedesign, development and production ofsynthetic diamond supermaterials for arange of applications. It comprises twobusinesses: Technologies which iswholly owned; and Abrasives, in whichDe Beers has a 60% interest (UmicoreSA hold the remaining 40%).In <strong>2012</strong>,De Beerscontinued themigration ofits Londonbasedsalesoperations toGaborone,Botswana.INDUSTRY OVERVIEWAround 60% of the world’s diamonds,by value, originate from south andcentral Africa, with significantsources also found in Russia, Australiaand Canada.Most diamonds come from the miningof kimberlite deposits. Anotherimportant source of gem diamonds,however, has been secondary alluvialdeposits formed by the weatheringof primary kimberlites and thesubsequent deposition of releaseddiamonds in rivers and beach gravels.Rough or uncut diamonds arebroadly classified either as gem orindustrial quality, with gem beingoverwhelmingly (>99%) the larger ofthe two markets by value. The primaryworld market for gem diamonds isretail jewellery, where aspects suchas size, colour, shape and clarity havea large impact on valuation.STRATEGYDe Beers’ vision is to unlock the fulleconomic value of its leadershipposition in the diamond industry.De Beers is a demand-driven business,with a clear understanding thatconsumer desire is the overwhelmingsource of value for its diamonds.With growth in demand for diamondsexpected to outstrip productiongrowth in the medium to long term, thecompany aims to maximise the valueof every carat mined, sorted and sold.To achieve this objective, De Beersfocuses on optimising the value of itsmining assets, selling to selectedleading diamantaires and offeringconsumers the integrity andconfidence of its brands.Operating safely, sustainablyand responsiblyDe Beers goes beyond maintainingthe company’s social licence tooperate, to ensure consumers canbe confident in the ethical integrityof De Beers’ diamonds. De Beers’activities in support of sustainabledevelopment are a core part of thecompany’s business model and spanthe diamond pipeline.Upstream, this strategy includesensuring employee safety, healthand well-being; and effectiveenvironmental stewardship. De Beersalso works in partnership with hostgovernments and other stakeholdersto assist in the provision of long termand sustainable economicdevelopment, including support forlocal and indigenous procurement,enterprise development, socialinvestment, and beneficiation.Through beneficiation, De Beerssupports the development ofvalue-adding downstream activitiesin producer countries. In <strong>2012</strong>,De Beers continued the migration ofits London-based sales operations toGaborone, Botswana. Agreed in 2011,as part of a 10-year sales agreementbetween De Beers and the GRB for thesorting, valuing and sale of Debswana’sdiamond production, the relocation ofDe Beers’ international aggregationand sales activity will be completed bythe end of 2013. The move will bolsterDe Beers’ long term beneficiationactivities in the region, through helpingestablish southern Africa as a worldleading downstream diamond centre.De Beers also supports initiatives todrive best practice throughout thediamond pipeline. These include theKimberley Process CertificationScheme, an inter-governmentalinitiative that seeks to eliminateconflict diamonds from the globalsupply chain, as well as a bespokeethical, environmental and socialassurance programme that coversmore than 300,000 diamond sectorworkers across the world.FINANCIAL ANDOPERATIONAL OVERVIEWDe Beers’ underlying operating profit(on a 100% basis) fell by $676 millionto $815 million, 45% lower, reflectingthe impact of difficult tradingconditions brought aboutpredominantly by weaker demandand changing product requirementsfrom Sightholders. <strong>Anglo</strong> <strong>American</strong>’sshare of underlying operating profitfrom De Beers totalled $496 million, adecrease of 25%, the overall reductionbeing partly offset by <strong>Anglo</strong> <strong>American</strong>’shigher shareholding.84 <strong>Anglo</strong> <strong>American</strong> plc <strong>Annual</strong> <strong>Report</strong> <strong>2012</strong>
Safety and environmentIn <strong>2012</strong>, De Beers recorded threefatalities (2011: 7) and a lost-timeinjury frequency rate (LTIFR) of 0.13(2011: 0.15). Safety remains the firstpriority for De Beers and the companycontinues to drive improvement insafety performance through theongoing roll-out of a standardisedsafety management system that aimsto embed a safety culture across thebusiness. Following a slope failure andtragic loss of life at Jwaneng in June,pit operations were suspended fora period of seven weeks to allow fora comprehensive geotechnicalreview, ensuring that it was safe torecommence mining.MarketsDemand for diamond jewellery in thekey markets of the US, China andJapan grew, albeit at a slower pacethan in 2011. This, together with higherpolished stock levels, resulted in adecline in polished prices particularlyin the third quarter of the year.Although rough diamond pricesremained broadly stable in the firsthalf of <strong>2012</strong>, a combination of weakerpolished prices, high levels of cuttingcentre stock and tightening liquidityin the mid-stream, resulted in a pricecorrection during the third quarter.By the end of <strong>2012</strong>, rough diamondprices stabilised, reflecting a modestimprovement in consumer demandduring the holiday sales season in mostmajor diamond jewellery markets.Operating performanceMining and manufacturingDe Beers’ full-year productiondeclined by 11% to 27.9 millioncarats (2011: 31.3 million carats). Inlight of prevailing diamond markettrends, as well as operationalchallenges, the company’s statedstrategy of producing to demand hasbeen maintained. Operations continueto focus on maintenance and wastestripping backlogs, while a number offactors impacted production at specificsites. At Debswana, this included theJwaneng mine slope failure in June.DBCM saw lower grades from Venetiaand production was also impacted bythe disposal of Finsch in September2011. Canada’s Snap Lake showedsignificant improvement during <strong>2012</strong>as work continues on optimising themine to enable economic access tothe promising, though challenging,orebody.Debmarine Namibia’s Grand Banksmining vessel was re-commissionedin <strong>2012</strong> and Namdeb’s Elizabeth Baymining area in Northern Bay wasbrought back into operation duringthe year.Element Six experienced a challengingyear, with weakness in a number of keyend-markets, particularly in the secondhalf of the year. In response, ElementSix focused on cost containment andimproved operational performanceand made significant progress on anumber of its strategic milestones,including improved customer serviceand innovation.SalesDe Beers’ total sales decreased to$6.1 billion (100% basis), primarilyas a result of diminished demand forrough diamonds, changing productrequirements from Sightholders andreduced availability of some goods.BrandsForevermark continued to growstrongly in <strong>2012</strong>, particularly in the coremarkets of China, Japan, India and theUS, and was launched in South Africa,Canada and the UAE. It is now availablein more than 900 retail partners in12 markets. Since the launch ofForevermark, more than 500,000diamonds have been inscribed with aunique identification number showingthat they have met the brand’s highstandards of quality, ethical integrityand provenance.DBDJ faced the challenging marketconditions experienced by mosthigh-end jewellers in <strong>2012</strong>, butcontinued to focus on expanding itsstore network in China, a market ofsignificant opportunity for high-endjewellery brands. New stores wereopened in Shanghai and Nanjing,giving DBDJ five stores in China, withan additional store scheduled to openin 2013. Franchise partners will openfurther stores in Kuala Lumpur, Bakuand Vancouver in 2013. DBDJ currentlyhas 43 stores in leading diamondconsumer markets around the world.OtherThe agreement entered into byDe Beers in the US in 2006 to settleall outstanding class actions against itbecame unconditional and effective inMay. The $295 million settlement, plusinterest, held in escrow since 2006 isnow being distributed in accordancewith the court ordered plan.De BeersDiamondJewellerscurrentlyhas 43 storesin leadingdiamondconsumermarketsaroundthe world.ProjectsIn Botswana, construction of theinfrastructure at Jwaneng’s Cut-8project is largely complete. Cut-8will provide access to approximately95 million carats of mainly high qualitydiamonds and extend the life of theworld’s richest diamond mine to atleast 2028.In South Africa, the Venetiaunderground project was approvedby the De Beers and <strong>Anglo</strong> <strong>American</strong>Boards. Environmental authorisationwas granted in July and theEnvironmental Management Planwas approved by the Department ofMineral Resources in October. Thefinal outstanding regulatory clearanceswere obtained in February 2013 andthe project will commence shortly.De Beers will invest approximately$2 billion to build the new undergroundmine, which will extend the life of theresource until 2042 and replace theopen pit as South Africa’s largestdiamond mine.In Canada, the Environmental ImpactReview documentation for theGahcho Kué project has beensubmitted for review and the ReviewPanel is expected to issue a decisionreport in 2013.OutlookDe Beers expects moderate growthin diamond jewellery demand in 2013.This will be supported primarily by amore positive picture emerging fromChina and India compared to <strong>2012</strong>.Some upside is possible in the US,while trading conditions in othermarkets are likely to be challenging.The rough diamond manufacturingsector closed <strong>2012</strong> with high levelsof inventory, particularly in thehigher-end categories of diamonds,and faces continued pressure in termsof liquidity. In the medium to longterm, industry fundamentals areexpected to strengthen as diamondproduction plateaus and demandcontinues to increase.<strong>Anglo</strong> <strong>American</strong> plc <strong>Annual</strong> <strong>Report</strong> <strong>2012</strong> 85Operating and financial review
OPERATING AND FINANCIAL REVIEW OTHER MINING AND INDUSTRIALOTHER MININGAND INDUSTRIALRubenFernandesCEO – Phosphatesand NiobiumDuncanWanbladGroup DirectorOther Miningand Industrial –Tarmac, Amapáand Scaw MetalsUNDERLYING OPERATING PROFIT(2011: $315 m)$337 mSHARE OF GROUP UNDERLYINGOPERATING PROFIT(2011: 3%)5%UNDERLYING EBITDA(2011: $540 m)$485 mKey financial and non-financial performance indicators$ million (unless otherwise stated) (1) <strong>2012</strong> 2011Underlying operating profit 337 315Phosphates 91 134Niobium 81 52Amapá 54 120Tarmac 73 (38)Scaw Metals 49 37Zinc – 20Corporate (11) (10)Underlying EBITDA 485 540Net operating assets 786 3,843Capital expenditure 260 225Share of Group underlying operating profit 5% 3%Share of Group net operating assets 2% 9%0101 A granulator at Phosphates’Cubatão plant, where fertiliseris made into granulated form.Non-financial indicators (2) <strong>2012</strong> 2011Number of fatal injuriesPhosphates and Niobium – –Amapá, Tarmac and Scaw Metals 1 1Lost-time injury frequency ratePhosphates and Niobium 0.39 0.15Amapá, Tarmac and Scaw Metals 0.25 0.21Total energy consumed in 1,000 GJ (3) 2,710 2,222Total greenhouse gas emissions in 1,000 tonnes CO 2e (3) 93 65Total water used for primary activities in 1,000 m 3 (3) 8,313 8,569(1)In <strong>2012</strong>, Amapá was reclassified from Iron Ore and Manganese to Non-core within the Other Mining and Industrial segment to align with internalmanagement reporting. Financial comparatives have been reclassified to align with current presentation.(2)In a given year, non-financial data is reported within the business unit that had management control of the operation, therefore non-financial datafor Amapá is reported within OMI and Iron Ore Brazil for <strong>2012</strong> and 2011 respectively.(3)Non-financial performance data given for Phosphates and Niobium only.86 <strong>Anglo</strong> <strong>American</strong> plc <strong>Annual</strong> <strong>Report</strong> <strong>2012</strong>
BUSINESS OVERVIEWPhosphatesOur Phosphates business is thesecond largest integrated phosphatefertiliser producer in Brazil. Itsoperations are vertically integrated,covering mining of phosphate ore,beneficiation of the ore to producephosphorus pentoxide (P 2O 5)concentrate, and processing intointermediate and final products.Our phosphates mine at Ouvidor, inGoiás state, currently produces, onaverage, around 5.9 Mt of ore perannum (dry basis). It is a primephosphate deposit, containing someof Brazil’s highest grades of ore(approximately 13% P 2O 5). Thecompany has approximately 15% ofcurrent Brazilian phosphate mineralresources and has a remaining mine lifeof 40 years at current production rates.Run-of-mine phosphate ore is treatedat a beneficiation facility on the samesite, and approximately 1.36 milliontonnes per annum (Mtpa) of finalphosphate concentrate is producedat an average grade of around 35%P 2O 5. Phosphates operates twochemical processing complexes:one in Catalão in Goiás, the other atCubatão in the state of São Paulo. Thecompany produces a wide variety ofproducts for the Brazilian agriculturesector, including low analysis(approximately 20% P 2O 5content) andhigh analysis (40%-55% P 2O 5content)phosphate fertilisers, dicalciumphosphate (DCP) for the animal feedindustry, as well as phosphoric andsulphuric acids for the food and animalfeed industries.NiobiumOur Niobium business is located in thecities of Catalão and Ouvidor, in Goiásstate, Brazil, and is one of the world’sthree principal niobium producers.In operation since 1973, our Boa Vistamine produces and exportsapproximately 4,000 tonnes ofniobium per year. Now, approachingthe end of the weathered ore, theNiobium business is investing inadapting the existing plant to processfresh rock.Our phosphatesmine, containingsome of Brazil’shighest gradesof ore hasapproximately15% of currentBrazilianphosphatemineralresources.INDUSTRY OVERVIEWPhosphatesPhosphate fertiliser demand isdriven by strong fundamental trends,including expanding food needs froma growing global population, changingdietary habits in major emergingeconomies such as China and India,and increased demand for biofuels.Brazil, a major agricultural nation, isthe fourth largest phosphate marketglobally and needs to import almost50% of its required phosphatefertilisers. Our phosphates mine,situated in Brazil’s under-suppliedCentral-West region, gives us acompetitive cash-cost advantage.NiobiumAs an alloying agent, niobium bringsunique properties to high strengthsteel alloys (HSSA), such as increasedformability, corrosion resistance,weldability and strength under toughworking environments, includingextreme high or low temperatures.Around 90% of total global niobiumconsumption is used as an alloyingelement, in the form of ferroniobium(FeNb) in high strength steels, whichare used in the manufacture ofautomobiles, ships and high pressurepipelines, as well as in the petroleumand construction industries. Theproduct is exported to major steelplants in Europe, the US and Asia.STRATEGYPhosphates and Niobium’s corestrategy is to expand the existingoperations and mineral reserves inboth commodities through a rigorousfocus on operational excellence, andthe execution of selected low cost andhigh returning projects.At Phosphates, significant brownfieldexpansion opportunities are currentlybeing evaluated in order to meet theexpected growing demand needs ofthe Brazilian agricultural market, whichis strategically placed to address theglobal shifts in dietary habits andwhere the outlook for the productionof fertiliser products is very positive.At Niobium, our investment in the BoaVista Fresh Rock project is expected toconsolidate the business as the secondlargest producer of niobium worldwide,feeding mainly into, and increasing ourmarket share in, the HSSA market.ORGANISINGVALUE FROMWASTE ATPHOSPHATESPhosphates is applying the‘reduce, re-use, recycle’philosophy on an industrial scale.A leading Brazilian producer ofphosphate fertilisers, each yearPhosphates generates 7,800tonnes of phosphate waste,with 20% being re-used at thegranulation stage of production.The rest was traditionally soldas a low-value by-product ordisposed of in waste lagoons.Following laboratory and, later,industrial-scale tests, aPhosphates technical teamdemonstrated that phosphatewaste could also be re-usedin the intermediate acidulationstage. The technique was putinto full-scale production inMarch <strong>2012</strong>.Phosphate waste recoveredand re-used has now increasedto 40% – with a target of 60%.This has led to lower productioncosts, with no loss of quality,and the environmental benefitof significantly reducedwaste disposal.ImageLaboratory analyst Thiago Araujo.Operating and financial review<strong>Anglo</strong> <strong>American</strong> plc <strong>Annual</strong> <strong>Report</strong> <strong>2012</strong> 87
OPERATING AND FINANCIAL REVIEW OTHER MINING AND INDUSTRIAL01 Phosphates stockpilein Cubatão.02 Processing plant andwater-treatment areaat Cubatão.FINANCIAL ANDOPERATIONAL OVERVIEWSafety and environmentIn <strong>2012</strong>, no fatalities were recorded inPhosphates and Niobium, however theLTIFR increased to 0.39 (2011: 0.15).All 14 injuries were of low potentialseverity and most involved injury tohands and feet. The lessons learnedfrom the incident investigations arebeing used to improve riskassessment, promote safe behaviourand prevent unsafe operatingconditions.Water consumption was marginallyreduced as more water was re-used,particularly at the phosphate operations.While energy consumption decreasedyear on year, CO 2 emissions increaseddue to an alignment of conversionfactors with Group standards.MarketsPhosphatesFertiliser demand in Brazil rose around4% in <strong>2012</strong>, reflecting the strongfundamentals of the Brazilianagricultural sector. Brazilian fertiliserconsumption has been growing fasterthan the global average and thisperformance is expected to continue infuture years, supported by favourableweather conditions, plentiful accessto water and the widespread use ofadvanced farming techniques byBrazilian farmers. Continued highprices of soybean and corn have alsoincentivised farmers to increase grainproduction through more intensivefertiliser application.This favourable market scenarioresulted in Phosphates reporting arecord fertiliser sales performanceof 1.2 Mt for the year.NiobiumGlobal steel mill activity was subduedin <strong>2012</strong>, with producers reluctant toresume idle operations, replenishstocks, and to commit to furtherinvestment in their businesses. Despitethe challenging environment, however,increased production of HSSA in bothemerging and developed countries,ensured that niobium demandremained strong for the year.Operating performancePhosphatesDespite record fertiliser sales,underlying operating profit decreasedby 32% to $91 million, driven mainly byunfavourable international fertiliserBrazilianfertiliserconsumptionhas beengrowing fasterthan theglobal averageand thisperformanceis expected tocontinue infuture years.prices, coupled with increased labourcosts and general inflationarypressures. DCP sales were alsoadversely affected by difficulties in thecattle industry, which had a negativeimpact on the operating results.Phosphates production increased by5% to a record of 1.1 Mt, due to anumber of asset optimisation initiativeswhich improved overall performanceat Catalão and Cubatão.NiobiumNiobium generated an underlyingoperating profit of $81 million, a 56%increase over 2011. Sales volumes ofniobium rose by 15%, mainly due toan increase in production arising froma better performance at the tailingsplant and improvements in theconcentration process at the Boa Vistamine. Unit production costs declinedowing to lower aluminium and powerprices and more efficient use ofconsumables, combined with theimpact of higher production.ProjectsNiobiumThe Boa Vista Fresh Rock projectcontinued to make progress, withadditional capital expenditureapproved in June <strong>2012</strong>. The existingplant will be adapted to process newrock instead of oxide ore, leading toan increase in production capacityto approximately 6,500 tonnes ofniobium per year (<strong>2012</strong>: 4,400 tonnes).OutlookPhosphatesStrong grain prices continue tosupport fertiliser demand, and fertiliserprices are expected to remain highduring 2013. The market expectsfarmers to expand the area given overto agriculture, as the current ratiobetween fertiliser and grain pricesremains positive.In addition, the high level of cornprices will be a motivating factor foran aggressive ‘mini crop’ (a smallersecondary crop, mainly corn, grownin the first half of the year) in the firstquarter of 2013.NiobiumDemand is expected to remainsubdued in Europe and in PacificRim/East Asian countries, such asJapan, South Korea and, to a lesserdegree, China.Production is expected to declinein 2013, owing to lower grades andrecoveries as lower quality ore isextracted from Boa Vista mine as itapproaches the end of the weatheredore and encounters lower gradesand higher contaminants. Tailingsproduction is also expected todecrease as a result of lowerniobium grades contained in thephosphate tailings.010288 <strong>Anglo</strong> <strong>American</strong> plc <strong>Annual</strong> <strong>Report</strong> <strong>2012</strong>
AMAPÁAmapá generated an underlyingoperating profit of $54 million,a decrease of $66 million on theprior year.Production increased significantly,in line with planned ramp up andalso due to higher mass recovery inthe beneficiation plant as a result ofthe plant’s improved stability. Theoperation is now at design productioncapacity. Higher sales were alsoachieved following fewer delaysassociated with transportable moisturelimits. Transhipment at Trinidad andTobago from smaller capacityHandymax to the larger capacityCapesize vessels for onward shipmentto the Middle and Far East wassuccessfully implemented in thesecond half of <strong>2012</strong>.The favourable impact of improvedproduction and higher sales, however,was more than offset by a sharpdecrease in prices during <strong>2012</strong>, thoughtight cost control and improvedoperating efficiencies, partlycompensated their effect. Underlyingoperating profit also benefited fromthe reversal of penalty provisions,which were in place at the end of 2011,as a result of contract renegotiations.Regrettably, one fatality occurredat Amapá iron ore system in Brazilduring <strong>2012</strong>. The LTIFR hasimproved over the past six years,and encouragingly, the severity ofinjuries also continues to decline.On 4 January 2013, <strong>Anglo</strong> <strong>American</strong>announced an agreement to sell its70% interest in Amapá to ZaminFerrous Ltd. The transaction is subjectto regulatory approval and is expectedto complete in 2013. We have alwaysmaintained that we did not envisageholding our interest in Amapá over thelong term and, in July <strong>2012</strong>, reportedthat we had transferred responsibilityfor Amapá to our Other Mining andIndustrial business unit and stated thatwe were exploring the possibility ofdivesting our interest.<strong>Anglo</strong> <strong>American</strong> has transformed theoperational performance of Amapásince acquisition in 2008, increasingannual production from 1.2 Mt in 2008to 6.1 Mt in <strong>2012</strong>.TARMACTarmac reported an underlyingoperating profit of $73 million,compared with a loss of $38 millionin 2011. Tarmac’s underlying EBITDAwas $148 million, 44% higher thanin 2011.Quarry materialsThe business’ profitability was athigher levels than last year, mainly asa result of the operation being treatedas ‘held for sale’ from the end of July<strong>2012</strong>, and the subsequent cessationof recorded depreciation. There hasbeen a decline in asphalt volumes, withfew major road schemes commencingin <strong>2012</strong> as a result of the UKgovernment’s austerity measures.Private-sector growth remainedmuted throughout the year, thuskeeping pressure on ready-mixconcrete prices and volumes, but wasoffset in part by the resilient centralLondon market. A continued focuson maximising the use of substitutefuel and recycled asphalt materialsis helping to mitigate the impact ofrising hydrocarbon costs and tosupport margins.On 7 January 2013, <strong>Anglo</strong> <strong>American</strong>and Lafarge announced thecompletion of their 50:50 joint venturewhich will combine their cement,aggregates, ready-mix concrete,asphalt and asphalt surfacing,maintenance services, and wasteservices businesses in the UK. Thejoint venture will be known as LafargeTarmac. Completion of the LafargeTarmac joint venture followed finalclearance from the UK CompetitionCommission, predicated on thecompleted sale of a portfolio of Tarmacand Lafarge construction materialsoperations in the UK, which alsooccurred on 7 January 2013.Building productsPerformance was affected bythe continued general economicdownturn, compounded by disruptionto building activity followingunseasonal wet weather duringthe summer months.The weak building products marketresulted in a highly competitivepricing environment affecting salesvolumes, although cost reductionprojects and improvements inoperating efficiencies are helpingto mitigate some of the impact.In early 2013,<strong>Anglo</strong> <strong>American</strong>and Lafargeannouncedthe completionof their 50:50joint venture.A number of initiatives continue to bedeveloped to ensure improved longerterm performance, but the short termremains difficult owing to the prevailingweak market conditions.SCAW METALSScaw Metals experienced a 32%increase in underlying operating profitto $49 million for the 11 months toend November <strong>2012</strong> compared withthe full year 2011, mainly as a resultof the company being treated as‘held for sale’ from 24 April <strong>2012</strong>,and the subsequent cessation ofrecorded depreciation.Cast Products showed a markedimprovement, owing to firm demandacross all segments and a reductionin costs following the closure of aloss making foundry in the prior year.Grinding Media reported a decreasein underlying operating profit as aresult of lower demand from themining sector owing to industrialaction in the second half of <strong>2012</strong>.This business is expected to recoveras mining operations revert to fullproduction. The performance ofWire Rod Products suffered as aconsequence of a decline in miningactivity, but nevertheless reportedstable earnings. Demand forconstruction products remainedweak, but in spite of this the RolledProducts business, through costcontainment measures andoperational improvements, wasable to minimise its losses.Total production of steel productswas 611,600 tonnes for the 11 monthsto end November <strong>2012</strong>, a decreaseof 9.7% over the full year 2011.On 24 April <strong>2012</strong>, <strong>Anglo</strong> <strong>American</strong>announced the sale of its interestin Scaw South Africa to an investmentconsortium led by the IndustrialDevelopment Corporation ofSouth Africa and the Group’spartners in Scaw South Africa,being Izingwe Holdings (Pty)Limited, Shanduka Resources (Pty)Limited and the Southern PalaceGroup of Companies (Pty) Limited.On 23 November, the sale ofScaw South Africa and relatedcompanies completed for a totalconsideration of ZAR3.4 billion($440 million) on a cash- anddebt-free basis as announced.Operating and financial review<strong>Anglo</strong> <strong>American</strong> plc <strong>Annual</strong> <strong>Report</strong> <strong>2012</strong> 89
GOVERNANCE INTRODUCTIONGOVERNANCESir John Parker“Corporate governance is a dynamicprocess that requires continuousreview and improvement.”IN THIS SECTION90Chairman’sintroduction92The Board94Executivemanagement96The role ofthe Board98Board in action100Boardcommittees104AuditCommitteereport108Remunerationreport128Directors’report134Statementof directors’responsibilitiesCHAIRMAN’SINTRODUCTIONIn <strong>2012</strong> we saw both the 20thanniversary of the introduction ofthe UK Corporate Governance Code(the Code) and, in September, its latestincarnation as the Financial <strong>Report</strong>ingCouncil (FRC) published revisionsaimed at enhancing corporatereporting and audit. These eventsserve to underline the fact thatcorporate governance is a dynamicprocess that requires continuousreview and improvement. For methey also highlight the wisdomof Sir Adrian Cadbury and hiscommittee in devising a principlesbasedapproach that has enabled andencouraged the periodic updating ofthe Code to ensure it remains relevant.At <strong>Anglo</strong> <strong>American</strong>, I am pleased toconfirm once again that we compliedwith the Code for the period. Thefollowing section sets out how wehave complied and, on our website,we provide a handy checklist thatrelates our corporate governancearrangements to each of the relevantprinciples in the Code. Nonetheless,we recognise that corporategovernance arrangements are never‘complete’, and must continually adaptand evolve. The following sectionexplains how we endeavour to achievethat and I hope this is of interest toshareholders. In this introduction I willbriefly draw attention to just two areasthat I hope illustrate our commitmentto continuous improvement.BOARD EVALUATIONOne of the ways in which we seek toadapt and improve our governancearrangements is via the annual Boardevaluation. In <strong>2012</strong>, the evaluationwas conducted by an externalfacilitator and led to recommendationsfor, inter alia, enhancing the qualityof our strategic discussions andre-programming our scheduledBoard agenda somewhat to includediscussions of a range of areashighlighted by directors.I regard an external board evaluationas a very useful process although,in well-established companies,one should not expect the annualevaluation to result in revolutionarychanges nor be surprised if theresults often focus on the same areas.What it does provide is an independent,external perspective on theeffectiveness of our Board and avaluable opportunity for directors totake the time to reflect specificallyon how we are doing and where wemight improve.The followingsection setsout how wehave compliedand, on ourwebsite, weprovide a handychecklist thatrelates ourcorporategovernancearrangementsto each ofthe relevantprinciples inthe Code.For more information visitwww.angloamerican.com90 <strong>Anglo</strong> <strong>American</strong> plc <strong>Annual</strong> <strong>Report</strong> <strong>2012</strong>
Board and Committee meetings – frequency and attendanceIndependentBoard(sixmeetings)Audit(threemeetings)S&SD(fourmeetings)Remuneration(fourmeetings)Nomination(fivemeetings)Sir John Parker N/a All – Three – AllCynthia Carroll No All – All – –René Médori No All – – – –David Challen Yes All All – All AllSir CK Chow Yes All – – All AllSir Philip Hampton Yes Five All – All –Phuthuma Nhleko Yes All All – – –Ray O’Rourke Yes All All All – –Mamphela Ramphele (1) Yes 1/4 – 1/3 – 1/3Anne Stevens (2) Yes All All – – –Jack Thompson Yes All – All All –Peter Woicke Yes All – All All All(1)Meetings attended prior to retirement.(2)Meetings attended since appointment.GovernanceDIVERSITYWe continue to develop the mix ofskills and experience on the Board.During the year, it included threefemale directors (achieving a 27%representation of women on theBoard – excluding the chairman)and comprised individuals withengineering, banking, mining,telecoms, construction and automotivesector backgrounds, hailing fromthe US, UK, South Africa, France,Germany, Ireland and Hong Kong.As the justifiable clamour for diversityon company boards intensifies, thereis a risk that this comes to be seenas a mere compliance issue. It is not.Making sure we utilise all of the talentavailable to us, and fostering a mix ofskills and backgrounds to providechallenge and different perspectivesaround the board table, is all aboutmaking better decisions in the interestsof the Company.As thejustifiableclamour fordiversityon companyboardsintensifies,there is arisk that thiscomes to beseen as a merecomplianceissue. It is not.The following sections of this reportcontain much information detailingour compliance with the Code. WhatI hope is also clear is our commitmentto the spirit of the Code and our beliefthat good corporate governance isgood business – that it is about makingthe best decisions we can, for the rightreasons, in the long term interests ofthe Company.Sir John ParkerChairman<strong>Anglo</strong> <strong>American</strong> plc <strong>Annual</strong> <strong>Report</strong> <strong>2012</strong> 91
GOVERNANCE THE BOARDTHE BOARDCHAIRMANSir John ParkerGBE, FREng, DSc (Eng), ScD (Hon),DSc (Hon), DUniv (Hon), FRINA70, joined the Board as a nonexecutivedirector on 9 July 2009 andbecame chairman on 1 August 2009.Sir John is also chairman of theNomination Committee and is amember of the Safety and SustainableDevelopment (S&SD) Committee.He is a non-executive director ofCarnival Corporation and EADS aswell as deputy chairman of DP World.Sir John is also President of the RoyalAcademy of Engineering and a VisitingFellow of the University of Oxford.Sir John was previously chairman ofNational Grid plc, senior non-executivedirector and chair of the Court of theBank of England, joint chair of Mondiand chair of BVT and P&O plc.CHIEF EXECUTIVECynthia CarrollMSc, MBA, DSc (Hon)56, was appointed CEO on 1 March2007, having joined the Board on15 January 2007. Cynthia chairs theGroup Management Committee(GMC) and the Executive Committee(ExCo) and sits on the S&SDCommittee. She is a non-executivedirector of BP plc and chairs <strong>Anglo</strong><strong>American</strong> Platinum and De Beers.Cynthia is the former president andCEO of Alcan’s Primary Metals Groupand a former director of <strong>Anglo</strong>GoldAshanti Ltd and Sara Lee Corporation.In October <strong>2012</strong> Cynthia announcedher decision to step down as CEO witheffect from 3 April 2013. She will alsostep down from the Board at the AGMon 19 April 2013.92 <strong>Anglo</strong> <strong>American</strong> plc <strong>Annual</strong> <strong>Report</strong> <strong>2012</strong>FINANCE DIRECTORRené MédoriDoctorate in Economics55, was appointed to the Boardon 1 June 2005, becoming financedirector on 1 September 2005.René is a member of GMC and ExCoand chairman of the InvestmentCommittee. He is a non-executivedirector of <strong>Anglo</strong> <strong>American</strong> Platinum.René recently joined the board ofPetrofac Limited as a non-executivedirector. He is a former financedirector of The BOC Group plc andwas a non-executive director ofSSE plc (formerly Scottish andSouthern Energy plc) until June <strong>2012</strong>.SENIOR INDEPENDENTDIRECTORDavid ChallenMA, MBA69, joined the Board on 9 September2002 and was appointed as the seniorindependent non-executive directorin April 2008. He is chairman of theAudit Committee and a member ofthe Nomination and RemunerationCommittees. David is currentlychairman of the EMEA governancecommittee at Citigroup and seniornon-executive director of SmithsGroup plc. He is currently a deputychairman of the UK’s Takeover Panel.Previously he was chairman of J. HenrySchroder & Co. Limited, where hespent most of his professional career.NON-EXECUTIVE DIRECTORSSir CK ChowDEng (Hon), CEng, FREng, HonFHKIE,FIChemE62, was appointed to the Board on15 April 2008 and is a member ofthe Nomination and RemunerationCommittees. He is currently chairmanof Hong Kong Exchanges and ClearingLimited and a non-executive directorof AIA Group Limited.Sir CK was appointed as a memberof the Executive Council of theHong Kong Special AdministrativeRegion in July <strong>2012</strong>. He is chairmanof the Hong Kong General Chamberof Commerce, and was recentlyappointed chairman of the AdvisoryCommittee on Corruption by theHong Kong SAR Government.Between 2003 and 2011 he was CEOof the MTR Corporation in Hong Kong.Former positions include those of CEOof Brambles Industries, GKN PLC andnon-executive chairman of StandardChartered Bank (Hong Kong) Limited.Prior to joining GKN PLC he workedfor The BOC Group plc for 20 years,joining its board in 1993.Sir Philip HamptonMA, ACA, MBA59, joined the Board on 9 November2009. He is chairman of theRemuneration Committee and amember of the Audit Committee.Sir Philip is chairman of The RoyalBank of Scotland and brings to<strong>Anglo</strong> <strong>American</strong> significant financial,strategic and boardroom experienceacross a number of industries.His previous appointments includechairman of J Sainsbury plc; financedirector of Lloyds TSB Group plc, BTGroup plc, BG Group plc, British Gasplc and British Steel plc, executivedirector of Lazards, and non-executivedirector of RMC Group plc andBelgacom SA.Phuthuma NhlekoBSc (Eng), MBA52, joined the Board on 9 March2011 and is a member of the AuditCommittee. Phuthuma is also anon-executive director of BP plcand chairman of Pembani Group(Pty) Limited.He previously served as a director ona number of boards in South Africa,including Nedbank Group, AlexanderForbes, Bidvest and Old Mutual (SA).Ray O’RourkeKBE, HonFREng, CEng, FICE, FIEI66, joined the Board on 11 December2009. He is a member of the Auditand S&SD Committees.Ray founded the O’Rourke Groupin 1977, having begun his career atKier and J Murphy & Sons. In 2001,the O’Rourke Group acquired JohnLaing to form Laing O’Rourke, nowEurope’s largest privately ownedconstruction company, of whichRay is chairman and CEO.Ray has a proven track record indelivering complex and large-scaleprojects around the world, mobilisinglarge numbers of people with greatsuccess and applying leading projectmanagement practices. As a memberof the S&SD Committee, he has akeen interest in safety.
Sir John ParkerCynthia CarrollRené MédoriDavid ChallenSir CK ChowSir Philip HamptonPhuthuma NhlekoRay O’RourkeAnne Stevens Jack Thompson Peter WoickeMark CutifaniIncoming CEOByron GroteNominated independentnon-executive directorAnne StevensPhD, BSc64, joined the Board on 15 May<strong>2012</strong> and is a member of the AuditCommittee. She has served on theboard of Lockheed Martin Corporationas a non-executive director since2002 and is also the chairman andCEO of a privately held IT servicesbusiness, SA IT.Anne’s 16-year career with FordMotor Company culminated in herappointment as chief operating officer(COO) for the Americas, a positionshe held until 2006.Prior to joining Ford in 1990, Annespent ten years in a number ofengineering, product developmentand sales and marketing roles atExxon Chemical Co and threeyears as chairman and CEO ofCarpenter Technology.Anne brings a wealth of experiencefrom a number of global industries.Her engineering training and widerangingcommercial acumen andexperience gained across North,Central and South America hasstrengthened the experience ofthe Board.Jack ThompsonBSc, PhD63, joined the Board on 16 November2009 and is a member of theRemuneration and S&SD Committees.He will become chairman of the S&SDCommittee upon the retirement ofPeter Woicke in April 2013. He iscurrently a non-executive directorof Molycorp Minerals LLC andTidewater Inc.Jack was previously chairman andCEO of Homestake Mining Co., vicechairman of Barrick Gold Corp. andhas served on the boards of CenterraGold Inc., Century Aluminum Co.,Phelps Dodge Corp., Rinker GroupLtd. and Stillwater Mining.Jack brings experience gained atall levels of the mining industry andhas received wide recognition as amining executive.Peter WoickeMBA70, joined the Board on 1 January2006, is chairman of the S&SDCommittee and is a member ofthe Nomination and RemunerationCommittees.He is currently a member of the boardof trustees of the Ashesi UniversityFoundation and a member of theboards of Saudi Aramco, the Institutefor Human Rights and Business andthe Chesapeake Bay Foundation.From 1999 to 2005, Peter wasexecutive vice president of theInternational Finance Corporation(IFC). Prior to joining the IFC, Peterheld numerous positions for nearly30 years with J.P. Morgan and hewas also a managing director of theWorld Bank.Peter has indicated that he wishesto retire from the Board this yearand accordingly will not be standingfor re-election at the AGM in April.INCOMING CEOMark CutifaniBE (Mining Engineering)54, has been appointed as a directorand CEO with effect from 3 April 2013.Mark is currently CEO of <strong>Anglo</strong>GoldAshanti Limited, a position he has heldsince 2007. Before joining <strong>Anglo</strong>GoldAshanti, Mark was COO at Vale Incowhere he was responsible for Vale’sglobal nickel business. Prior to this heheld senior executive positions withthe Normandy Group, Sons of Gwalia,Western Mining Corporation,Kalgoorlie Consolidated Gold Minesand CRA (Rio Tinto).Mark has over 35 years’experience of the mining industryacross a wide range of geographiesand commodities.NOMINATED INDEPENDENTNON-EXECUTIVE DIRECTORByron GrotePhD Quantitative Analysis64, is a non-executive director ofUnilever NV and Unilever plc anda member of the Cornell UniversityJohnson Graduate School ofManagement Advisory Council.He joined The Standard Oil Companyof Ohio in 1979 and in 1985 becamedirector of planning for its miningsubsidiary, Kennecott.In 1988 Byron was appointed ascommercial vice president for BP’sAlaskan North Slope productionactivities. In 1989 he becamecommercial general manager of BPexploration, based in London, andthen group treasurer and CEO of BPfinance in 1992. In 1994 he took up theposition of regional chief executive inLatin America. In 1995 Byron becamedeputy CEO of BP Exploration.Following the merger of BP andAmoco in 1999, Byron was appointedexecutive vice president, explorationand production. He was appointed tothe BP board in 2000 and he servedfor two years as CEO of BP Chemicalsand then as BP’s chief financial officer(CFO) from 2002 until 31 December2011. He will retire from the board ofBP in April 2013.Byron has been nominated forelection as a director at the AGM on19 April 2013.Governance<strong>Anglo</strong> <strong>American</strong> plc <strong>Annual</strong> <strong>Report</strong> <strong>2012</strong> 93
GOVERNANCE EXECUTIVE MANAGEMENTEXECUTIVEMANAGEMENTCynthia CarrollRené MédoriBrian BeamishThe Company has two principalexecutive committees. The GroupManagement Committee (GMC)(which meets fortnightly) isresponsible for formulating strategyfor discussion and approval by theBoard, monitoring performanceand managing the Group’s portfolio.The Executive Committee (ExCo)(which meets at least every twomonths for a two-day session) isresponsible for developing andimplementing Group-wide policiesand programmes and for theadoption of best practice standardsacross the Group.GMC AND EXCO MEMBERSCynthia CarrollSee page 92 for biographical details.René MédoriSee page 92 for biographical details.Brian BeamishBSc (Mechanical Engineering)56, is Group director, mining andtechnology. He is a member of theS&SD and Investment Committeesand is a non-executive director of<strong>Anglo</strong> <strong>American</strong> Platinum andDe Beers. He was CEO of Base Metalsbetween 2007 and 2009 and prior tothis spent 20 years at <strong>Anglo</strong> <strong>American</strong>Platinum and its forerunner,Johannesburg ConsolidatedInvestment Company Limited, includingfour years as executive director ofoperations between 1996 and 1999.Brian has more than 30 years of miningindustry experience in variouscommodities and geographies.Mervyn WalkerMA53, is Group director, HR and corporateaffairs. He is a solicitor by training andjoined <strong>Anglo</strong> <strong>American</strong> in 2008 fromMondi, where he was group HR andlegal director. He is currently alsonon-executive chairman of pensionschemes for AMEC plc. Mervynpreviously held a series of senior rolesat British Airways, including HR director,legal director, director of purchasingand director of UK airports.David WestonMBA, BSc (Eng)54, is Group director, businessperformance and projects. He is amember of the S&SD and InvestmentCommittees. He spent 25 years withShell and was president of Shell CanadaProducts before joining <strong>Anglo</strong><strong>American</strong> in 2006 as CEO of IndustrialMinerals (Tarmac). David served as theGroup’s technical director betweenApril and October 2009. He is also anon-executive director of Kumba IronOre Ltd. and of GDF SUEZ EnergyInternational (formerly InternationalPower plc).Mervyn WalkerPauloCastellari-PorchiaSeamus FrenchDavid WestonWalter De SimoniGodfrey GomwePeter WhitcuttRuben FernandesChris GriffithKhanyisile KweyamaJohn MacKenzieNorman MbazimaPhilippe MellierDuncan WanbladPeter WhitcuttBCom (Hons), CA (SA), MBA47, is Group director, strategy andbusiness development. He joined<strong>Anglo</strong> <strong>American</strong> in 1990 within thecorporate finance division. He workedon the merger of Minorco with<strong>Anglo</strong> <strong>American</strong>, the listing of<strong>Anglo</strong> <strong>American</strong> in 1999 and thesubsequent unwinding of the crossholdingwith De Beers. Peter wasappointed Group head of finance in2003, CFO of Base Metals in August2008 and to his present position inOctober 2009.94 <strong>Anglo</strong> <strong>American</strong> plc <strong>Annual</strong> <strong>Report</strong> <strong>2012</strong>
EXCO MEMBERSPaulo Castellari-PorchiaBCom, MBA42, is CEO of Iron Ore Brazil. He waspreviously CEO of <strong>Anglo</strong> <strong>American</strong>’sPhosphates and Niobium businessesin Brazil and served in <strong>Anglo</strong> <strong>American</strong>’sformer Base Metals division. Paulo’scareer with the Group started in1993 and has included positions at<strong>Anglo</strong>Gold Ashanti and Minorco in anumber of corporate finance and capitalproject roles.Walter De SimoniBSc (Mining Eng)57, is CEO of Nickel. Walter joined<strong>Anglo</strong> <strong>American</strong> in 1978. He wasappointed president of <strong>Anglo</strong> BaseMetals Brazil in 2005. Walter becameCEO of <strong>Anglo</strong> <strong>American</strong> Brazil in 2006,a position he held until becoming CEOof Nickel in October 2009.Ruben FernandesMSc (Metallurgical Engineering), MBA47, was appointed CEO of Niobium andPhosphates in July <strong>2012</strong>. Ruben washead of mining at Votorantim Metals inBrazil from 2011, in charge of projects,exploration activities around the worldand operations in Peru and Colombia.He was COO at Vale Fertilizers from2009, responsible for the fertiliseroperations, sales and marketing.Ruben was CEO of Kaolin Companies– Pará Pigments and Cadam – twosubsidiaries of Vale, from 2007, heldvarious analysis and marketing rolesin Vale’s Base Metals department from1999 and, prior to this, worked inVotorantim’s zinc business and atEletrometal Special Metals in Brazil.Seamus FrenchBEng (Chemical)50, is CEO of Metallurgical Coal. Hejoined WMC Resources in Australiain 1994, initially in a strategic planningand business development role andprogressed to various operationalmanagement roles, gaining extensiveexperience in the gold and nickelbusinesses before advancing to theposition of executive general managerCopper-Uranium division. Seamusjoined BHP Billiton as global vicepresident, business excellencefollowing its takeover of WMC in 2005.He was appointed regional CEO of<strong>Anglo</strong> Coal Australia in 2007, bringingstrong skills in operations, safety andbusiness improvement to the role.Godfrey GomweBAcc, CA (Z), MBL57, was appointed CEO of Thermal Coalwith effect from 1 September <strong>2012</strong>.Godfrey is also responsible for<strong>Anglo</strong> <strong>American</strong>’s manganese interests.He is a non-executive director of ThebeInvestment Corporation (Pty) Ltd. Untilhis appointment as CEO of ThermalCoal, he was a non-executive director of<strong>Anglo</strong> <strong>American</strong> Platinum and KumbaIron Ore. Godfrey was previouslyfinance director and COO of <strong>Anglo</strong><strong>American</strong> South Africa and chairmanand CEO of <strong>Anglo</strong> <strong>American</strong> Zimbabwe.Chris GriffithBEng (Mining) Hons, Pr Eng47, was appointed CEO of <strong>Anglo</strong><strong>American</strong> Platinum Limited with effectfrom 1 September <strong>2012</strong>. He waspreviously CEO of Kumba Iron Orefrom 2008. Prior to this he was<strong>Anglo</strong> <strong>American</strong> Platinum’s head ofoperations for joint ventures. Chris hasbeen with <strong>Anglo</strong> <strong>American</strong> for morethan two decades.Khanyisile KweyamaBS Administration (USA), PDM,MM Human Resources47, was appointed executive director,<strong>Anglo</strong> <strong>American</strong> South Africa Limitedwith effect from 1 September <strong>2012</strong>.Khanyisile formerly served on theexecutive committee of Platinum,during which time she enhanced HRprogrammes and significantly improvedrelations with unions and brought wagenegotiations to a successful conclusion.She gained corporate experience in anumber of international companies,including BMW, Altech and BarloworldLtd, holding executive rolesincorporating human resources,industrial relations, corporate affairs,stakeholder relations andtransformation.John MacKenzieMSc Eng, MBL44, is CEO of Copper. He joined the<strong>Anglo</strong> <strong>American</strong> Gold and UraniumDivision in 1990 and was promoted tovice president of <strong>Anglo</strong> Coal, South<strong>American</strong> Operations in 1999. In 2004,he became general manager of theMinera Loma de Níquel operation inVenezuela. John was appointed CEO ofBase Metals’ zinc operations in 2006,and was appointed to his currentposition in 2009.Norman MbazimaFCCA, FZICA54, was appointed CEO of Kumba IronOre with effect from 1 September <strong>2012</strong>.He joined <strong>Anglo</strong> <strong>American</strong> in 2001 atKonkola Copper Mines plc. He wassubsequently appointed global CFOfor <strong>Anglo</strong> Coal. He became executivedirector of finance at <strong>Anglo</strong> <strong>American</strong>Platinum in June 2006 and laterstepped in as joint acting CEO. Prior tothis, Norman was CEO of Scaw Metalsfrom May 2008 and later CEO ofThermal Coal from October 2009,a position he held until <strong>2012</strong>.Philippe MellierMsc Eng, MBA57, was appointed CEO of De BeersGroup in July 2011. He began his careerin 1980 with the Ford Motor Company,where he occupied various seniormanagement positions over 19 years.In 1999 Philippe joined Renault asa senior vice president in charge ofEuropean sales, and was a memberof the management board. In 2001he moved to Volvo AB to becomechairman and CEO of Renault Trucks,and a member of the Volvo Groupexecutive committee. In 2003, Philippebecame president of Alstom Transportand was appointed executive vicepresident of Alstom Group a year later.Duncan WanbladBSc (Eng) Mech,GDE (Eng Management)46, is Group director, Other Miningand Industrial businesses. He began hiscareer at Johannesburg ConsolidatedInvestment Company Limited in 1990.He was appointed to the board of<strong>Anglo</strong> <strong>American</strong> Platinum in 2004.Duncan was appointed joint interimCEO of <strong>Anglo</strong> <strong>American</strong> Platinum in2007, before taking over as CEO of<strong>Anglo</strong> <strong>American</strong>’s copper operations in2008. He was appointed to his currentposition in October 2009.Governance<strong>Anglo</strong> <strong>American</strong> plc <strong>Annual</strong> <strong>Report</strong> <strong>2012</strong> 95
GOVERNANCE ROLE OF THE BOARDTHE ROLE OFTHE BOARDThe Board of directors has a dutyto promote the long term successof the Company for its shareholders.Its role includes the establishment,review and monitoring of strategicobjectives, approval of majoracquisitions, disposals and capitalexpenditure and overseeing theGroup’s systems of internal control,governance and risk management.A schedule of matters reserved for theBoard’s decision details key aspects ofthe Company’s affairs that the Boarddoes not delegate (including, amongother things, approval of businessplans, budgets and materialexpenditure). For the full list, pleasesee the Company’s website.Every year the Board holds a two-daystrategy meeting at which thenon-executive directors (NEDs)contribute their expertise andindependent perspective in developingthe strategy of the Company.Role of the chairmanThe Board is chaired by Sir JohnParker. The chairman is responsiblefor leading the Board and for itseffectiveness.Role of the chief executiveThe CEO is responsible for theexecution of strategy and theday-to-day management of the Group,supported by the GMC and the ExCo,both of which are currently chairedby Cynthia Carroll. The functions andmembership of GMC and ExCo areset out on pages 94–95.The Company has adopted theInstitute of Chartered Secretariesand Administrators’ Statement ofDivision of Responsibilities betweenthe Chairman and the CEO.Role of the seniorindependent directorDavid Challen is the seniorindependent non-executive director(SID). He is available to shareholders,acts as a sounding board and confidantfor the chairman and is available as anintermediary for the other directorsif necessary.Independence of directorsThe Board has a strong independentelement and currently comprises, inaddition to the chairman, two executivedirectors and eight NEDs, all of whomare independent according to thedefinition contained in the Code. Fullbiographical details for each directorare given on pages 92–93. The lettersof appointment of the NEDs (as wellas the executive directors’ servicecontracts) are available for inspectionat the registered office of theCompany.None of the NEDs has servedconcurrently with an executive directorfor more than nine years. As DavidChallen has been on the Board for oversix years his re-appointment is subjectto particularly rigorous review. TheBoard believes that through hischallenging and questioning ofmanagement he continues to displayall of the qualities of independencepursuant to the criteria set out inthe Code.Board evaluationAn evaluation of the Board by anexternal facilitator, with no priorrelationship with <strong>Anglo</strong> <strong>American</strong>,was completed in February <strong>2012</strong>.This involved a series of one- to-oneinterviews with board members togather views, and attendance at aBoard meeting by the facilitator.Overall, directors felt that the Boardwas functioning well. The compositionand balance of the Board is good, andcontinues to develop. The frequency ofmeetings is appropriate, and they arewell organised and well chaired, withan inclusive style encouraging open,healthy debate. It was agreed thatfinance and risk management, inparticular, were well covered and thatthe chairman was very effective atcommunicating with externalstakeholders – for example, investorsand media.96 <strong>Anglo</strong> <strong>American</strong> plc <strong>Annual</strong> <strong>Report</strong> <strong>2012</strong>
There is always room for improvementof course, and the evaluation identifieda number of areas where we could doeven better. As ever, directors wouldlike to have more time for strategicdiscussions, and for those discussionsto be informed by more detail onstrategic alternatives to the relevantinvestment/project under review. Aspart of the evaluation, directors raiseda number of strategic questions to beaddressed. It has been agreed thatthese will be scheduled into theBoard’s agenda for discussion overthe coming 12 to 18 months – inaddition to the annual two-day strategymeeting. Directors also suggesteda number of areas that might beprogrammed into the Board’s agendato allow a deeper discussion, including:business unit (BU) presentations;competitor benchmarking; successionplanning; retrospective review of majorproject decisions to establish keylearnings; and external political andmarket updates.In order to facilitate openness andconstructive debate between ourexecutive directors and NEDs, dinnersare arranged for the day before eachBoard meeting. At these, directorsare encouraged to raise issues in aninformal setting. These dinners providean opportunity, inter alia, to discuss theperformance of management andto air subjects outside the confinesof the boardroom in an informal andconstructive manner. At every Boardmeeting, time is set aside for a NEDsonly discussion. The Board receivesregular governance updates from thecompany secretary highlightingdevelopments in company law,corporate governance and bestpractice. Board papers are circulatedone week before meetings – bothelectronically, via iPads, and in paperform. Members of the GMC attend allBoard meetings.Director training<strong>Anglo</strong> <strong>American</strong>’s directors havea wide range of expertise aswell as significant experience instrategic, financial, commercialand mining activities.Upon appointment, directors areprovided with recent Board materialsand a reference manual containinginformation on legal obligations andother matters of which they shouldbe aware. Guidance is provided onMarket Conduct under the FinancialServices Authority (FSA), theCompany’s Articles, the Code andthe Model Code. The manual alsoincludes items such as Board andcommittee terms of reference,relevant company informationand guidance on where to obtainindependent advice. The manualwas significantly updated during<strong>2012</strong> and will continue to be updatedperiodically when appropriate.As part of the directors’ formalinduction process, meetings arearranged with senior executives inorder to develop a full understandingof the <strong>Anglo</strong> <strong>American</strong> Group. Trainingand briefings are also available todirectors on appointment andthroughout their tenure, as necessary,taking into account existingqualifications and experience.Directors also have access tomanagement, and to the advice of thecompany secretary.Furthermore, all directors are entitledto seek independent professionaladvice concerning the affairs of<strong>Anglo</strong> <strong>American</strong> at the Company’sexpense, although no such advicewas sought during <strong>2012</strong>. Regularpresentations are made to the Boardby BU management on the activitiesof operations.The company secretary facilitatesboard training and during the yeardirectors attended courses on,inter alia, corporate governance,strategy, compliance, current auditand remuneration committee issuesand general director duties andresponsibilities. The directors aregiven the opportunity to discuss theirdevelopment needs with the chairmanduring individual feedback meetings.Dealing with conflicts of interestIf directors become aware that theyhave a direct or indirect interest in anexisting or proposed transaction with<strong>Anglo</strong> <strong>American</strong>, they notify theBoard at the next Board meeting orby a written declaration. Directorshave a continuing duty to updateany changes in these interests. During<strong>2012</strong> Mr Nhleko recused himself froma discussion on an item of businesswhere there was a potential conflictof interest. In accordance with theCompany’s Articles and relevantlegislation, a quorum of the Board,which does not include the directorwith the potential conflict of interest,can authorise potential conflicts ofinterest and such authorisations canbe limited in scope and are reviewedon an annual basis. During the yearunder review, the conflicts registerwas updated and the conflictmanagement procedures wereadhered to and operated effectively.Governance<strong>Anglo</strong> <strong>American</strong> plc <strong>Annual</strong> <strong>Report</strong> <strong>2012</strong> 97
GOVERNANCE BOARD IN ACTIONBOARD VISIT TO BRAZIL: OCTOBER <strong>2012</strong>Directors andexecutivesduring thecourse of thevisit to theMinas-RioProject inOctober <strong>2012</strong>.BOARD IN ACTIONDirectors undertake regular visits tooperations and projects and, in <strong>2012</strong>,operations and projects in Brazil andAlaska were visited.BOARD VISIT TO BRAZILIn October <strong>2012</strong> the Board met inBrazil. Directors took the opportunityto meet with the Governor of theState of Minas Gerais and otherstate politicians.Directors then visited the project,touring the beneficiation plant andthe pipeline as well as the localSENAI training centre funded by<strong>Anglo</strong> <strong>American</strong>.During the course of the visit, theBoard received detailed presentationsfrom the management of the Minas-Rio Project.NEDs’ fact finding tripsSome of the NEDs attended meetingsin Alaska with <strong>Anglo</strong> <strong>American</strong>employees, the Alaskan governmentand local communities involved inthe Pebble Project. Some alsovisited the Niobium and Phosphateoperations in Brazil following theBoard meeting that was held there.COMMUNICATING WITHOUR INVESTORSThe Company maintains an activeengagement with its key financialaudiences, including institutionalshareholders and sell-side analysts,as well as potential shareholders.The Investor Relations departmentmanages the interaction with theseaudiences and regular presentationstake place at the time of interim andfinal results as well as during the restof the year. An active programmeof communication with potentialshareholders is also maintained.A schedule of investor relationsactivities carried out during <strong>2012</strong>is shown on the following page.98 <strong>Anglo</strong> <strong>American</strong> plc <strong>Annual</strong> <strong>Report</strong> <strong>2012</strong>
Investor relations activities timeline <strong>2012</strong>January23 January Chairman shareholder meetingFebruary17 February Financial results webcast and analyst roundtable17 February Preliminary financial resultsw/c 20 FebruaryRoadshow: CFO – London & EdinburghMarchAprilMayJuneJulyAugustSeptemberOctoberw/c 20 FebruaryRoadshow: CEO & BU Heads – London, videoconference to Cape Town,Johannesburg & Boston27–28 February Broker conference: Investor relations – Florida01 March Roadshow: CFO – Johannesburg08 March Broker conference: Investor relations – London14 March Chairman shareholder meeting14 & 20 March Roadshow: Chairman – London20 March Chairman shareholder meeting21 March Broker conference: Investor relations – London22 March Sales briefing: CFO – London23 March Broker reverse roadshow: Investor relations – London26 March Broker reverse roadshow: Investor relations – London04 April Sales briefing: Investor relations – London19 April AGM: – London20 April Roadshow: Investor relations – Frankfurt30 April Broker reverse roadshow: Investor relations – London10 May Broker conference: Investor relations – Milan15–17 May Broker conference: CEO – Miami16 May Sales briefing: CFO – London25 May Roadshow: CFO – Paris06 June Chairman shareholder meeting08 June Roadshow: BU Head – Boston12 June Informal gathering: Board & ExCo – London14 June Investor day webcast (Coal)19 June Chairman shareholder meeting19 June Roadshow: Chairman – Johannesburg21–26 June Roadshow: CFO – East & West Coast US27 June Chairman shareholder meeting02–04 July Roadshow: CFO – Singapore27 July Interim financial results27 July Interim financial results webcast and roundtable06–18 September Roadshow: CEO – London, Edinburgh, Boston, Cape Town, Johannesburg14 September Roadshow: CFO – London17 September Sales briefing: CFO – London19 September Broker conference: Investor relations – London20 September Sales briefing: CFO – London21 September Roadshow meetings: Investor relations – VCs to Japan24 September Roadshow: CEO – New York01–03 October Roadshow: Investor relations – Chicago & Canada09 October Sales briefing: CEO – London29–30 October Roadshow: Investor relations – BeneluxBoard oversightAny significant concerns raisedby a shareholder in relation tothe Company and its affairs arecommunicated to the Board. TheBoard is briefed on a regular basisby the Investor Relations departmentand analysts’ reports are circulatedto the directors. Feedback frommeetings held between executivemanagement, or the Investor Relationsdepartment, and institutionalshareholders is also communicatedto the Board.Institutional investorsDuring the year there were regularpresentations to, and meetingswith, institutional investors in the UK,South Africa, continental Europe, theUS and Asia Pacific to communicatethe strategy and performance of<strong>Anglo</strong> <strong>American</strong>. Executive directorsas well as key executives, includingbusiness unit heads, host suchpresentations, which include seminarsfor investors and analysts andone-on-one meetings. Throughoutthe year, executive management alsopresents at industry conferences thatare mainly organised by investmentbanks for their institutional investorbase. During <strong>2012</strong>, the chairmanattended investor roadshows inLondon and Cape Town. DavidChallen, in his capacity as the SID,works closely with the chairman tomaintain his understanding of theissues and concerns of majorshareholders. The chairman, SIDand other NEDs are also available toshareholders to discuss any matterthey wish to raise. The Company’swebsite provides the latest newsand historical financial information,details about forthcoming events forshareholders and analysts, and otherinformation regarding <strong>Anglo</strong> <strong>American</strong>.GovernanceNovember07 November Broker conference: Investor relations – London09 November Chairman shareholder meeting14 November Broker conference: CFO – London15 November Broker reverse roadshow: Investor relations – London16 November Roadshow: CFO – Paris30 November Investor Day webcast (Diamonds)<strong>Anglo</strong> <strong>American</strong> plc <strong>Annual</strong> <strong>Report</strong> <strong>2012</strong> 99
GOVERNANCE BOARD IN ACTIONBOARDCOMMITTEESSubject to those matters reservedfor its decision, the Board delegatescertain responsibilities to a numberof standing committees – the Safetyand Sustainable Development,Remuneration, Nomination and AuditCommittees. The terms of referencefor each of these committees and aschedule of matters reserved for theBoard’s decision are published onthe Company’s website.SAFETY AND SUSTAINABLE DEVELOPMENT(S&SD) COMMITTEERole and responsibilities• Reviewing the development of frameworkpolicies and guidelines for the managementof sustainable development and socio-politicalrisks, including safety, health and environmentPeter WoickeChairman, S&SDCommitteeComposition• Peter Woicke –chairman• Brian Beamish• Cynthia Carroll• Ray O’Rourke• Sir John Parker• Jack Thompson• David WestonIn additionto the members,Committeemeetings areattended bybusinessunit CEOs, S&SDand corporateaffairs functionalspecialists fromacross the Group,all of whomparticipate activelyin the Committee’sdiscussions.“Since joiningthe S&SDCommitteein 2007, I havewitnessed astep changein the attitudeto safety andsustainabledevelopmentthroughoutthe Group.”Peter WoickeChairman, S&SDCommittee• Reviewing the performance of the Company andthe progressive implementation of its S&SD andcorporate affairs policies• Receiving reports covering matters relatingto material S&SD risks and liabilities• Monitoring key indicators and learning fromincidents and, where appropriate, ensuringthey are communicated throughout the Group• Considering material national and internationalregulatory and technical developments in thefield of S&SD management.Committee discussions in <strong>2012</strong>• At each meeting, the Committee reviewedand discussed a quarterly report coveringthe Group’s performance across a range ofS&SD areas, including safety, occupationalhealth, HIV/AIDS, energy and water usageand social performance• Sadly, 13 colleagues lost their lives in workrelatedincidents during the year. The Committeereceived a detailed account of each fatal incidentfrom the relevant BU CEO, together with therelated management response• BU CEOs present to the Committee on allaspects of their units’ S&SD performance ona rotational basis. During <strong>2012</strong>, the Committeereceived reports from Kumba Iron Ore, ThermalCoal, Phosphates and Niobium, Exploration,Iron Ore Brazil and Nickel• The Committee discussed a range of topicsrelated to its oversight of S&SD risks, includingmethane and explosive dust control, slopestability, tailings risk and shaft integrity• In recent years, the Committee has invitedits NGO partners, and other third parties withS&SD expertise, to give briefings on areasof interest and to provide a valuable externalperspective on the Group’s performanceand progress. In <strong>2012</strong> the Committeewelcomed presentations from CAREInternational on its health and educationwork in partnership with <strong>Anglo</strong> <strong>American</strong>, andfrom PricewaterhouseCoopers on the resultsof their annual audit of the Group’s sustainabledevelopment reporting.100 <strong>Anglo</strong> <strong>American</strong> plc <strong>Annual</strong> <strong>Report</strong> <strong>2012</strong>
REMUNERATION COMMITTEESir Philip HamptonChairman,RemunerationCommitteeCompositionIn compliance withthe Code, theCommitteecomprises onlyindependentnon-executivedirectors:• Sir PhilipHampton –chairman• David Challen• Sir CK Chow• Jack Thompson• Peter Woicke“It is therole of theRemunerationCommittee toensure that theremunerationarrangementsfor executivedirectorsoffer everyencouragementto enhance theCompany’sperformanceand deliverour strategy –responsibly.”Sir PhilipHamptonChairman,RemunerationCommitteeRole and responsibilities• Establishing and developing the Group’sgeneral policy on executive and seniormanagement remuneration• Determining specific remuneration packagesfor the chairman and executive directors• Designing the Company’s share incentiveschemes.Committee discussions in <strong>2012</strong>In February <strong>2012</strong>, the Committee:• Reviewed executive director personal keyperformance indicators for <strong>2012</strong> and Companyfinancial and safety targets to ensure alignmentwith Company strategy• Discussed with the Company chairman andCEO respectively, the CEO’s and financedirector’s performance in 2011 to adjudicateon bonus outcomes• Approved a proposal that a dividend equivalentbe paid on shares vesting under Long-TermInvestment Plan (LTIP) awards from the <strong>2012</strong>award onwards• Reviewed executive directors’ shareholdingsin the Company prior to <strong>2012</strong> share awardsbeing made• Discussed the Department of BusinessInnovation and Skills’ (BIS) proposals that wereannounced on 23 January.In April <strong>2012</strong>, the Committee:• Formally confirmed the vesting of 2009 BonusShare Plan (BSP) and LTIP awards and thegranting of <strong>2012</strong> BSP and LTIP awards• Reviewed the proposal for asset optimisation andsupply chain targets for the <strong>2012</strong> LTIP award• Discussed investor feedback on executiveremuneration prior to the vote on the Directors’Remuneration <strong>Report</strong>• Discussed the further consultation launched byBIS in March.In June <strong>2012</strong>, the Committee:• Set the asset optimisation and supply chaintargets for the <strong>2012</strong> LTIP award• Reviewed corporate governance issues in theprevious quarter and major issues arising fromthe main AGM voting season.In December <strong>2012</strong>, the Committee:• Reviewed directors’ salaries, taking into accountthe general salary review for the broaderemployee population• Considered GMC and ExCo remunerationelements and performance contracts for 2013• Discussed the early adoption of the BISproposals and reviewed the impact of themon the Remuneration <strong>Report</strong> for <strong>2012</strong>• Reviewed its terms of reference• Reviewed corporate governance issues thathad arisen since the previous meeting.Governance<strong>Anglo</strong> <strong>American</strong> plc <strong>Annual</strong> <strong>Report</strong> <strong>2012</strong> 101
GOVERNANCE BOARD IN ACTIONNOMINATION COMMITTEEAUDIT COMMITTEESir John ParkerChairman,NominationCommitteeCompositionCompliant withthe Code:• Sir John Parker –chairman• David Challen• Sir CK Chow• Peter Woicke“TheNominationCommittee’s aimis to enhancethe currentdiversity ofthe Board byidentifying andnominatingsuitablyqualifiedcandidates.”Sir John ParkerChairman,NominationCommitteeRole and responsibilities• Setting guidelines (with the approval of theBoard) for the types of skills, experience anddiversity being sought when making a search fornew directors and with the assistance of externalconsultants, identifying and reviewing in detaileach potential candidate available in the market.The Committee then agrees a ‘long list’ ofcandidates for each directorship and followingfurther discussion and research decides upon ashortlist of candidates for interview. Shortlistedcandidates are each interviewed by theCommittee members who then convene todiscuss their impressions and conclusions,culminating in a recommendation to the Board;• Making recommendations as to the compositionof the Board and its committees and the balancebetween executive directors and NEDs, with theaim of cultivating a board with the appropriatemix of skills, experience, independence andknowledge of the Company;• Ensuring that the HR function of the Groupregularly reviews and updates the successionplans of directors and senior managers.Diversity policyTo increase the representation of women on theBoard (excluding the chairman) from 20% toabout 30% by 2013. In <strong>2012</strong> the representationof women on the Company’s Board (excludingthe chairman) reached 27%. With the resignationof Dr Ramphele in July <strong>2012</strong>, this fell to 20%.Committee discussions in <strong>2012</strong>• Following extensive research into potentialcandidates, Anne Stevens was appointed inMay <strong>2012</strong>;• The Board received biannual presentations fromthe Group director, HR and corporate affairs.These presentations dealt with successionmanagement at ExCo level and long term talentmanagement across the Group;• Following the October <strong>2012</strong> announcementthat Cynthia Carroll would be standing downas CEO of the Company, the Committeeimmediately set in motion the process to identifya successor, resulting in the appointment ofMark Cutifani;• The Committee initiated a search for a furthernon-executive director to join the Board and theAudit Committee with the intention that theappointee will succeed David Challen aschairman of the Audit Committee;• Following an extensive search, Byron Grotewas identified by the Committee and has beennominated by the Board for election at the AGMon 19 April 2013.David ChallenChairman, AuditCommitteeCompositionCompliant with theCode andcomprises onlyindependentnon-executivedirectors:• David Challen –chairman• Sir PhilipHampton• Phuthuma Nhleko• Ray O’Rourke• Anne Stevens“The AuditCommitteeplays apivotal role inensuring highstandards ofcorporategovernanceand providesassurance tothe Board onits reports toshareholders.”David ChallenChairman, AuditCommitteeRole and responsibilities• Monitoring the integrity of the annual andinterim financial statements, the accompanyingreports to shareholders and corporategovernance statements;• Making recommendations to the Boardconcerning the adoption of the annualand interim financial statements;• Overseeing the Group’s relations with theexternal auditors;• Making recommendations to the Board onthe appointment, retention and removal ofthe external auditors;• Reviewing and monitoring the effectivenessof the Group’s internal control and riskmanagementsystems, including reviewingthe process for identifying, assessing andreporting all key risks;• Approving the terms of reference and plansof the internal audit function;• Approving the internal audit plan and reviewingregular reports from the head of internal audit oneffectiveness of the internal control system;• Receiving reports from management on thekey risks of the Group and management ofthose risks.Committee discussions in <strong>2012</strong>At the February <strong>2012</strong> meeting the Committee:• Reviewed and approved the 2011 year endresults, accounting matters and press releasesubject to comments from the Committee toimprove the disclosures;• Reviewed the accounting treatment anddisclosure in connection with the option forthe Chilean state-owned entity, Codelco, tobuy a stake up to 49% in <strong>Anglo</strong> <strong>American</strong> Sur.The Committee approved the accountingtreatment and disclosure following the discussionwith management and the external auditors;• Discussed the external auditors’ reportthat included comments on internal controlfindings, a statement on their independenceand objectivity and compliance with the AuditPractices Board ethical standards and theletter of representation. The Committee notedthe report;• Reviewed a report on the Group’s ore reservesand mineral resources. Significant changes in thestatements from prior years were highlighted anddiscussed along with the three-year audit planconducted by independent third-party auditors;• Noted and approved the register of non-auditassignments conducted by the external auditorsin 2011;102 <strong>Anglo</strong> <strong>American</strong> plc <strong>Annual</strong> <strong>Report</strong> <strong>2012</strong>
• Received a report regarding internal audit,including the results of internal audit work andwhistleblowing activity in 2011;• Reviewed and approved a paper on the Group’sinsurance arrangements and approach for <strong>2012</strong>.At the July <strong>2012</strong> meeting the Committee:• Received a report from management onsignificant accounting issues for the six-monthperiod ending 30 June <strong>2012</strong>, including theaccounting treatment of the Codelco option;• Reviewed and discussed the <strong>2012</strong> interim resultsand disclosures. The Committee providedvarious comments on the disclosures;• Reviewed a report from the external auditors,their management letter highlighting internalcontrol findings from the 2011 audit and thedraft letter of representation;• Reviewed and approved the register of nonauditassignments undertaken by the externalauditors in the period to 30 June <strong>2012</strong>. Thecommittee also approved changes to the policycovering the provision of non-audit services bythe external auditors;• Received a report on the work of the internalauditors to 30 June <strong>2012</strong>;• Received and discussed a report coveringthe key risks facing the Group and each of itsbusiness units based on the output of riskmanagement work undertaken by management.The Committee noted and approved the report;• Received an update on the review of the Group’sinsurance arrangements and noted the newstructure in place for insurance of the Group’sassets and business interruption exposures;• Reviewed the process undertaken bymanagement to assess the external auditors’independence, objectivity and effectivenessduring the 2011 audit. The Committee noted thatDeloitte LLP had conducted the audit effectivelyin an independent and objective manner.At the December <strong>2012</strong> meeting the Committee:• Reviewed the significant audit and accountingitems for the <strong>2012</strong> year end. This includedthe process for reviewing the valuation of theMinas-Rio project, the accounting implicationsof the Platinum structure review and theaccounting treatment for De Beers;• Approved the external auditors’ terms ofengagement, scope of work, the process for theannual audit, the applicable levels of materialityand the audit fee for <strong>2012</strong>. The Committeenoted the key audit risks highlighted by theexternal auditors;• Approved the internal audit plan for 2013 havingreviewed the plan and the process of how it isgenerated. The Committee satisfied itself thatthe plan was risk-based in its design;• Discussed and reviewed significant changes tothe Group’s risk profile and approved the 2013integrated risk management plan;• Discussed the responsibilities of the Committeearising from the changes to the Code following areview and consultation process undertaken bythe FRC in <strong>2012</strong>. The Committee reviewed itsterms of reference considering changes to theCode that relate to the role of audit committeesand concluded the current terms of referencewere broad enough to cover the changes.No amendments were therefore made.Governance<strong>Anglo</strong> <strong>American</strong> plc <strong>Annual</strong> <strong>Report</strong> <strong>2012</strong> 103
GOVERNANCE AUDIT COMMITTEE REPORTAUDITCOMMITTEEREPORTENSURING INDEPENDENCE OFTHE EXTERNAL AUDITORS<strong>Anglo</strong> <strong>American</strong>’s policy on auditors’independence is consistent with theethical standards published by theAudit Practices Board.A key factor that may impair auditors’independence is a lack of control overnon-audit services provided by theexternal auditors. In essence, theexternal auditors’ independence isdeemed to be impaired if the auditorsprovide a service that:• Results in the auditors acting as amanager or employee of the Group• Puts the auditors in the role ofadvocate for the Group or• Creates a mutuality of interestbetween the auditors and the Group.<strong>Anglo</strong> <strong>American</strong> addresses thisissue through three primarymeasures, namely:• Disclosure of the extent and natureof non-audit services• The prohibition of selected services –this includes the undertaking ofinternal audit services• Prior approval by the Audit Committeechairman of non-audit services wherethe cost of the proposed assignmentis likely to exceed $50,000.<strong>Anglo</strong> <strong>American</strong>’s policy on theprovision of non-audit services isregularly reviewed and was updatedduring <strong>2012</strong>. The definition ofprohibited non-audit servicescorresponds with the EuropeanCommission’s recommendations onauditors’ independence and with theEthical Standards issued by the AuditPractices Board in the UK.Other safeguards• The external auditors are requiredto adhere to a rotation policy basedon best practice and professionalstandards in the United Kingdom.The standard period for rotation ofthe audit engagement partner is fiveyears and, for any key audit partner,seven years. The audit engagementpartner was appointed in 2010 inaccordance with this requirement.• Any partner designated as a key auditpartner of <strong>Anglo</strong> <strong>American</strong> shall notbe employed by <strong>Anglo</strong> <strong>American</strong> ina key management position unlessa period of at least two years haselapsed since the conclusion of thelast relevant audit.• The external auditors are requiredto assess periodically, whether in theirprofessional judgement, they areindependent of the Group.• The Audit Committee ensures thatthe scope of the auditors’ work issufficient and that the auditors arefairly remunerated.• The Audit Committee has primaryresponsibility for makingrecommendations to the Board onthe appointment, re-appointmentand removal of the external auditors.• The Audit Committee has theauthority to engage independentcounsel and other advisers asthey determine necessary in orderto resolve issues on auditors’independence.• An annual assessment is undertakenof the auditors’ effectiveness,independence and objectivity. Theeffectiveness assessment involvesa review, with the senior financemanagers in each of the businessunits and relevant corporate functions,of the audit process, including theplanning, execution and reportingactivities along with an assessmentof the quality, quantity and leadershipof each of the external audit teamsinvolved in the audit. Anyimprovement opportunities identifiedare discussed with the externalauditors. The independence andobjectivity assessment is conductedby a review of compliance with thepolicies in place in the Group andwithin the external auditors tomaintain independence andobjectivity. The results of the revieware shared with the Audit Committee.Conclusions of the AuditCommittee for <strong>2012</strong>The Audit Committee has satisfieditself that the UK professional andregulatory requirements for auditpartner rotation and employmentof former employees of the externalauditors have been complied with.The Audit Committee consideredinformation pertaining to the balancebetween fees for audit and non-auditwork for the Group in <strong>2012</strong> andconcluded that the nature and extentof the non-audit fees do not presenta threat to the external auditors’independence. Details of fees paidare provided on page 152.Furthermore, after reviewing a reportfrom the external auditors on all theirrelationships with <strong>Anglo</strong> <strong>American</strong>that might reasonably have abearing on the external auditors’independence and a review conductedby management, the Committee hasconcluded that the external auditors’independence was not impaired.The Audit Committee held meetingswith the external auditors without thepresence of management on twooccasions and the chairman ofthe Audit Committee held regularmeetings with the audit engagementpartner during the year.104 <strong>Anglo</strong> <strong>American</strong> plc <strong>Annual</strong> <strong>Report</strong> <strong>2012</strong>
Audit Committee actionsin 2013During 2013 the Audit Committeewill continue its role in monitoring theintegrity of the financial statementsand reviewing the effectivenessof the Company’s internal controland risk-management systems.An item of key interest to the AuditCommittee will be to satisfy itselfthat the risk and audit processes withinDe Beers are fully integrated into<strong>Anglo</strong> <strong>American</strong> as appropriate.Consideration given tothe appointment of theexternal auditorsThe appointment of Deloitte LLPas the Group’s external auditors(incumbents since the listing of<strong>Anglo</strong> <strong>American</strong> in 1999) is kept underannual review and, if satisfactory,the Committee will recommend there-appointment of the audit firm.The appointment of Deloitte LLPfollowed a detailed evaluation,at the time of the listing, of thepredecessor audit firms and, ratherthan adopting a policy on tenderingfrequency, an annual review of theeffectiveness of the external auditis supplemented by a periodic,comprehensive reassessment bythe Committee. The Committee’sassessment of the external auditors’performance and independenceunderpins its recommendation to theBoard to propose to shareholdersthe re-appointment of Deloitte LLPas auditors until the conclusion of theAGM in 2014. Resolutions to authorisethe Board to re-appoint and determinethe remuneration of Deloitte LLPwill be proposed at the AGM on19 April 2013.The role of internal auditThe Group has an internal auditdepartment that reports centrallywith responsibility for reviewing andproviding assurance on the adequacyof the internal control environmentacross all of <strong>Anglo</strong> <strong>American</strong>’soperations.The head of internal audit isresponsible for reporting and followingup on the findings of this internal auditwork with local management and theAudit Committee on a regular basis.Internal audit teams operated in all theGroup’s principal divisions in the periodunder review, reporting findings tolocal senior management. The internalaudit function’s mandate and annualaudit coverage plans have beenapproved by the Audit Committee.The internal audit activities areperformed by teams of appropriate,qualified and experienced employees,supplemented if necessary throughthe engagement of externalpractitioners upon specified andagreed terms. A summary of auditresults and risk managementinformation was presented to theCommittee and Group seniormanagement at regular intervalsthroughout the year. The Group’shead of internal audit reports to theAudit Committee on the internalaudit function’s performance againstthe agreed internal audit plan.During <strong>2012</strong>, 440 audit projects werecompleted covering a varietyof financial, operational, strategicand compliance-related businessprocesses across all business unitsand functions. In addition, the internalaudit department responded to anumber of management requeststo investigate alleged breaches ofour business principles. During 2013the internal audit resources inDe Beers will be integrated into the<strong>Anglo</strong> <strong>American</strong> team and will adopta consistent approach to internalaudit work.Assessment of the effectivenessof internal control and riskmanagementThe GMC, as mandated by the Board,maintains a Group-wide system ofinternal control to manage significantGroup risks.This system, which has been operatingthroughout the year and to the dateof this report, supports the Board indischarging its responsibility forensuring that the wide range of risksassociated with the Group’s diverseinternational operations is effectivelymanaged in support of the creationand preservation of shareholderwealth. Please see pages 48–53 forfurther information on the key riskfactors <strong>Anglo</strong> <strong>American</strong> is exposed to.Where appropriate, necessary actionhas been or is being taken to remedyany failings or weakness identified as aresult of the review of the effectivenessof the internal control system.Governance<strong>Anglo</strong> <strong>American</strong> plc <strong>Annual</strong> <strong>Report</strong> <strong>2012</strong> 105
GOVERNANCE AUDIT COMMITTEE REPORTObtaining assurance on theinternal control environmentThe system of internal control, whichis embedded in all key operations,provides reasonable rather thanabsolute assurance that the Group’sbusiness objectives will be achievedwithin the risk tolerance levels definedby the Board. Regular managementreporting, which provides a balancedassessment of key risks and controls,is an important component of boardassurance. In addition, certain Boardcommittees focus on specific riskssuch as safety and capital investmentand provide assurance to the Board.The chief financial officers of theGroup’s business units provideconfirmation, on a six-monthlybasis, that financial and accountingcontrol frameworks have operatedsatisfactorily. The Board also receivesassurance from the Audit Committee,which derives its information, in part,from regular internal audit reports onrisk and internal control throughout theGroup and external audit reporting.The Group’s internal audit function hasa formal collaboration process in placewith the external auditors to ensureefficient coverage of internal controls.The <strong>Anglo</strong> <strong>American</strong> internal auditfunction is responsible for providingindependent assurance to executivemanagement and the Board on theeffectiveness of the risk-managementprocess throughout the Group.<strong>Anglo</strong> <strong>American</strong> seeks to have a soundsystem of internal control, based onthe Group’s policies and guidelines,in all material associates and jointventures. In those companies that areindependently managed, as well asjoint ventures, the directors who arerepresented on these organisations’boards seek assurance that significantrisks are being managed.Assurance regarding the accuracyand reliability of Mineral Resourcesand Ore Reserves disclosure isprovided through a combination ofinternal technically proficient staffand independent third parties.Whistle-blowing programmeThe Group has had a whistle-blowingprogramme in place for a number ofyears in all its managed operations.This facility operates in addition to astandardised Group-wide stakeholdercomplaints and grievance procedurethat is operated at all managedoperations (see the <strong>2012</strong> SustainableDevelopment <strong>Report</strong> for more details).The whistle-blowing programme,which is monitored by the AuditCommittee, is designed to enableemployees, customers, suppliers,managers or other stakeholders on aconfidential basis to raise concerns incases where conduct is deemed to becontrary to our values. It may include:• Actions that may result in danger tothe health and/or safety of peopleor damage to the environment• Unethical practice in accounting,internal accounting controls, financialreporting and auditing matters• Criminal offences, includingmoney laundering, fraud, briberyand corruption• Failure to comply with anylegal obligation• Miscarriage of justice• Any conduct contrary to the ethicalprinciples embraced in our businessprinciples or any similar policy• Any other legal or ethical concern• Concealment of any of the above.The programme makes availablea selection of telephonic, email,web-based and surface mailcommunication channels to anyperson in the world who hasinformation about unethical practicein <strong>Anglo</strong> <strong>American</strong> and its managedoperations. The multilingualcommunication facilities are operatedby independent service providers whoremove all indications from informationreceived as to the identity of the callersbefore submission to designatedpersons in the Group.During <strong>2012</strong>, 332 reports werereceived via the global ‘Speakup’facility, covering a broad spectrumof concerns, including:• Ethical• Criminal• Supplier relationships• Health and safety• HR issues.<strong>Report</strong>s received were kept strictlyconfidential and were referred toappropriate line managers withinthe Group for resolution. Whereappropriate, action was taken toaddress the issues raised. Thereports are analysed and monitoredto ensure the process is effective.106 <strong>Anglo</strong> <strong>American</strong> plc <strong>Annual</strong> <strong>Report</strong> <strong>2012</strong>
Risk management at<strong>Anglo</strong> <strong>American</strong>The Board’s policy on riskmanagement encompasses allsignificant business risks to theGroup, including:• Financial risk• Operational, including safety,technical, fraud and corruption risk• Compliance riskthat could undermine theachievement of business objectives.This system of risk management isdesigned so that the differentbusinesses are able to tailor and adapttheir risk-management processes tosuit their specific circumstances. Thisflexible approach has the commitmentof the Group’s senior management.There is clear accountability forrisk management, which is a keyperformance area of line managersthrough the Group. The requisiterisk and control capability is assuredthrough Board challenge andappropriate management selectionand skills development. Managersare supported in giving effect to theirrisk responsibilities through policiesand guidelines on risk and controlmanagement. Support throughfacilitated risk assessments isprovided by a central team responsiblefor ensuring a robust process isimplemented for risk-management.During <strong>2012</strong>, more than 135 separaterisk assessment workshops wereconducted reviewing:• Risk in business unit strategies• Risks to achieving mine orbusiness plans• Risks in capital projects• Risks to key change programmes,including the integration of De Beers.The results of these risk assessmentswere reported to senior managementand the Audit Committee. The processof risk management is designed toidentify internal and external threatsto the business and to assistmanagement in prioritising theirresponse to those risks. Continuousmonitoring of risk and controlprocesses, across headline risk areasand other business-specific risk areas,provides the basis for regular andexception reporting to businessmanagement, ExCo, the AuditCommittee and the Board.Some of the headline risk areas,which have been elaborated upon inthe financial review set out on pages48–53, are:• Commodity price risk• Political risk• Counterparty risk• Infrastructure andoperational performance risks.The risk assessment and reportingcriteria are designed to provide theBoard with a consistent, Group-wideperspective of the key risks. Thereports to the Audit Committee,which are submitted at least everysix months, include an assessmentof the likelihood and impact of risksmaterialising, as well as risk-mitigationinitiatives and their effectiveness.In conducting its annual review ofthe effectiveness of risk management,the Board considers the key findingsfrom the ongoing monitoring andreporting processes, managementassertions and independentassurance reports. The Board alsotakes account of material changesand trends in the risk profile andconsiders whether the control system,including reporting, adequatelysupports the Board in achieving its riskmanagement objectives.During the course of the year theBoard considered the Group’sresponsiveness to changes withinits business environment. TheBoard is satisfied that there is anongoing process, which has beenoperational during the year, and upto the date of approval of the <strong>Annual</strong><strong>Report</strong>, for identifying, evaluatingand managing the significant risksfaced by the Group. This includessocial, environmental and ethicalrisks as highlighted in the DisclosureGuidelines on Socially ResponsibleInvestment issued by the Associationof British Insurers. A detailed reporton social, environmental andethical issues is included in theCompany’s Sustainable Development<strong>Report</strong> <strong>2012</strong>.Accountability and auditThe Board is required to presenta balanced and understandableassessment of <strong>Anglo</strong> <strong>American</strong>’sfinancial position and prospects.Such assessment is provided in thechairman’s and CEO’s statements andthe operating and financial review ofthis <strong>Annual</strong> <strong>Report</strong>. The respectiveresponsibilities of the directors andexternal auditors are set out onpages 134, 136 and 137. As referred toin the directors’ report, the directorshave expressed their view that<strong>Anglo</strong> <strong>American</strong>’s business is agoing concern.Business integrityDuring <strong>2012</strong> we continued toimplement the necessary proceduresto ensure that our Business Integritypolicy operates effectively acrossthe Group and minimises the risk ofbribery as far as possible. We havenow trained more than 3,500managers through workshops inthe business units and developedsupplementary online training. Duringthe year we developed enhancedguidelines regarding acceptance andprovision of gifts and entertainmentand provided specific guidance on duediligence procedures for transactionswhere risks are considered higher. Weupdated our assessment of the risksof bribery and corruption in each ofour businesses, taking intoconsideration external and internalfactors and identified action plans forimplementation based on those riskassessments. We applied a duediligence process in individualtransactions to identify necessaryactions that mitigate risk of briberyin those transactions.During 2013 we will continue todevelop our procedures and obtainassurance that they are beingimplemented as we expect acrossthe Group.Governance<strong>Anglo</strong> <strong>American</strong> plc <strong>Annual</strong> <strong>Report</strong> <strong>2012</strong> 107
GOVERNANCE DIRECTORS’ REMUNERATION REPORTREMUNERATION REPORTOF THE DIRECTORSSir Philip HamptonChairman of theRemunerationCommittee“It is the role of the Company’s RemunerationCommittee to ensure that the remunerationarrangements for executive directors offer everyencouragement to enhance the Company’sperformance and deliver our strategy – responsibly.”IN THIS SECTION108Introductory letter109Policy on directorremuneration116Directorremunerationin <strong>2012</strong>120Outstanding shareinterests125Chief executivearrangements126RemunerationCommittee in <strong>2012</strong>127Other informationrequired1. INTRODUCTORY LETTERDear Shareholder,It is the role of the Company’sRemuneration Committee to ensurethat the remuneration arrangementsfor executive directors and othermembers of the Executive Committeeoffer every encouragement to enhancethe Company’s performance anddeliver our strategy – responsibly.We also need to ensure that the actualrewards received by the executivedirectors are proportionate to thelevels of performance achievedand the returns received by you asshareholders. As a Committee, wetherefore give full consideration to theCompany’s priorities, its performance,your interests and the interests of thewider communities we touch.To help us clearly explain what ourexecutive remuneration arrangementsare and what rewards have beenreceived over the past year and why,we have decided to adopt many ofthe changes being proposed by theUK Government to the reportingof directors’ remuneration a yearearlier than required. The contentsof our new form of report are set outon the left and the new ‘Single Figure’is shown in Figure 13 on page 119.As the chief executive reported inher introduction to this year’s <strong>Annual</strong><strong>Report</strong>, the current volatility incommodity prices is affecting theCompany’s short-term earnings butthe Company continues to makeprogress towards sustainable growthover the mid to long-term. Thesechallenges and successes arereflected in the remuneration receivedby executive directors for <strong>2012</strong>.• The significant drop in theCompany’s earnings in <strong>2012</strong>means that no bonus was payableto executive directors in respectof earnings performance. Thebonus amount that was earnedreflects management action takenin weak market conditions and thesuccessful delivery of key strategicoperational priorities.For more informationgo to section 3.2• The drop in earnings also meansthat, of the Enhancement Sharesinitially awarded in 2010, none vestedat the end of <strong>2012</strong>, as the requiredthree-year earnings growth wasnot achieved.For more informationgo to section 3.3• The success over the last three yearsof the Company’s longer-termefficiency programmes means thataround half the LTIP awards initiallygranted to executive directors in2010 are likely to vest. The other halfwill not vest as the full value of thesesavings have yet to be returned to youas shareholders in the form ofsuperior TSR.For more informationgo to section 3.4• With respect to <strong>2012</strong> there aretwo aspects of our remunerationarrangements that I would like tohighlight:• The Committee decided toremove the opportunity forexecutive directors to defer futureadditional amounts of bonus intoshares and to receivecorrespondingly higher awardsof Enhancement Shares; and• The Chairman voluntarily waivedthe increase in his fee level thatwas due to take effect from August<strong>2012</strong>. There has, therefore, beenno increase to his fees taken sincejoining the Company in 2009.108 <strong>Anglo</strong> <strong>American</strong> plc <strong>Annual</strong> <strong>Report</strong> <strong>2012</strong>
Investors will be aware from theannouncement on 8 January thatCynthia Carroll will step down fromthe Board at the Company’s <strong>Annual</strong>General Meeting in April 2013 andwill leave <strong>Anglo</strong> <strong>American</strong> at the endof that month. She will be succeededas chief executive by Mark Cutifaniwhose appointment will take effectfrom 3 April 2013. The details ofMr Cutifani’s remuneration packageand Mrs Carroll’s terminationarrangements can be found onpage 125 of this report.With the advent of a new chiefexecutive, the Committee intendsto review the performance measuresfor the Company’s incentive plansduring 2013, to ensure that theyremain aligned with Company strategyand are sufficiently stretching. We willof course consult with shareholdersbefore making any changes.We hope you find the new form ofreport helpful and look forward toyour feedback.2. POLICY ON DIRECTORREMUNERATION2.1 Remuneration policyFigures 1 and 2 summarise keyaspects of the Company’s remunerationpolicy for executive and non-executivedirectors from 1 January 2013. Thispolicy remains unchanged from<strong>2012</strong>, except as highlighted below.Further details on the Company’sarrangements are contained in Parts 3and 4 of this report.GovernanceSir Philip HamptonRemuneration Committee Chairman<strong>Anglo</strong> <strong>American</strong> plc <strong>Annual</strong> <strong>Report</strong> <strong>2012</strong> 109
GOVERNANCE DIRECTORS’ REMUNERATION REPORTFigure 1: Key aspects of the remuneration policy for executive directorsOverallremunerationPurpose Maximum opportunity OperationTo recruit andretain high-calibreexecutives andencourage themto enhance theCompany’sperformance,responsibly, inline with theCompany’sstrategy andshareholderinterestsLevels for individual pay elementsare set out belowSection 2.3 sets out the totalopportunity levels for executivedirectors under differentscenarios of CompanyperformanceThe Committee reviews the structure of the executivedirectors’ arrangements every few years and otherwiseas requiredRemuneration levels are reviewed annually to ensure theyremain competitive with reference to median levels in relevantFTSE 50 and global extractive companiesBasic salaryTo recruitand retainhigh-calibreexecutivesThere is no prescribed maximumannual increase. The Committeeis guided by the general increasefor the broader UK employeepopulation but on occasions mayneed to recognise, for example,development in role, change inresponsibility, and/or specificretention issuesBasic salary levels are reviewed annually by the Committee,taking account of Company performance, individualperformance, changes in responsibility and levels of increasefor the broader UK populationReference is also made to median levels within relevantFTSE 50 and global extractive companies, asmentioned aboveThe Committee considers the impact of any basic salaryincrease on the total remuneration packageBonus Share Plan(BSP)To encourage andreward delivery ofthe Company’sstrategic prioritiesTo help ensure,through theshare-basedelements, thatany resultingperformance issustained over thelonger-term in linewith shareholderinterestsCash awardMaximum award: 87.5% of salaryPerformance measures:50% – earnings per share (EPS)50% – individual objectiveslinked to the Company’sstrategic prioritiesSafety (loss of life and Lost TimeInjury Frequency Rate)Performance period: 1 yearBonus SharesMaximum award: 87.5% of salary<strong>Annual</strong> performance measuresand period: as for the cash awardFurther holding period: 3 yearsEnhancement SharesMaximum award: 75% of BonusShares (65.6% of salary)Performance measure:Real EPS growthPerformance period: 3 yearsThere are three elements to the BSP:• A performance-related cash element, payable after the endof the relevant financial year• A performance-related share element, in the form of aconditional award of Bonus Shares made after the end of therelevant financial year with a value equal to the cash elementand vesting subject to a further three-year holding period• An additional performance-related element, in the form ofEnhancement Shares granted after the end of the financialyear to a face value of 75% of the Bonus SharesThe Committee reviews the BSP measures annually to ensurethey remain appropriateBSP targets are reviewed at the same time to ensure they aredemanding yet realistic, given latest company strategy, priorperformance, and external expectationsDividends are payable on the Bonus Shares during theholding periodThe Committee is able to claw back any unvested Bonus andEnhancement Shares in the event of a material misstatementin the Company’s resultsChange for 2013: In response to investor views, theCommittee has decided to remove the opportunity forexecutives to voluntarily elect to defer up to 50% of the cashelement into Bonus SharesLong-TermIncentive Plan(LTIP)To encourageand rewardsignificantand sustainedoperatingefficienciesand the deliveryof superiorshareholderreturns, in linewith shareholderinterestsMaximum award350% of salary (receivedby the chief executive only)Performance measures50%: Total shareholderreturns (TSR)50%: Asset Optimisationand Supply Chain (AOSC)Performance period3 yearsThe Committee makes an annual conditional award of sharesto each executive directorPrior to grant the Committee reviews the performance targetsfor each measure to ensure they remain sufficiently stretchingDividend equivalents are paid on any shares that vestThe Committee is able to claw back any unvested grant(or future grants) in the event of a material misstatementin the Company’s resultsThe LTIP performance measures will be reviewed once thenew chief executive has assumed his duties. On the basis thatthe review is completed before the end of the financial year theCommittee reserves the right to apply any new measuresretrospectively to the 2013 award110 <strong>Anglo</strong> <strong>American</strong> plc <strong>Annual</strong> <strong>Report</strong> <strong>2012</strong>
PensionPurpose Maximum opportunity OperationTo offer marketcompetitivelevelsof benefitCompany contribution:30% of basic salaryExecutive directors participate in defined contributionpension arrangementsPrior to 6 April 2011, executive directors had the option ofall or part of their employer-funded defined contributionarrangements to be paid into an unregistered retirementbenefits scheme (an EFRBS). Since 6 April 2011, executivedirectors have the option for all or part of these contributionsto be treated as if paid to an unregistered unfunded retirementbenefit scheme (an UURBS)The Committee is prepared to consider requests fromexecutive directors for a pension allowance to be paid in placeof defined contribution arrangementsOther benefitsTo providemarketcompetitivebenefitsNot pre-determinedThe Company provides:• Car allowance• Medical insurance• Death and disability insurance• Limited personal taxation and financial advice• One club membership• Access to company car and driver, as required• Other ancillary benefits, including attendance at relevantpublic eventsExecutive directors are entitled to 28 days’ leave per annumand may only carry over 8 days from one leave year to the next(up to a maximum balance of 20 days). The Company buys outany accumulated leave in excess of 20 daysGovernanceAll-employeeshare plansTo offer allUK-basedemployeesthe opportunityto build ashareholding in atax-efficient wayMaximum SAYE saving:£3,000 pa, with which allemployees have the optionto buy Company shares at a20% discountMaximum SIP investment:£1,500 pa to purchase Companyshares, with the potential for a1:1 matching award from theCompany and, from time to time,a limited number of free sharesUK-based executive directors are eligible to participate inthe Company’s Save As You Earn (SAYE) scheme and ShareIncentive Plan (SIP)Recruitmentand promotionarrangementsTo secure theappointmentand promotionof high-calibreexecutivesNot pre-determinedFor external appointments the Committee may offeradditional cash and/or share-based elements when itconsiders these to be in the best interests of the Company(and therefore shareholders). Such payments would takeaccount of remuneration relinquished when leaving theformer employer and would reflect the nature, timehorizons and performance requirements attaching to thatremuneration. Shareholders will be informed of any suchpayments at the time of appointment. The Company hasretained its Discretionary Option Plan to use in suchcircumstances, if appropriateFor an internal appointment, any variable pay elementawarded in respect of the prior role may be allowed to payout according to its terms, adjusted as relevant to take intoaccount the appointment. In addition, any other ongoingremuneration obligations existing prior to appointment maycontinue, provided that they are put to shareholders forapproval at the earliest opportunityFor external and internal appointments, the Committee mayagree that the Company will meet certain relocation expensesas appropriate<strong>Anglo</strong> <strong>American</strong> plc <strong>Annual</strong> <strong>Report</strong> <strong>2012</strong> 111
GOVERNANCE DIRECTORS’ REMUNERATION REPORTFigure 1: Key aspects of the remuneration policy for executive directors continuedRetentionarrangementsPurpose Maximum opportunity OperationTo allow theCompany toretain topexecutivetalentNot pre-determinedThe Committee may make one-off share based awardsto executive directors in exceptional circumstances (suchas where an acute retention risk is present)The Committee will only make such an award if it is consideredto be the most effective mitigation against such a risk and if itis deemed to be in the long-term interests of the Company(and shareholders) to do soAny such awards would vest subject to continuingemployment and could have performance conditionsattaching to them should the Committee consider theseto be appropriateThe Committee has no plans to make any such awards atthis timeFigure 2: Key aspects of the remuneration policy for non-executive directorsChairman – FeesPurpose Maximum opportunity OperationTo attractand retain ahigh-calibrechairmanby offeringa marketcompetitivefee levelCurrent fee of chairman:£650,000The chairman is paid a single fee for all his responsibilitiesThe level of these fees is reviewed every two to three yearsby the Committee and chief executive, with reference to UKmarket levels (FTSE 30 companies) and a recommendationis then made to the Board (in the absence of the Chairman).The Chairman voluntarily waived the increase to his fee levelthat was due to take effect in August <strong>2012</strong>Fees are paid in cash with the flexibility to forgo all or partof the net fees in exchange for shares in the CompanyIn 2009 (on appointment) and in 2011 the Chairman wasgranted shares in the Company which he committed tomatch with his personal funds. These shares will be releasedafter three years subject to continued chairmanshipChairman – OtherbenefitsTo providemarketcompetitivebenefitsReasonable use of a car and driverMedical insuranceNon-executivedirectors – FeesTo attractand retainhigh-calibrenon-executivedirectors byofferingmarketcompetitivefeesBasic fee:£80,000 paAdditional fees:Senior Independent Director:£25,000 paCommittee chairman:£25,000 pa (except NominationCommittee chairman: £12,500)These fees will next be reviewedin December 2013The non-executives are paid a basic fee. The chairmen of themain board committees and the senior independent directorare paid an additional fee to reflect their extra responsibilitiesThese fee levels are reviewed every few years by theChairman and executive directors, with reference toUK market levels, and a recommendation is then madeto the BoardFees are paid in cash with the flexibility to forgo all or partof the net fees to acquire shares in the Company112 <strong>Anglo</strong> <strong>American</strong> plc <strong>Annual</strong> <strong>Report</strong> <strong>2012</strong>
2.2 Supplementary informationThe Company has additionalguidance for executive directors onshareholding targets and external andinternal directorships.Shareholding targetsWithin five years of appointment,executive directors are expected tohold Company shares with a valueof two times basic salary for thechief executive and one and a halftimes basic salary for other executivedirectors. The Committee takes intoconsideration achievement againstthese targets when making grantsunder the Company’s variouslong-term incentive plans.External directorshipsExecutive directors are not permittedto hold external directorships oroffices without the prior approval ofthe Board. If approved, they may eachretain the fees payable from only onesuch appointment.Internal directorshipsAny fees earned through internaldirectorships must be ceded tothe Company.In addition:• The remuneration provisionswithin the service contracts forCynthia Carroll and René Médoriare consistent with the policy outlinedin Figure 1 above and in Figure 4(termination provisions).• The remuneration arrangementsfor the executive directors outlinedin Figure 1 are consistent with thosefor other executives serving on theGroup Management Committee andthe Executive Committee, althoughopportunity levels vary.• The performance conditionsattaching to the longer-term incentivearrangements for executive directorswere chosen to ensure alignmentwith the Company’s strategicobjective of operating efficiency(AOSC – LTIP) and with the returnsbeing delivered to shareholders(TSR – LTIP) or the funding of thosereturns (real EPS growth – BSPEnhancement Shares).Figure 3: Executive director total remuneration atdifferent levels of performancePerformance LevelPerformance LevelChief ExecutiveAboveTargetBelowAboveTargetBelow£1.6mFinance Director£1.0m0 2.04.06.08.010.0Basic salaryBenefitsPensionBSP (cash)BSP (deferred shares)BSP (enhancement shares)LTIP£3.6m£5.1m£6.1mIndicative total pay (£m)£8.8mAboveThe Company’s three-year TSR would need to out-perform sectorpeers by 5% pa and be ranked 20th against the FTSE 100.TargetThe Company’s three-year TSR would need to out-perform sectorpeers by 2.5% pa and be ranked 35th against the FTSE 100.BelowTotal pay for below threshold performance includes basic salary,benefits and pension only.(1)Charts have not been included for the non-executive directors as their fees are fixed and do not varywith performance.(2)Share price movement and dividend accrual have been excluded from all figures.(3)Participation in the SAYE and SIP has been excluded given the relative size of the opportunity levels.(4)Total pay for above target performance comprises basic salary, benefits, pension, 100% of maximum bonusopportunity (50% of which is deferred into Bonus Shares), a 0.75 for 1 match of Enhancement Shares (100% ofmaximum) and 100% of maximum LTIP opportunity. For this level of pay, three-year EPS growth would need tobe RPI+15% or higher and the Company’s three-year TSR would need to out-perform sector peers by 5% pa andbe ranked 20th or higher against the FTSE 100.(5)Total pay for target performance comprises basic salary, benefits, pension, 65% of maximum bonus opportunity(50% of which is deferred into Bonus Shares), a 0.5 for 1 match of Enhancement Shares (i.e. 67% of maximum)and 65% of maximum LTIP opportunity. For this level of pay, three-year EPS growth would need to be RPI+11.4%,the Company’s three-year TSR would need to out-perform sector peers by 2.5% pa and be ranked 35th against theFTSE 100.(6)Total pay for below threshold performance comprises basic salary, benefits and pension only.2.3 Indicative totalremuneration levelsThe Company’s policy results in asignificant portion of remunerationreceived by executive directors beingdependent on Company performance.Figure 3 illustrates how the total payopportunities for the current chiefexecutive and the finance director varyunder three different performancescenarios: above, target and below.These charts are indicative as shareprice movement and dividend accrualhave been excluded. All assumptionsmade are noted below the charts.Governance<strong>Anglo</strong> <strong>American</strong> plc <strong>Annual</strong> <strong>Report</strong> <strong>2012</strong> 113
GOVERNANCE DIRECTORS’ REMUNERATION REPORT2.4 Service agreementsand termination2.4.1 Executive directorsCynthia Carroll and René Médori areemployed by <strong>Anglo</strong> <strong>American</strong> Services(UK) Ltd. The service agreements forboth can be terminated at 12 months’notice by either party, in line with theCompany’s policy that the period ofnotice for executive directors shouldnot exceed 12 months, except onappointment, when the Committeemay agree an extended Companynotice period only for the first yearfollowing appointment.Figure 4 sets out key provisionsrelating to termination of employmentfrom the executive directors’ serviceagreements and from the incentiveplan rules. It also sets out keyprovisions relating to change ofcontrol, where there is no termination.There are no provisions for enhancedpayments in the event of a change ofcontrol of the Company.2.4.2 Non-executive directorsAll non-executive directors haveletters of appointment with theCompany for an initial period ofthree years, subject to annualre-appointment at the AGM. TheChairman’s appointment may beterminated by the Company withsix months’ notice. The appointmentletters for the Chairman andnon-executive directors providethat no compensation is payableon termination, other than accruedfees and expenses.Figure 4: Executive director contractual provisions relating to termination of employmentand change of controlServiceagreementprovisionsrelating toterminationIncentive planprovisionsrelating toterminationSalary and benefitsThe period of notice for both executive directors is 12 months. Should CynthiaCarroll not be required to work her full notice, <strong>Anglo</strong> <strong>American</strong> Services is ableto discharge its liability for the unexpired portion of her notice period by makinga payment in lieu of her salary and other contractual benefits; in the case ofRené Médori, whose contract dates from 2005, the payment would also includea pro-rated bonusThe contracts of executive directors do not provide for liquidated damages<strong>Annual</strong> bonusFor the BSP, if an executive director ceases to be employed before the endof the year in respect of which the annual performance targets apply, then noaward will be made unless the Committee determines otherwise (taking intoaccount the proportion of the year for which the director was an employee ofthe Group and of performance to date against the annual performance targetsat the date of cessation)Bonus Shares and Enhancement SharesIf an executive director resigns voluntarily before the end of the three-yearvesting period:• Bonus Shares lapse• Enhancement Share awards are foregoneIf an executive director retires with the consent of the Committee, is maderedundant or is considered by the Committee to be a Good Leaver:• Bonus Shares already awarded will be transferred as soon as practicableafter the date of leaving• Enhancement Shares will vest only to the extent that the performancecondition has been met and will be pro-rated for the proportion of theperformance period for which the director servedLTIP awardsFor outstanding LTIP awards, the Committee would normally exercise itsdiscretion when an executive director’s employment ceases as follows:• If the director resigns voluntarily, then his/her interests lapse• If he/she retires with the consent of the Committee, is made redundant or isconsidered by the Committee to be a Good Leaver, vesting is based on thenormal performance criteria at the end of the normal performance period andthen pro-rated for the proportion of the performance period for which thedirector has served• The Committee retains flexibility to accelerate the vesting of outstandingawards on termination. In such circumstances vesting is based on the normalperformance criteria at the time of leaving and then pro-rated for theproportion of the performance period servedIncentive planprovisionsrelating tochange ofcontrol (withouttermination)Bonus Shares and Enhancement SharesThe Bonus Shares awarded under the BSP will be releasedThe Enhancement Shares awarded under the BSP will only vest to theextent that the performance condition has been met at the time of thechange of controlLTIP awardsThe number of shares that vest under the LTIP will be calculated by referenceto the extent to which the applicable performance conditions have been metat the time of the change of control114 <strong>Anglo</strong> <strong>American</strong> plc <strong>Annual</strong> <strong>Report</strong> <strong>2012</strong>
2.5 Development ofdirector remuneration policyIn developing and reviewing theCompany’s remuneration policyfor executive directors and othersenior executives, the Committee isreceptive to the views of shareholdersand sensitive to the relationshipbetween the arrangements forexecutive directors and those forother employee groups.Specifically:• Whenever any significant changesare made to remuneration, theCommittee seeks feedback frominvestors. The Committeealso listens to and takes intoconsideration investor viewsthroughout the year. For example,following investor feedback, theCommittee has decided, with effectfrom 2013, to withdraw the abilityof executive directors and otherexecutives to defer additionalamounts of bonus into shares andreceive correspondingly higherawards of Enhancement Shares;• The Committee considers thegeneral basic salary increasefor the broader UK employeepopulation when determining theannual salary increases for theexecutive directors. For <strong>2012</strong>and 2013, the rate of basic salaryincrease for the chief executiveand the finance director has beenthe same as or lower than thegeneral increase for the UKemployee population (at 4%and 0% respectively);• Each year the Committeealso reviews in detail how thearrangements for the executivedirectors compare to those forother members of the GroupManagement Committee andExecutive Committee to ensurean appropriate relationship andto support career developmentand succession.Figure 5: Terms of service – Executive directorsFigure 6: Terms of service – Non-executive directorsSir John ParkerChairman andChairman, NominationCommitteeDate of initialappointmentDate of initialappointmentNext AGM re-electionor electionCynthia Carroll Chief Executive 15 January 2007 n/aRené Médori Finance Director 01 June 2005 April 2013Next AGM re-electionor election09 July 2009 April 2013David ChallenSID and Chairman, 09 September 2002 April 2013Audit CommitteeSir CK Chow 15 April 2008 April 2013Sir Philip Hampton Chairman,RemunerationCommittee09 November 2009 April 2013Phuthuma Nhleko 09 March 2011 April 2013Ray O’Rourke 11 December 2009 April 2013Mamphela Ramphele (resigned <strong>2012</strong>) 25 April 2006 n/aAnne Stevens 14 May <strong>2012</strong> April 2013Jack Thompson 16 November 2009 April 2013Peter WoickeChairman,S&SD Committee(retiring 2013)01 January 2006 n/aGiven the geographic spread ofthe Company’s workforce, theCommittee does not consider thatconsulting with employees on theremuneration policy for directors isa viable use of resources. Many ofthe Company’s UK-based employeesare shareholders, through the SAYEand SIP schemes and they, like othershareholders, are able to expresstheir views on director remunerationat each general meeting.Governance<strong>Anglo</strong> <strong>American</strong> plc <strong>Annual</strong> <strong>Report</strong> <strong>2012</strong> 115
GOVERNANCE DIRECTORS’ REMUNERATION REPORT3. DIRECTOR REMUNERATIONIN <strong>2012</strong>The information set out in this sectionhas been subject to external audit.3.1 Basic salary for <strong>2012</strong>In <strong>2012</strong> basic salary increases forthe executive directors were limitedto an inflation adjustment in line withthe increase for the broader UKemployee population.Figure 7: Basic salaries for <strong>2012</strong>(all amounts in ’000)CYNTHIA CARROLL(2011: £1,170 – increase of 4% in <strong>2012</strong>)£1,217RENÉ MÉDORI(2011: £736 – increase of 4% in <strong>2012</strong>)£7653.2 <strong>Annual</strong> BSP outcomesfor <strong>2012</strong>Figures 8a and 8b outline the keyannual financial and strategicperformance measures for the <strong>2012</strong>Bonus Share Plan for Cynthia Carrolland René Médori, the level ofperformance achieved and resultingaward levels. Key aspects of theirperformance are also set out belowFigures 8a and 8b.Figure 9: BSP outcomes for <strong>2012</strong>(cash bonus and Bonus Shares)(all amounts in ’000)CYNTHIA CARROLL(2011: £1,925 – decrease of 61% in <strong>2012</strong>)£745RENÉ MÉDORI(2011: £1,198 – decrease of 61% in <strong>2012</strong>)£469Figure 8a: BSP performance assessment for <strong>2012</strong> – Chief ExecutiveChief Executive BSP measures Below Threshold Target AboveCynthia CarrollCorporate Financial (50%)Earnings per SharePersonal/Strategic (50%)Asset OptimisationOperating PerformanceProject ExecutionCorporate Strategy and Portfolio ManagementOrganisation and De Beers IntegrationCorporate CitizenshipGroup safety performance (deductor)Overall performanceResulting BSP award35% of maximum bonus (50% payable in cash, 50% as Bonus Shares)BSP KEY PERFORMANCEASPECTS• The weaker prices for theCompany’s main commoditiesimpacted the executive directors’ability to deliver the target earnings;EPS performance was below therequired threshold level.• Cynthia Carroll oversaw stronggroup action to meet weak marketconditions.• Two major projects – Kolomelaand Los Bronces – are due to reachfull production on or ahead ofschedule; Minas-Rio experienceda timetable delay and an increasein budget.• Strong progress was achievedin the Asset Optimisation andSupply Chain programmeswhich encourage businessimprovements.• Cynthia Carroll led key strategicacquisitions (De Beers andRevuboè).• Implemented changes in seniormanagement in the businessesin South Africa to continueimprovements in performanceand safety.• Continued progress achieved inthe drive for safety improvement.116 <strong>Anglo</strong> <strong>American</strong> plc <strong>Annual</strong> <strong>Report</strong> <strong>2012</strong>
Figure 8b: BSP performance assessment for <strong>2012</strong> – Finance DirectorFinance Director BSP measures Below Threshold Target AboveRené MédoriCorporate Financial (50%)Earnings per SharePersonal/Strategic (50%)Treasury and TaxStrategy and Portfolio RestructuringProcurementInformation ManagementFinance Function operational targetsTeamworkProject SupportGroup safety performance (deductor)Overall performanceResulting BSP award35% of maximum bonus (50% payable in cash, 50% as Bonus Shares)BSP KEY PERFORMANCEASPECTS• The weaker prices for theCompany’s main commoditiesimpacted the executive directors’ability to deliver the target earnings;EPS performance was below therequired threshold level.• René Médori oversaw theissuance of corporate bonds with aUS$ equivalent value of $5.1 billionin the US, European and SouthAfrican markets increasing debtheadroom and extending maturity.In addition, 99% of the Group’s$1.7 billion convertible bonds wereconverted into equity, reducing netdebt and interest.• <strong>Anglo</strong> <strong>American</strong>’s divestmentprogramme, as set out in October2009, was successfully completedraising $4.0 billion of cumulativeproceeds on a debt and cashfree basis.• Strong progress was achievedin the Supply Chain programmewhich drives sustained businessimprovement.• Two major projects – Kolomelaand Los Bronces – are due to reachfull production on or ahead ofschedule. Minas-Rio experienceda timetable delay and an increasein budget.• Continued progress achieved inthe drive for safety improvement.3.3 BSP EnhancementShare outcomes for <strong>2012</strong>In 2010 Cynthia Carroll and RenéMédori were awarded EnhancementShares under the BSP. Vesting wassubject to the Company’s real EPSgrowth over the three-year periodto 31 December <strong>2012</strong>. The fall incommodity prices in <strong>2012</strong> – the finalyear of the performance period –impacted the Company’s EPS growthand as a consequence no shareswill vest.Figure 10: Enhancement Sharevesting outcomes for <strong>2012</strong>(all amounts in ’000)CYNTHIA CARROLL(2011: £1,570 )£0RENÉ MÉDORI(2011: £1,023)£0Governance<strong>Anglo</strong> <strong>American</strong> plc <strong>Annual</strong> <strong>Report</strong> <strong>2012</strong> 117
GOVERNANCE DIRECTORS’ REMUNERATION REPORT3.4 Long term incentiveplan outcomes for <strong>2012</strong>In 2010 Cynthia Carroll and RenéMédori received LTIP grants withvesting subject to (a) the Company’sTSR performance relative to (i) aweighted group of internationalmining companies and (ii) FTSE 100companies over the three-yearperiod to announcement of the <strong>2012</strong>results, and (b) the level of savingsdelivered by the Asset Optimisationand Supply Chain programmes to31 December <strong>2012</strong>.Figure 11 sets out further details ofthe measures, the Company’sperformance against each and theassumed outcomes for each executivedirector. As the performance period forthe TSR measures ends immediatelyafter the date of this report on theannouncement of the <strong>2012</strong> results,performance and vesting in respectof the TSR measures is based on thelatest available information as at31 December <strong>2012</strong>.Figure 12: LTIP vestingoutcomes for <strong>2012</strong>(all amounts in 000)CYNTHIA CARROLL(2011: £3,056 – decrease of 74% in <strong>2012</strong>)£802RENÉ MÉDORI(2011: £1,921 – decrease of 74% in <strong>2012</strong>)£504Figure 11: LTIP assessment for <strong>2012</strong>For more details on the measuresgo to section 4.3SECTOR INDEX COMPARISON(25% OF TOTAL AWARD)• The Sector Index measurecompares the Company’sthree-year TSR performancewith the weighted median of sixinternational mining companies(94%) and four industrial mineralcompanies (6%).• Vesting required the Company’sTSR performance to be at leastequal to the weighted median.• As at 31 December <strong>2012</strong> theCompany’s TSR performancewas below the weighted median(at -13%); it is therefore notexpected that any shares will vestfor this part of the award.FTSE 100 COMPARISON(25% OF TOTAL AWARD)• The FTSE 100 measure comparesthe Company’s three-year TSRperformance with the constituentsof the FTSE 100.• Vesting required the Company’sTSR to be at least equal to themedian TSR of the FTSE 100.• As at 31 December <strong>2012</strong> theCompany’s TSR performancewas ranked below the 50thpercentile of the FTSE 100; it istherefore expected that no sharesfor this part of the award will vest.AOSC (50% OF TOTAL AWARD)• The AOSC measure rewardsthe delivery of additional operatingprofit and capital expendituresavings delivered through theCompany’s Asset Optimisationand Supply Chain programmes.• Minimum vesting requiredcumulative savings to 31 December<strong>2012</strong> of $5.13bn and maximumvesting required savings of$6.27bn.• Actual performance was above themaximum target, leading to fullvesting of this part of the award.3-year TSR performanceagainst weighted sector median% per annumVesting (% of total LTIP award)50%25%7.5%Zerovestingassumed0%Threshold: 0% pa Max: 5% paVesting schedule and performanceto 31 December <strong>2012</strong>Arrow represents expected vesting3-year TSR rankingvs FTSE 100 indexVesting (% of total LTIP award)50%25%7.5%Zerovestingassumed0%Threshold: 50thArrow represents expected vestingMax: 80thVesting schedule and performanceto 31 December <strong>2012</strong><strong>Anglo</strong> <strong>American</strong>’s AOSC efficiency($bn)Vesting (% of total LTIP award)50%0%Min: $5.13bnMax: $6.27bnVesting schedule andactual performanceArrow represents expected vestingFull vestingof 50% ofawards118 <strong>Anglo</strong> <strong>American</strong> plc <strong>Annual</strong> <strong>Report</strong> <strong>2012</strong>
LTIP KEY PERFORMANCEASPECTS• During <strong>2012</strong>, the Companyhas continued to focus oninfluencing behaviours necessaryfor delivering AOSC benefitsacross businesses.Operation reviews wereperformed at sites acrossCopper, Platinum, De Beers andPhosphates businesses to buildon work done since 2010 toidentify and prioritise businessimprovement opportunities.Improved relationships withsuppliers have resulted inminimised lead times for majorequipment delivery and supplyrisk to our business.Framework agreements arenow in place with 38 of our keysuppliers representing a formalalignment in our commercialrelationship.• As at 31 December <strong>2012</strong>, theCompany achieved a TSR overthe 2010 LTIP performanceperiod of -13% which wouldgenerate a nil vesting in termsof the Sector Index (against amedian target of 7%) and a nilvesting against the FTSE 100(being lower than the 50thpercentile).The actual performance periodfor both TSR measures endsimmediately after the date ofthis report.• If the 2010 LTIP awards vestat 50%, 43,791 shares arereceivable by Cynthia Carrolland 27,520 by René Médori.At a share price of £18.32 (theaverage for the last quarter of<strong>2012</strong>), this results in valuesof £802,251 and £504,166respectively.3.5 Total remunerationoutcomes for <strong>2012</strong>Figure 13 sets out the totalremuneration received or receivableby the directors in respect of <strong>2012</strong>(or the three-year performanceperiod ending in <strong>2012</strong> for each ofthe BSP Enhancement Shares andLTIP awards from 2010).Figure 13: Total remuneration outcomes for <strong>2012</strong>Total basicsalary (1)£’000Benefitsin kind (2)£’000Pension (3)£’000<strong>Annual</strong>performancebonus – cash& BonusShares£’0002010EnhancementShare Award (4)£’0002010LTIPAward (5)£’000ExecutiveDirectors Section 3.1 Section 3.2 Section 3.3 Section 3.4Total<strong>2012</strong> (6)£’000Cynthia Carroll 1,217 65 365 745 0 802 3,194Total2011 (6)£’000Cynthia Carroll 1,170 42 351 1,925 1,570 3,056 8,114(2011)René Médori 765 50 230 469 0 504 2,018René Médori(2011)736 33 221 1,198 1,023 1,921 5,132Total fees£’000Benefitsin kind£’000Pension£’000<strong>Annual</strong>performancebonus – cash& BonusShares£’0002010EnhancementShare Award£’000Other (8)£’000Total<strong>2012</strong>£’000Total2011£’000Non-Executive DirectorsSir John Parker (7) 650 2 – – – 589 1,241 650David Challen 130 – – – – – 130 115Sir CK Chow 80 – – – – – 80 80Sir Philip Hampton 105 – – – – – 105 95Phuthuma Nhleko 80 – – – – – 80 65Ray O’Rourke (7) 80 – – – – – 80 80Mamphela Ramphele 46 – – – – – 46 80Anne Stevens 51 – – – – – 51 –Jack Thompson 80 – – – – – 80 80Peter Woicke 105 – – – – – 105 95(1)In addition to the basic salaries above, Cynthia Carroll and René Médori each retained fees amounting to £98,000 and £92,000 respectively inrespect of external directorships (see 2.2).(2)Each executive director receives a car allowance, a limited amount of personal taxation or financial advice and one club subscription; they alsoreceive death and disability benefits and medical insurance, access to a company car and driver as required and other ancillary benefits. <strong>2012</strong>benefits also include attendance at relevant public events.(3)The pension contribution amounts should be read in conjunction with the following information:(a) The amount stated for Cynthia Carroll for 2011 includes a cash allowance of £8,000.(b) The total amount of pension contributions treated as having been paid into the UURBS for <strong>2012</strong> was £315,000 for Cynthia Carroll(2011: £308,000) and £190,000 for René Médori (2011: £537,000).(c) Contributions treated as being paid into the UURBS earn a return equivalent to the Company’s pre-tax sterling nominal cost of debt. The totalreturn earned in <strong>2012</strong> was £24,000 for Cynthia Carroll (2011: £4,000) and £33,000 for René Médori (2011: £8,000).(d) As at 31 December <strong>2012</strong>, the total balances due to the executive directors in relation to the UURBS were £651,000 for Cynthia Carroll(2011: £312,000) and £768,000 for René Médori (2011: £545,000).(4)The performance condition attached to the 2010 Enhancement Share award was not met and no shares will vest.(5)As vesting of the LTIP awards granted in 2010 is due to take place after publication of this report, vesting levels are on an ‘expected’ basis anda share price of £18.32 has been used to calculate the values shown.(6)The total emoluments for <strong>2012</strong> (that is basic salary, cash bonuses and benefits (excluding pension)) were £1,655,000 for Cynthia Carroll(2011: £2,174,000) and £1,050,000 for René Médori (2011: £1,369,000).(7)Sir John Parker has waived his Nomination Committee Chairman fees. Ray O’Rourke has instructed the Company that his net fees bedonated to charity.(8)Following his appointment as chairman of the Company on 1 August 2009, Sir John Parker was awarded 31,000 shares which were releasedin full on 2 August <strong>2012</strong>, three years after appointment, with a share price of £19.00. The award was matched by Sir John before the release date.(9)No person who served as a director of the Company during or before <strong>2012</strong> has been paid or received retirement benefits in excess of theretirement benefits to which he/she was entitled on the date on which benefits first became payable (or 31 March 1997, whichever is later).(10)No consideration was paid to or became receivable by third parties for making available the services of any person as a director of the Company,or while a director of the Company, as a director of any of the Company’s subsidiary undertakings, or as a director of any other undertaking ofwhich he/she was (while a director of the Company) a director by virtue of the Company’s nomination, or otherwise in connection with themanagement of the Company or any undertaking during the year to 31 December <strong>2012</strong>.Governance<strong>Anglo</strong> <strong>American</strong> plc <strong>Annual</strong> <strong>Report</strong> <strong>2012</strong> 119
GOVERNANCE DIRECTORS’ REMUNERATION REPORT3.6 Distribution statementfor <strong>2012</strong>Figure 14 sets out the total spendon employee reward over <strong>2012</strong>compared to profit generated by theCompany and the dividends receivedby investors.Figure 14: Distribution statement for <strong>2012</strong>Distribution statement <strong>2012</strong> 2011Underlying Earnings$m 2,839 6,120(Total Group)% change (54)% 23%Dividends payable for year (Total) $m 1,087 898% change 21% 13%Payroll costs for all employees $m 5,387 4,946% change 9% 9%Employee numbers ’000 106 100% change 6% 0%4. OUTSTANDING SHAREINTERESTSThe information in this section hasbeen subject to external audit.4.1 Conditional share awardsgranted in <strong>2012</strong>Figure 15 summarises the longer-term,share-based awards granted todirectors during <strong>2012</strong>. Receipt ofthese awards is dependent on theCompany’s performance over<strong>2012</strong>–2014, as detailed below.4.2 Details of BSP EnhancementShares granted in <strong>2012</strong>• Vesting of the BSP EnhancementShares granted in <strong>2012</strong> is subject toreal EPS growth, ie growth in theCompany’s earnings per sharecompared to growth in the UK RetailPrice Index, over three years to31 December 2014.• The performance targets and vestingoutcomes are illustrated in Figure 16.• The performance targets wereapproved by the Committee afterreviewing external expectations andperformance over a number of yearsand have been set at a level thatprovides stretching performancelevels for management.Figure 16: <strong>2012</strong> BSPEnhancement SharesVesting (% of Enhancement Shares)100%44%0%RPI+9% RPI+15%<strong>Anglo</strong> <strong>American</strong>’s 3-yearEPS growth (%)Figure 15: Summary of conditional share awards granted in <strong>2012</strong>Type of awardBSPEnhancementShares (1)LTIP shareawardsPerformancemeasureEPS growthSection 4.2TSR vs.sector index(25%)Section 4.3.1TSR vs.FTSE 100index (25%)Section 4.3.2AOSC (50%)Section 4.3.3Vesting schedule44% for RPI+9%100% for RPI+15%30% for TSRequal to median100% for median+5% pa or above30% for TSRequal to median100% for 80thcentile or above0% for $4.6bn100% for $5.6bnPerformanceperiod end (2) Director Basis of award31/12/2014 Cynthia Carroll 75% of 2011Bonus SharesRené Médori 75% of 2011Bonus SharesNumber ofshares awardedFace valueat grant (3)26,573 £721,72316,538 £449,17231/12/2014 Cynthia Carroll 350% of salary 157,733 £4,258,791René Médori 300% of salary 85,048 £2,296,296(1)The BSP Enhancement Shares were awarded in March <strong>2012</strong>. The number of shares granted was 75% of the number of deferred Bonus Shares awarded to each executive director in respect of 2011 annualperformance (Cynthia Carroll: 35,431 Bonus Shares; René Médori: 22,051 Bonus Shares). The value of each Bonus Share award was 50% of the total bonus earned for 2011.(2)The performance period for the LTIP TSR measures is three years ending on the day of the announcement of the 2014 financial results in 2015.(3)The face value of each award has been calculated using the share price at time of grant (£27.16 for the Enhancement Share awards and £27.00 for the LTIP awards). As receipt of these awards is conditional onperformance, the actual value of these awards may be £0. Vesting outcomes will be disclosed in the 2014 report.120 <strong>Anglo</strong> <strong>American</strong> plc <strong>Annual</strong> <strong>Report</strong> <strong>2012</strong>
4.3 Details of LTIP awardsgranted in <strong>2012</strong>4.3.1 TSR – Sector Indexcomparison• One quarter of the LTIP awardsgranted in <strong>2012</strong> vests according tothe Company’s three-year TSRperformance relative to a weightedbasket of international miningcompanies (the Sector Index).• The constituent companies of theSector Index for the <strong>2012</strong> awardsare shown in Figure 17a.• The Committee may amend thelist of comparator companies inthe Sector Index, and relativeweightings, if circumstances makethis necessary (for example, as aresult of takeovers or mergersof comparator companies orsignificant changes in thecomposition of the Group).• The Sector Index performancetargets and the vesting schedulefor the <strong>2012</strong> LTIP awards aresummarised in Figure 17b.• Target performance for theCompany requires the Company’sthree-year TSR to equal theweighted median TSR performanceof the Sector Index.• Maximum vesting occurs when theCompany’s TSR outperforms theweighted median TSR of the SectorIndex by 5% pa.Figure 17b: <strong>2012</strong> LTIP SectorIndex comparison(25% of total LTIP award)Vesting (% of LTIP Sector Index)100%30%0%Threshold: 0% pa Max: 5% pa<strong>Anglo</strong> <strong>American</strong>’s 3-yearTSR out-performance of weighted sector median4.3.2 TSR – FTSE 100 comparison• One quarter of the LTIP awardsgranted in <strong>2012</strong> vests accordingto the Company’s three-year TSRperformance compared with theTSR performance of the constituentsof the FTSE 100 Index.• The FTSE 100 performancetargets and vesting schedule forthe <strong>2012</strong> LTIP awards are outlinedin Figure 18.The performance targets for bothTSR measures were calculated sothat there is approximately a 15%chance of achieving full vestingand a 25% chance of three-quartersvesting. These probabilities wereassessed by PwC using a MonteCarlo model.Figure 18: <strong>2012</strong> LTIPFTSE 100 comparison(25% of total LTIP award)Vesting (% of LTIP FTSE 100)100%30%0%Threshold: 50th Max: 80th<strong>Anglo</strong> <strong>American</strong>’s 3-yearTSR ranking vs FTSE 100 indexFigure 19: <strong>2012</strong> LTIPAOSC measure(50% of total LTIP award)0%Min: $4.6bnMax: $5.6bn<strong>Anglo</strong> <strong>American</strong>’s 3-yearAOSC savings ($bn)Vesting (% of total AOSC measure) 100%GovernanceFigure 17a: <strong>2012</strong> TSRSector IndexComparatorcompaniesMiningBHP Billiton plcTotal shareholder return for both theTSR measures is calculated basedon average returns over the fiveworking days immediately followingannouncement of the Company’sannual results. It is assumed that alldividends are reinvested.Rio Tinto plcTeck ComincoLimitedValeVedantaResources plcXstrata plc<strong>Anglo</strong> <strong>American</strong> plc <strong>Annual</strong> <strong>Report</strong> <strong>2012</strong> 121
GOVERNANCE DIRECTORS’ REMUNERATION REPORT4.3.3 Asset Optimisationand Supply Chain• Vesting of one half of LTIP awardsgranted in <strong>2012</strong> depends on theperformance of the Company’sstrategic Asset Optimisation andSupply Chain (AOSC) programmesover the three-year period to31 December 2014.• These programmes strive to unlockvalue from the Company’s assetsin a sustainable way throughstructured Group-wide programmesaimed at reducing costs, increasingvolumes and improving overalloperational efficiencies.• The AOSC performance targetsrepresent the operating and capitalexpenditure savings that theprogramme is yielding, comparedwith the savings made if theprogramme had not beenimplemented. These savings arerealised cumulatively over thethree-year performance period.• For 2011 LTIP awards onwards,the effect of changes in bothcommodity prices and exchangerates have been stripped out of theAOSC targets and results so that onlydirectly attributable managementactions are recognised.• The AOSC targets and vestingschedule for the <strong>2012</strong> LTIP awardsare shown in Figure 19.• The Committee reviews theAOSC targets prior to each LTIPaward to ensure they remainappropriately stretching and thebenefits delivered are significantto the Company.• At the end of each performanceperiod, the assessment ofperformance against targets isreviewed by internal audit andreported to shareholders.• Figure 20 shows an exampleof AOSC improvements atMetallurgical Coal.Figure 20: Asset Optimisation and Supply ChainAt our Metallurgical Coal BusinessUnit, we set out to focus on improvingequipment performance which isdriven by rate, availability andutilisation of our fleet at open cutmines. Effective work area setupwas the key to rate improvements,whilst utilisation improvementsincrease the productive time thatequipment operates throughreducing non-value adding activities.Benchmarking best practiceequipment performance hassupported identification of the gapsand valuing the improvement.Open cut saleable AO benefitsMt – <strong>Anglo</strong> share15.6<strong>2012</strong> withoutAO (2010–<strong>2012</strong>)0.52010 AO(Figures are not subject to external audit)By improving the rate, availabilityand utilisation of our equipment,moretonnes are moved for processingand ultimately available for sale toour customers. Our equipmentperformance benefit is calculatedon the improvement in controllablevariables (which could be availabilityand/or utilisation and/or rate) againstactual performance in the previousyear, whilst all other variables are0.32011AOImprovements are ‘locked in’ to theOperational Management Systemwhich defines the practices andprocesses by which our MetallurgicalCoal sites operate, both from a mineplanning perspective as well as anoperational perspective.This approach was rolled out inMetallurgical Coal in 2008 and isdelivering benefits.1.1<strong>2012</strong> AO17.5<strong>2012</strong> with AO benefit(2010–<strong>2012</strong>)treated as uncontrollable and thusexcluded from the benefit calculation.The additional material moved ismultiplied by the strip ratio to provideadditional run of mine tonnes. Therun of mine tonnes are multiplied bythe yield achieved in the processingplant to deliver additional saleableproduction. Any incremental costsare deducted from the additionalrevenue generated.122 <strong>Anglo</strong> <strong>American</strong> plc <strong>Annual</strong> <strong>Report</strong> <strong>2012</strong>
4.4 Total interests in sharesFigure 21 summarises the totalinterests of the directors in shares of<strong>Anglo</strong> <strong>American</strong> plc as 14 February2013 (and at the end of the <strong>2012</strong>financial year). These includebeneficial and conditional interests.As already disclosed, Cynthia Carrollis required to hold interests in sharesto a value of two times basic salaryand René Médori to a value of oneand a half times salary. Theserequirements have been exceeded.GovernanceFigure 21: Shares in <strong>Anglo</strong> <strong>American</strong> plcDirectorsBeneficialBSPBonus SharesConditionalBSPEnhancementShares (5) LTIP (6) SAYE/SIP (7) Otherat 14 February 2013 200,511 101,524 90,565 373,323 494 –Cynthia Carroll(at 31 December <strong>2012</strong>) 200,488 101,524 90,565 373,323 491 –at 14 February 2013 86,684 63,094 56,385 209,109 494 –René Médori (1) (at 31 December <strong>2012</strong>) 86,662 63,094 56,385 209,109 492 –at 14 February 2013 50,303 – – – – 7,552Sir John Parker (2) (at 31 December <strong>2012</strong>) 50,303 – – – – 7,552David ChallenSir CK ChowSir Philip HamptonPhuthuma Nhlekoat 14 February 2013 1,820 – – – – –(at 31 December <strong>2012</strong>) 1,820 – – – – –at 14 February 2013 5,500 – – – – –(at 31 December <strong>2012</strong>) 5,500 – – – – –at 14 February 2013 3,462 – – – – –(at 31 December <strong>2012</strong>) 3,127 – – – – –at 14 February 2013 3,151 – – – – –(at 31 December <strong>2012</strong>) 2,412 – – – – –at 14 February 2013 76,965 – – – – –Ray O’Rourke (3) (at 31 December <strong>2012</strong>) 76,965 – – – – –at 14 February 2013 7,100 – – – – –Jack Thompson (3) (at 31 December <strong>2012</strong>) 7,100 – – – – –Anne Stevens (4) at 14 February 2013 1,332 – – – – –(at 31 December <strong>2012</strong>) 621 – – – – –Peter Woicke (3) at 14 February 2013 20,806 – – – – –(at 31 December <strong>2012</strong>) 19,898 – – – – –(1)René Médori’s beneficial interests in 85,613 shares held at the date of this report arise as a result of his wife’s interests in shares.(2)As previously reported, Sir John Parker was awarded 7,552 shares in the Company on 28 February 2011, which will be released in full on the third anniversary of the award date, subject to his continuedchairmanship. The award will be matched by Sir John progressively over the three-year period.(3)Included in the interests of Messrs O’Rourke, Thompson and Woicke are unsponsored ADR representing 0.5 ordinary shares of $0.54945 each.(4)Anne Stevens was appointed to the Board on 14 May <strong>2012</strong>.Footnotes continue overleaf<strong>Anglo</strong> <strong>American</strong> plc <strong>Annual</strong> <strong>Report</strong> <strong>2012</strong> 123
GOVERNANCE DIRECTORS’ REMUNERATION REPORT(5)Figure 22 records in more detail the changes in conditional interests in BSP Bonus Shares and Enhancement Shares over <strong>2012</strong>. The Enhancement Share awards that vested in <strong>2012</strong> related to theperformance period 2009–2011. They were awarded on 18 March 2009 at a share price of £11.62. They vested on 6 March <strong>2012</strong> at a price of £25.42.Figure 22: Bonus Share Plan interestsNumber ofNumber of Enhancement Number of Number of Number ofEnd date ofperformanceBonus Shares Shares Bonus Enhancement EnhancementDate period forBSP interestsTotalinterest at1 January<strong>2012</strong>conditionallyawardedin March<strong>2012</strong>conditionallyawardedin March<strong>2012</strong>Sharesvestedin March<strong>2012</strong>Sharesvestedin March<strong>2012</strong>Shareslapsedin March<strong>2012</strong>Totalinterest at31 December<strong>2012</strong>Market priceat date of<strong>2012</strong> award£of vesting ofBonus Sharesawardedduring <strong>2012</strong>EnhancementSharesawardedduring <strong>2012</strong>Cynthia Carroll 240,420 35,431 26,573 (48,580) (61,755) – 192,089 27.16 01/01/2015 31/12/2014René Médori 152,812 22,051 16,538 (31,667) (40,255) – 119,479 27.16 01/01/2015 31/12/2014(6)Figure 23 records in more detail the changes in conditional interests in LTIP awards during <strong>2012</strong>. The LTIP awards that vested in <strong>2012</strong> related to the performance period 2009–2011.They were awarded on 30 March 2009 at a share price of £12.61. They vested on 12 March <strong>2012</strong> at a price of £26.00.Figure 23: Long Term Incentive Plan interestsLTIP interestsTotalbeneficialinterest inLTIP at1 January<strong>2012</strong>Number ofsharesconditionallyawardedin March<strong>2012</strong>Numberof sharesvestedin March<strong>2012</strong>Numberof shareslapsedin March<strong>2012</strong>Total beneficialinterest in LTIP at31 December <strong>2012</strong>Market priceat date of<strong>2012</strong> award £Date of vestingof LTIP awardedduring <strong>2012</strong>Cynthia Carroll 337,992 157,733 (117,505) (4,897) 373,323 27.00 31/12/2014René Médori 200,999 85,048 (73,860) (3,078) 209,109 27.00 31/12/2014(7)Figure 24 records in more detail the changes in conditional interests in Share Incentive Plan (SIP) interests during <strong>2012</strong>.Figure 24: Share Incentive Plan interestsNumber ofMatching Sharesconditionallyawardedduring <strong>2012</strong>Number ofFree Sharesconditionallyawardedduring <strong>2012</strong>Number ofFree Sharesvestedduring <strong>2012</strong>SIP interestsTotal interestat 1 January<strong>2012</strong>Number ofMatching Sharesvested during <strong>2012</strong>Total interest at31 December <strong>2012</strong>Cynthia Carroll 696 70 116 (90) (301) 491René Médori 695 71 116 (89) (301) 492During the year, Cynthia Carroll and René Médori purchased 70 and 71 shares under the SIP respectively, in addition to the shares held by them at 1 January <strong>2012</strong>. If these shares are held for three years, they willbe matched by the Company on a one-for-one basis, conditional upon the director’s continued employment. In addition, Cynthia Carroll and René Médori were each awarded 116 free shares under the SIP inMarch <strong>2012</strong>. Participants in the SIP are entitled to receive dividends on their shares.Figure 25 records in more detail the changes in conditional interests in SAYE awards during <strong>2012</strong>.Figure 25: Directors’ share options (SAYE)<strong>Anglo</strong> <strong>American</strong> optionsBeneficialholding at1 January<strong>2012</strong> Granted Exercised LapsedBeneficialholding at31 December<strong>2012</strong>Weighted averageoption price £Earliest date fromwhich exercisableLatestexpiry dateRené Médori 1,587 – – – 1,587 20.98 01/09/2013 28/02/2019124 <strong>Anglo</strong> <strong>American</strong> plc <strong>Annual</strong> <strong>Report</strong> <strong>2012</strong>
5. CHIEF EXECUTIVEARRANGEMENTS5.1 Appointment of newchief executiveMark Cutifani’s remunerationpackage will comprise a basic salaryand variable incentive arrangementswhich are entirely in line with<strong>Anglo</strong> <strong>American</strong>’s currentremuneration policy and practice.The key elements of the packageare as follows:• Basic salary – £1.2m per annum.• Bonus Share Plan (BSP) –Mr Cutifani will have the opportunityto participate in <strong>Anglo</strong> <strong>American</strong>’sannual incentive arrangements (theBSP) for 2013 in line with the policyset out on page 110.• Long Term Incentive Plan (LTIP) –Mr Cutifani will be eligible for anannual award under the LTIP in linewith the policy set out on page 110.• Compensation for incentivesforfeited – Mr Cutifani will receivean award of restricted shares tocompensate him for the loss ofincentives from his previousemployer <strong>Anglo</strong>Gold Ashanti (AGA).The Committee has decided that,so far as possible, the compensatoryawards should be on a comparablebasis to the foregone awards. Assuch, the Company commissioneda third-party valuation to determinethe extent to which the performanceconditions were, at the date ofassessment, likely to be achieved.Based on the AGA share priceand exchange rates at the date ofthis report, the total value of thecompensatory award is c. £2.29m;this figure will be updated at thetime of Mr Cutifani’s joining <strong>Anglo</strong><strong>American</strong>, once the value of theshares foregone under the 2013 AGABonus Share Plan award (based onperformance during <strong>2012</strong>) is known,using the average share price andexchange rates over the week priorto that event.In order to enhance alignment withthe interests of <strong>Anglo</strong> <strong>American</strong>shareholders, the Committee hastaken the decision to utilise <strong>Anglo</strong><strong>American</strong> shares, rather than cash,as the medium for compensation.These restricted shares will vest overthe next three years, in line with thevesting schedule of the incentivesforegone. They will be subject toclawback in the event of Mr Cutifani’sleaving the Company (exceptas a Good Leaver) or in thecircumstances in which theCompany’s standard clawbackprovisions are triggered.• Shareholding requirements –Mr Cutifani will be required toaccumulate a shareholding in<strong>Anglo</strong> <strong>American</strong> to the value oftwo times basic salary within fiveyears of his appointment.• Pension – <strong>Anglo</strong> <strong>American</strong> will makean annual contribution of 30% ofbasic salary in respect of Mr Cutifani’spension provision which maybe invested into the Company’spension arrangements or takenas a cash allowance.• Notice Period – The notice period inMr Cutifani’s service contract will be12 months for either party save that,should the Company serve noticebefore the first anniversary of hisappointment, it will be 18 months.5.2 Termination arrangementsfor outgoing chief executiveIn terms of her leaving arrangements,Cynthia Carroll will receive phasedmonthly payments, comprising basicsalary and benefits, for the outstandingnine months of her notice period, in linewith her contractual provisions. Thesepayments will be subject to mitigation.The Committee has determined thatCynthia Carroll will be eligible forconsideration for a BSP award for2013 in respect of the period she willhave served. However, there will be noaward of Enhancement Shares or anyaward under the LTIP in 2013.The Bonus Shares held byCynthia Carroll will be releasedto her on termination.With respect to the EnhancementShare and LTIP awards made in2011 and <strong>2012</strong>, the Committee hasdetermined that these awards will veston the normal vesting dates, to theextent that the performance conditionshave been satisfied, and will bepro-rated for the proportion ofeach performance period served.Full details of any amounts paid toCynthia Carroll will be disclosed in the2013 Directors’ Remuneration <strong>Report</strong>.Governance<strong>Anglo</strong> <strong>American</strong> plc <strong>Annual</strong> <strong>Report</strong> <strong>2012</strong> 125
GOVERNANCE DIRECTORS’ REMUNERATION REPORTCOMMITTEEMEMBERSDURING <strong>2012</strong>Sir Philip Hampton6. REMUNERATION COMMITTEEIN <strong>2012</strong>MembershipThe Committee comprised thenon-executive directors shownon the left during the year ended31 December <strong>2012</strong>.Committee members during <strong>2012</strong>The Company’s chief executiveattends the Committee meetings byinvitation and assists the Committeein its deliberations, except when issuesrelating to her own compensation arediscussed. No directors are involvedin deciding their own remuneration.In <strong>2012</strong>, the Committee was advised bythe Company’s Human Resources andFinance functions and, specifically, byMervyn Walker and Chris Corrin. It alsotook external advice as shown in thetable below.Figure 25: External advisers and feesDavid ChallenSir CK ChowAdvisersPricewaterhouseCoopersLLP (PwC)Linklaters LLP(Linklaters)Appointed by the Company,with the agreement of theCommittee, to provide specialistvaluation services and marketremuneration dataAppointed by the Company,with the agreement of theCommittee, to providelegal advice on long-termincentives and directors’service contractsOther services providedto the CompanyInvestment advisers,actuaries and auditorsfor various pensionschemes; advisers oninternal audit projects;taxation, payroll andexecutive compensationadviceLegal advice on certaincorporate mattersFees for Committeeassistance£9,000£5,000Jack ThompsonMercer Limited(Mercer)Engaged by the Committee toreview the Committee’sprocesses on an annual basis,in order to provide shareholderswith assurance that theremuneration processes theCommittee has followed are inline with stated policy and thatthe Committee has operatedwithin its Terms of ReferenceInvestment advisers andactuaries for variouspension schemes£11,000Peter WoickeThis review was carried out onthe 2011 report although will notbe done going forwardTowers Watson(TW)The Human Resources functionengaged Towers Watson toassist with the preparation of the<strong>2012</strong> remuneration reportHuman resourcesadvisers on variousreward and other matters£25,000Deloitte LLP(Deloitte)In their capacity as Groupauditors, Deloitte undertake anaudit of sections 3 and 4 of theremuneration report annually.However, they provide no adviceto the Committeen/aNote: Certain overseas operations within the Group are also provided with audit related services from Deloitte’s and PwC’s worldwide member firmsand non-audit related services from Mercer’s worldwide member firms and TW.126 <strong>Anglo</strong> <strong>American</strong> plc <strong>Annual</strong> <strong>Report</strong> <strong>2012</strong>
Figure 26: Response to <strong>2012</strong> AGM shareholder votingNumber of votesVote For Against Abstain Any issues raised and Company responseAdvisoryvote on 2011remunerationreport716,506,271(87%)110,627,621(13%)14,065,303 Comments from investorsat the time of the <strong>2012</strong> AGMhave led to enhanceddisclosure relating to bonusesFIGURE 27: HISTORICALCOMPARATIVE TSRPERFORMANCE GRAPHS140120100807. OTHER INFORMATIONREQUIREDThe information included in thissection has been included to ensurecompliance with the Company’scurrent disclosure obligationsunder the Large and Medium SizedCompanies and Groups (Accountsand <strong>Report</strong>s) Regulations 2008 (theRegulations). This information is notexpected to be required under therevised version of the Regulationswhich will apply to the 2013 Directors’Remuneration <strong>Report</strong>.7.1 Five-year relative TSR graphsThe top chart in Figure 27 shows theCompany’s TSR performance againstthe performance of the FTSE 100Index from 1 December 2008 to31 December <strong>2012</strong>. The FTSE 100Index was chosen as being a broadequity market index which includescompanies of a comparable size andcomplexity to <strong>Anglo</strong> <strong>American</strong>.The bottom chart in Figure 27 showsthe Company’s performance againsta weighted Sector Index comparatorgroup over the same five-year period.The Sector Index comparator groupis the same as used to measure theCompany’s performance for thepurposes of the vesting of LTIPinterests conditionally awarded in2010. This graph gives an indicationof how the Company is performingagainst the targets in place for LTIPinterests already granted, although thespecifics of the comparator companiesfor each year’s interests may vary toreflect changes such as mergers andacquisitions among the Company’scompetitors or changes to theCompany’s business mix.TSR is calculated in US dollars,and assumes all dividends arereinvested. The TSR level shownas at 31 December each year is theaverage of the closing daily TSRlevels for the five-day period up toand including that date.APPROVALThis directors’ remuneration reporthas been approved by the Board ofdirectors of <strong>Anglo</strong> <strong>American</strong> plc.Signed on behalf of the Boardof directors.Sir Philip HamptonChairman, Remuneration Committee14 February 20136040202007 2008 2009 2010 2011 <strong>2012</strong><strong>Anglo</strong> <strong>American</strong> FTSE 100 IndexSource: Thomson Datastream140120100806040202007 2008 2009 2010 2011 <strong>2012</strong><strong>Anglo</strong> <strong>American</strong> LTIP sector comparatorSource: Thomson DatastreamGovernance<strong>Anglo</strong> <strong>American</strong> plc <strong>Annual</strong> <strong>Report</strong> <strong>2012</strong> 127
GOVERNANCE DIRECTORS’ REPORTDIRECTORS’REPORTThe directors have pleasure insubmitting the statutory financialstatements of the Group for theyear ended 31 December <strong>2012</strong>.The Board considers that the <strong>Annual</strong><strong>Report</strong>, taken as a whole, is fair,balanced and understandable and thatit provides all information necessaryfor shareholders to assess theCompany’s strategy and performance.PRINCIPAL ACTIVITIES<strong>Anglo</strong> <strong>American</strong> is one of the world’slargest mining companies, isheadquartered in the UK and listedon the London and Johannesburgstock exchanges. <strong>Anglo</strong> <strong>American</strong>’sportfolio of mining businesses spansbulk commodities – iron ore andmanganese, metallurgical coal andthermal coal; base metals – copperand nickel; and precious metals andminerals – in which it is a globalleader in both platinum and diamonds.<strong>Anglo</strong> <strong>American</strong> is committed tothe highest standards of safety andresponsibility across all its businessesand geographies and to makinga sustainable difference in thedevelopment of the communitiesaround its operations. The Company’smining operations, extensive pipelineof growth projects and explorationactivities span southern Africa, SouthAmerica, Australia, North America,Asia and Europe.More detailed information about theGroup’s businesses, activities andfinancial performance is incorporatedin this report by reference and canbe found in the chairman’s and CEO’sstatements on pages 2–3 and 10–11respectively and the operating andfinancial review on pages 12–89. TheCorporate Governance statement ison pages 90–127 and is incorporatedin this Directors’ report by reference.GOING CONCERNThe financial position of the Group,its cash flows, liquidity position andborrowing facilities are set out in theGroup Financial Performance Reviewon pages 42–47. In addition, detailis given on the Group’s policy onmanaging credit and liquidity risk inthe Principal Risks and Uncertaintiessection on pages 48–53, withdetails of our policy on capital riskmanagement being set out in note 25to the financial statements. TheGroup’s net debt at 31 December <strong>2012</strong>was $8.6 billion (2011: $1.4 billion),representing a gearing level of 16.4%(2011: 3.1%). Details of borrowings andfacilities are set out in notes 24 and 25and net debt is set out in note 31.The directors have considered theGroup’s cash flow forecasts for theperiod to the end of March 2014.The Board is satisfied that the Group’sforecasts and projections, takingaccount of reasonably possiblechanges in trading performance, showthat the Group will be able to operatewithin the level of its current facilitiesfor the foreseeable future. For thisreason the Group continues to adoptthe going concern basis in preparingits financial statements.DIVIDENDSAn interim dividend of 32 US centsper ordinary share was paid on13 September <strong>2012</strong>. The directorsare recommending that a final dividendof 53 US cents per ordinary share bepaid on 25 April 2013 to ordinaryshareholders on the register on22 March 2013, subject to shareholderapproval at the AGM to be held on19 April 2013. This would bring thetotal dividend in respect of <strong>2012</strong> to85 US cents per ordinary share.In accordance with InternationalFinancial <strong>Report</strong>ing Standards (IFRS),the final dividend will be accounted forin the financial statements for the yearended 31 December 2013.128 <strong>Anglo</strong> <strong>American</strong> plc <strong>Annual</strong> <strong>Report</strong> <strong>2012</strong>
SHARE CAPITALDIRECTORSDirectors’ biographical details aregiven on pages 92–93. Details ofdirectors’ interests in shares and shareoptions of the Company can be foundin the remuneration report on pages108–127.Anne Stevens joined the Board on15 May <strong>2012</strong>. Mamphela Rampheleresigned from the Board with effectfrom 25 July <strong>2012</strong>. Cynthia Carrollhas resigned as CEO of the Companywith effect from 3 April 2013 andas a director with effect from theclosing of the AGM to be held on19 April 2013. Mark Cutifani has beenappointed CEO and a director with effectfrom 3 April 2013.On 12 February 2013, the Boardproposed the appointment of Dr ByronGrote as a non-executive director atthe forthcoming AGM on 19 April 2013.It is intended that Dr Grote will join theAudit Committee of the Board onappointment and he will, after a periodof induction, assume the role ofChairman of that committee fromDavid Challen, who has held thisposition since 2003.In addition, Peter Woicke informed theBoard of his intention to retire as anon-executive director, also with effectfrom the AGM. Mr Woicke will besucceeded as Chairman of the Safetyand Sustainable DevelopmentCommittee by Jack Thompson.In accordance with the Code,<strong>Anglo</strong> <strong>American</strong> will continue topropose the re-election of all directorson an annual basis.SUSTAINABLE DEVELOPMENTThe Sustainable Development <strong>Report</strong><strong>2012</strong> will be available in April 2013.This report focuses on the safety,sustainable development, health andenvironmental performance of theGroup’s managed operations, itsperformance with regard to theCompany’s Good Citizenship BusinessPrinciples, and the operationaldimensions of its social programmes.The Company’s issued share capital asat 31 December <strong>2012</strong>, together withdetails of share allotments and issue oftreasury shares during the year, is setout in note 29 on pages 177–180.The Company was authorised byshareholders at the AGM held on19 April <strong>2012</strong> to purchase its ownshares in the market up to a maximumof 14.99% of the issued share capital.No shares were purchased under thisauthority during <strong>2012</strong>. This authoritywill expire at the 2013 AGM and, inaccordance with usual practice, aresolution to renew it for another yearwill be proposed.MATERIAL SHAREHOLDINGSAs at 31 December <strong>2012</strong>, theCompany was aware of the followinginterests in 3% or more of theCompany’s ordinary share capital:PercentageCompanyNumberof sharesof votingrightsBlackrock, Inc. 63,971,090 4.60Epoch TwoInvestmentHoldingsLimited (1) 42,166,686 3.03PublicInvestmentCorporation(PIC)81,235,375 5.84Tarl Investment 47,275,613 3.39Limited (1)Holdings(1)Epoch Two Investment Holdings Ltd (Epoch 2)and Tarl Investment Holdings Limited (Tarl) are twoof the independent companies that have purchasedshares as part of <strong>Anglo</strong> <strong>American</strong>’s share buy backprogramme. Epoch 2 and Tarl have waived theirright to vote all the shares they hold or will hold in<strong>Anglo</strong> <strong>American</strong> plc.PAYMENT OF SUPPLIERS<strong>Anglo</strong> <strong>American</strong> plc is a holdingcompany and, as such, has no materialtrade creditors. Businesses across theGroup are responsible for agreeingthe terms under which transactionswith their suppliers are conducted,reflecting local and industry norms andGroup purchasing arrangements thatmay have been made with a supplier.The Group values its suppliers andrecognises the benefits to be derivedfrom maintaining good relationshipswith them. <strong>Anglo</strong> <strong>American</strong>acknowledges the importance ofpaying invoices, especially those ofsmall businesses, promptly.VALUE OF LANDLand is mainly carried in the financialstatements at cost. It is not practicableto estimate the market value of landand mineral rights, since these dependon product prices over the next 20years or more, which will vary withmarket conditions.POST-BALANCE SHEET EVENTSPost-balance sheet events are set outin note 39 to the financial statementson page 187.GovernanceAs at the date hereof the Company hasbeen notified of the following changeto the above holdings of voting rightsin the ordinary share capital of theCompany: Blackrock, Inc. 64,138,546(4.61%).AUDIT INFORMATIONThe directors confirm that, so far asthey are aware, there is no relevantaudit information of which the auditorsare unaware and that all directors havetaken all reasonable steps to makethemselves aware of any relevant auditinformation and to establish that theauditors are aware of that information.<strong>Anglo</strong> <strong>American</strong> plc <strong>Annual</strong> <strong>Report</strong> <strong>2012</strong> 129
GOVERNANCE DIRECTORS’ REPORTEMPLOYMENT ANDOTHER POLICIESThe Group’s key operating businessesare empowered to manage withinthe context of the different legislativeand social demands of the diversecountries in which those businessesoperate, subject to the standardsembodied in <strong>Anglo</strong> <strong>American</strong>’sGood Citizenship Business Principles.Within all the Group’s businesses,the safe and effective performanceof employees and the maintenanceof positive employee relations are offundamental importance. Managersare charged with ensuring that thefollowing key principles are upheld:• Adherence to national legalstandards on employment andworkplace rights at all times• In addition, adherence to theInternational Labour Organization’score labour rights, including:prohibition of child labour; prohibitionof inhumane treatment of employeesand any form of forced labour,physical punishment or other abuse;recognition of the right of ouremployees to freedom of associationand the promotion of workplaceequality; and the elimination of allforms of unfair discrimination• Continual promotion of safe andhealthy working practices• Provision of opportunities foremployees to enhance their workrelated skills and capabilities• Adoption of fair and appropriateprocedures for determining termsand conditions of employment.It is our policy that people withdisabilities should have full and fairconsideration for all vacancies.Employment of disabled people isconsidered on merit and with regardonly to the ability of any applicant tocarry out the role. We endeavour toretain the employment of, and arrangesuitable retraining for, any employeesin the workforce who become disabledduring their employment. Wherepossible we will adjust a person’sworking environment to enable themto stay in our employment.Further, the Group is committed totreating employees at all levels withrespect and consideration, to investingin their development and to ensuringthat their careers are not constrainedby discrimination or arbitrary barriers.The Good Citizenship BusinessPrinciples are supplemented by four<strong>Anglo</strong> <strong>American</strong> ‘Way’ documents,covering the safety, environmental,occupational health and socialaspects of responsible operation andsustainable development. These setout specific standards for each of thesesubject areas, in line with internationalbest practice.Copies of the Good CitizenshipBusiness Principles and the<strong>Anglo</strong> <strong>American</strong> ‘Way’ documentsare available from the Companyand may be accessed on theCompany’s website.The Business Integrity Policy andPerformance Standards set out howGroup employees, business partnersand major suppliers must act to ensurethat our zero tolerance of corruption isupheld. All senior employees, andemployees in high-risk functions suchas procurement, are trained to embedknowledge of the policy as well as theUK Bribery Act and how to behave incorruption-risk situations. This trainingis ongoing and mandatory for allsenior levels and others where it isdeemed appropriate.The Group has a well-used enterpriseinformation portal, theSource, whichseeks to ensure that employees areregularly updated on developmentswithin the Group, and feedback isencouraged. In addition, the Companyregularly publishes Optima (availableon the Company’s website) andOur World, which contain items ofnews, current affairs and informationrelevant to Group employees.CHARITABLE DONATIONSDuring the year, <strong>Anglo</strong> <strong>American</strong>, itssubsidiaries and the <strong>Anglo</strong> <strong>American</strong>Group Foundation made donationsfor charitable purposes or wider socialinvestments amounting to $154 million(3% of operating profit fromsubsidiaries and joint ventures beforespecial items and remeasurements).Charitable donations of $1.8 millionwere made in the UK, of which themain categories were: educationand training (5.7%) and health andwelfare (22.6%). These figures werecompiled with reference to the LondonBenchmarking Group model fordefining and measuring socialinvestment spending. A fulleranalysis of the Group’s socialinvestment activities can be foundin the Sustainable Development<strong>Report</strong> <strong>2012</strong>.POLITICAL DONATIONSNo political donations were madeduring <strong>2012</strong>. <strong>Anglo</strong> <strong>American</strong> hasan established policy of not makingdonations to, or incurring expensesfor the benefit of, any political partyin any part of the world, including anypolitical party or political organisationas defined in the Political Parties,Elections and Referendums Act 2000.130 <strong>Anglo</strong> <strong>American</strong> plc <strong>Annual</strong> <strong>Report</strong> <strong>2012</strong>
ANNUAL GENERAL MEETINGThe AGM will be held on 19 April 2013,when shareholders will have theopportunity to put questions to theBoard, including the chairmen of thevarious committees. A separatebooklet enclosed with this reportcontains the notice convening themeeting together with a descriptionof the business to be conducted.Facilities have been put in place toenable shareholders on the UKregister to receive communicationselectronically rather than by mail and,for those unable to attend the meeting,to cast their votes by electronic means,including those shareholders whoseshares are held in the CREST system.In accordance with best practice,voting on each resolution to beproposed at the AGM will beconducted on a poll rather than by ashow of hands. The results of the pollwill be announced to the press and onthe Company’s website.ELECTRONIC COMMUNICATIONSSince the implementation of theelectronic communications provisionsin the Companies Act 2006, theCompany has substantially reducedthe cost of annual report productionand distribution. Shareholders mayelect to receive notification by email ofthe availability of the annual report onthe Company’s website instead ofreceiving paper copies.ADDITIONAL INFORMATIONFOR SHAREHOLDERSSet out below is a summary of certainprovisions of the Company’s currentArticles and applicable English lawconcerning companies (theCompanies Act 2006 (the CompaniesAct)) required as a result of theimplementation of the TakeoversDirective in English law. This is asummary only and the relevantprovisions of the Articles or theCompanies Act should be consultedif further information is required.Dividends and distributionsSubject to the provisions of theCompanies Act, the Company may byordinary resolution from time to timedeclare dividends not exceeding theamount recommended by the Board.The Board may pay interim dividendswhenever the financial position of theCompany, in the opinion of the Board,justifies such payment.The Board may withhold payment of allor any part of any dividends or othermonies payable in respect of theCompany’s shares from a person witha 0.25% interest or more (as defined inthe Articles) if such a person has beenserved with a notice after failing toprovide the Company with informationconcerning interests in those sharesrequired to be provided under theCompanies Act.Rights and obligations attachingto sharesThe rights and obligations attaching tothe ordinary and preference shares areset out in the Articles. The Articles mayonly be changed by a special resolutionpassed by the shareholders.VotingSubject to the Articles generally andto any special rights or restrictions asto voting attached by or in accordancewith the Articles to any class of shares,on a show of hands every memberwho is present in person at a generalmeeting shall have one vote and, ona poll, every member who is presentin person or by proxy shall have onevote for every share of which he/sheis the holder. It is, and has been forsome years, the Company’s practiceto hold a poll on every resolution atshareholder meetings.Where shares are held by trustees/nominees in respect of the Group’semployee share plans and the votingrights attached to such shares are notdirectly exercisable by the employees,it is the Company’s practice that suchrights are not exercised by the relevanttrustee/nominee.Under the Companies Act, membersare entitled to appoint a proxy, whoneed not be a member of theCompany, to exercise all or any of theirrights to attend and to speak and voteon their behalf at a general meetingor class meeting. A member mayappoint more than one proxy in relationto a general meeting or class meetingprovided that each proxy is appointedto exercise the rights attached to adifferent share or shares held bythat member. A member that is acorporation may appoint one or moreindividuals to act on its behalf at ageneral meeting or class meeting asa corporate representative. The debatearound s323 of the Companies Acthas been resolved so that where ashareholder appoints more than onecorporate representative in respectof its shareholding, but in respect ofdifferent shares, those corporaterepresentatives can act independentlyof each other, and validly vote indifferent ways.Restrictions on votingNo member shall, unless the directorsotherwise determine, be entitled inrespect of any share held by him/herto vote either personally or by proxyat a shareholders’ meeting, or toexercise any other right conferredby membership in relation toshareholders’ meetings, if any call orother sum presently payable by him/her to the Company in respect of thatshare remains unpaid. In addition, nomember shall be entitled to vote if he/she has been served with a notice afterfailing to provide the Company withinformation concerning interests inthose shares required to be providedunder the Companies Act.Governance<strong>Anglo</strong> <strong>American</strong> plc <strong>Annual</strong> <strong>Report</strong> <strong>2012</strong> 131
GOVERNANCE DIRECTORS’ REPORTIssue of sharesSubject to the provisions of theCompanies Act relating to authorityand pre-emption rights and of anyresolution of the Company in a UKgeneral meeting, all unissued sharesof the Company shall be at the disposalof the directors and they may allot(with or without conferring a right ofrenunciation), grant options over, orotherwise dispose of them to suchpersons at such times, and on suchterms, as they think proper.Shares in uncertificated formDirectors may determine that any classof shares may be held in uncertificatedform and title to such shares may betransferred by means of a relevantsystem, or that shares of any classshould cease to be so held andtransferred. Subject to the provisionsof the Companies Act, the CRESTregulations and every other statute,statutory instrument, regulation ororder for the time being in forceconcerning companies and affectingthe Company (together, the Statutes),the directors may determine that anyclass of shares held on the branchregister of members of the Companyresident in South Africa, or any otheroverseas branch register of themembers of the Company, may beheld in uncertificated form inaccordance with any system outsidethe UK that enables title to such sharesto be evidenced and transferredwithout a written instrument and whichis a relevant system. The provisions ofthe Articles shall not apply to sharesof any class that are in uncertificatedform to the extent that the Articles areinconsistent with the holding of sharesof that class in uncertificated form, thetransfer of title to shares of that classby means of a relevant system or anyprovision of the CREST regulations.Deadlines for exercisingvoting rightsVotes are exercisable at a generalmeeting of the Company in respect ofwhich the business being voted uponis being heard. Votes may be exercisedin person, by proxy, or in relation tocorporate members, by corporaterepresentative. The Articles provide adeadline for submission of proxy formsof not less than 48 hours before thetime appointed for the holding of themeeting or adjourned meeting.Variation of rightsSubject to statute, the Articles specifythat rights attached to any class ofshares may be varied with the writtenconsent of the holders of not less thanthree quarters in nominal value of theissued shares of that class, or with thesanction of an extraordinary resolutionpassed at a separate general meetingof the holders of those shares. At everysuch separate general meeting thequorum shall be two persons holding,or representing by proxy, at least onethird in nominal value of the issuedshares of the class (calculatedexcluding any shares held as treasuryshares). The rights conferred upon theholders of any shares shall not, unlessotherwise expressly provided in therights attaching to those shares, bedeemed to be varied by the creationor issue of further shares rankingpari passu with them.Transfer of sharesAll transfers of shares that are incertificated form may be effectedby transfer in writing in any usual orcommon form or in any other formacceptable to the directors and maybe under hand only. The instrumentof transfer shall be signed by or onbehalf of the transferor and (exceptin the case of fully paid shares) by oron behalf of the transferee. Thetransferor shall remain the holder ofthe shares concerned until the nameof the transferee is entered in theregister of shareholders. All transfersof shares that are in uncertificatedform may be effected by means of theCREST system.The directors may decline to recogniseany instrument of transfer relating toshares in certificated form unless it:(a) is in respect of only one class ofshare; and(b) is lodged at the transfer office (dulystamped if required) accompaniedby the relevant share certificate(s)and such other evidence as thedirectors may reasonably requireto show the right of the transferorto make the transfer (and, if theinstrument of transfer is executedby some other person on his/herbehalf, the authority of that personso to do).The directors may, in the case ofshares in certificated form, in theirabsolute discretion and withoutassigning any reason therefor, refuseto register any transfer of shares (notbeing fully paid shares) provided that,where any such shares are admitted tothe Official List of the London StockExchange, such discretion may not beexercised in such a way as to preventdealings in the shares of that classfrom taking place on an open andproper basis. The directors may alsorefuse to register an allotment ortransfer of shares (whether fully paidor not) in favour of more than fourpersons jointly.If the directors refuse to register anallotment or transfer, they shall sendthe refusal to the allottee or thetransferee within two months after thedate on which the letter of allotment ortransfer was lodged with the Company.A shareholder does not need to obtainthe approval of the Company, or ofother shareholders of shares in theCompany, for a transfer of shares totake place.132 <strong>Anglo</strong> <strong>American</strong> plc <strong>Annual</strong> <strong>Report</strong> <strong>2012</strong>
DirectorsDirectors shall not be less than ten normore than 18 in number. A director isnot required to hold any shares of theCompany by way of qualification. TheCompany may by ordinary resolutionincrease or reduce the maximum orminimum number of directors.Powers of directorsSubject to the Articles, the CompaniesAct and any directions given byspecial resolution, the business of theCompany will be managed by theBoard who may exercise all the powersof the Company.The Board may exercise all the powersof the Company to borrow moneyand to mortgage or charge any of itsundertaking, property and uncalledcapital and to issue debentures andother securities, whether outright or ascollateral security, for any debt, liabilityor obligation of the Company or of anythird party.The Company may by ordinaryresolution declare dividends but nodividend shall be payable in excessof the amount recommended by thedirectors. Subject to the provisions ofthe Articles and to the rights attachingto any shares, any dividends or othermonies payable on or in respect of ashare may be paid in such currencyas the directors may determine.The directors may deduct from anydividend payable to any member allsums of money (if any) presentlypayable by him/her to the Companyon account of calls or otherwise inrelation to shares of the Company.The directors may retain any dividendspayable on shares on which theCompany has a lien, and may apply thesame in or towards satisfaction of thedebts, liabilities or engagements inrespect of which the lien exists.Appointment and replacementof directorsThe directors may from time to timeappoint one or more directors.The Board may appoint any personto be a director (so long as the totalnumber of directors does not exceedthe limit prescribed in the Articles). Anysuch director shall hold office only untilthe next AGM and shall then be eligiblefor election.The Articles provide that at each AGMall those directors who have been inoffice for three years or more sincetheir election, or last re-election, shallretire from office. In addition, a directormay at any AGM retire from officeand stand for re-election. However,in accordance with the Code, alldirectors will be subject to annualre-election.Significant agreements:Change of controlAt 31 December <strong>2012</strong>, <strong>Anglo</strong><strong>American</strong> had committed bilateraland syndicated borrowing facilitiestotalling $12.2 billion with a numberof relationship banks that containchange of control clauses. $7.4 billionof the Group’s bond issues also containchange of control provisions. Inaggregate, this financing is consideredsignificant to the Group and, in theevent of a takeover (change of control)of the Company, these contracts maybe cancelled, become immediatelypayable or be subject to acceleration.Purchases of own sharesAt the AGM held on 19 April <strong>2012</strong>,authority was given for the Companyto purchase, in the market, up to198.4 million Ordinary Shares of54 86 ⁄91 US cents each. The Companydid not purchase any of its own sharesduring <strong>2012</strong>.IndemnitiesTo the extent permitted by law andthe Articles, the Company has madequalifying third party indemnityprovisions for the benefit of itsdirectors during the year, which remainin force at the date of this report.Copies of these indemnities are openfor inspection at the Company’sregistered office.By order of the BoardNicholas JordanCompany Secretary14 February 2013Governance<strong>Anglo</strong> <strong>American</strong> plc <strong>Annual</strong> <strong>Report</strong> <strong>2012</strong> 133
GOVERNANCE STATEMENT OF DIRECTORS’ RESPONSIBILITIESSTATEMENT OF DIRECTORS’RESPONSIBILITIESThe directors are responsible forpreparing the <strong>Annual</strong> <strong>Report</strong> and thefinancial statements in accordancewith applicable law and regulations.Company law requires the directorsto prepare financial statements foreach financial year. The directors arerequired to prepare the Group financialstatements in accordance withInternational Financial <strong>Report</strong>ingStandards (IFRS), as adopted by theEuropean Union and Article 4 of theIAS regulation, and have elected toprepare the parent company financialstatements in accordance with UnitedKingdom Generally AcceptedAccounting Practice (United KingdomAccounting Standards and applicablelaw). The directors must not approvethe accounts unless they are satisfiedthat they give a true and fair view of thestate of affairs of the Company and ofthe profit or loss of the Company forthat period.In preparing the parent companyfinancial statements, the directorsare required to:• Select suitable accounting policiesand then apply them consistently• Make judgements and accountingestimates that are reasonableand prudent• State whether applicable UKAccounting Standards have beenfollowed, subject to any materialdepartures disclosed and explainedin the financial statements• Prepare the financial statementson the going concern basis unlessit is inappropriate to presumethat the Company will continuein business.In preparing the Group financialstatements, International AccountingStandard 1 requires that directors:• Properly select and applyaccounting policies• Present information, includingaccounting policies, in a mannerthat provides relevant, reliable,comparable and understandableinformation• Provide additional disclosureswhen compliance with the specificrequirements in IFRS is insufficientto enable users to understand theimpact of particular transactions,other events and conditions onthe entity’s financial position andfinancial performance• Make an assessment of theCompany’s ability to continueas a going concern.The directors are responsible forkeeping adequate accounting recordsthat are sufficient to show and explainthe Company’s transactions, disclosewith reasonable accuracy at any timethe financial position of the Companyand enable them to ensure that thefinancial statements comply with theCompanies Act 2006. They are alsoresponsible for safeguarding theassets of the Company and hencefor taking reasonable steps for theprevention and detection of fraudand other irregularities.The directors are responsible forthe maintenance and integrity of thecorporate and financial informationincluded on the Company’s website.Legislation in the United Kingdomgoverning the preparation anddissemination of financialstatements may differ fromlegislation in other jurisdictions.134 <strong>Anglo</strong> <strong>American</strong> plc <strong>Annual</strong> <strong>Report</strong> <strong>2012</strong>
FINANCIAL STATEMENTSCONTENTSResponsibility statement 136Independent auditor’s report to the members of <strong>Anglo</strong> <strong>American</strong> plc 137Principal statementsConsolidated income statement 138Consolidated statement of comprehensive income 138Consolidated balance sheet 139Consolidated cash flow statement 140Consolidated statement of changes in equity 141Notes to the financial statements1 Accounting policies 1422 Segmental information 1483 Operating (loss)/profit from subsidiaries and joint ventures 1524 Operating profit and underlying earnings by segment 1535 Special items and remeasurements 1536 Underlying EBITDA 1557 Exploration expenditure 1568 Employee numbers and costs 1569 Net finance (costs)/income 15710 Financial instrument gains and losses 15711 Income tax expense 15812 Dividends 15913 Earnings per share 15914 Intangible assets 16015 Property, plant and equipment 16216 Environmental rehabilitation trusts 16217 Investments in associates 16318 Joint ventures 16419 Financial asset investments 16420 Inventories 16421 Trade and other receivables 16522 Trade and other payables 16523 Financial assets 16524 Financial liabilities 16625 Financial risk management and derivatives 16826 Provisions for liabilities and charges 17327 Deferred tax 17328 Retirement benefits 17429 Called-up share capital and share-based payments 17730 Consolidated equity analysis 18031 Consolidated cash flow analysis 18132 Acquisitions 18233 Disposals of subsidiaries and joint ventures 18334 Assets and liabilities held for sale 18335 Contingent liabilities 18436 Commitments 18537 Related party transactions 18538 Group companies 18639 Events occurring after end of year 18740 Financial statements of the parent company 188Financial statements<strong>Anglo</strong> <strong>American</strong> plc <strong>Annual</strong> <strong>Report</strong> <strong>2012</strong> 135
FINANCIAL STATEMENTSRESPONSIBILITY STATEMENTfor the year ended 31 December <strong>2012</strong>We confirm that to the best of our knowledge:(a) the financial statements, prepared in accordance with the applicable setof accounting standards, give a true and fair view of the assets, liabilities,financial position and loss of <strong>Anglo</strong> <strong>American</strong> plc and the undertakingsincluded in the consolidation taken as a whole; and(b) the Operating and financial review includes a fair review of thedevelopment and performance of the business and the position of <strong>Anglo</strong><strong>American</strong> plc and the undertakings included in the consolidation taken asa whole, together with a description of the principal risks and uncertaintiesthat they face.By order of the BoardCynthia CarrollChief ExecutiveRené MédoriFinance Director136 <strong>Anglo</strong> <strong>American</strong> plc <strong>Annual</strong> <strong>Report</strong> <strong>2012</strong>
INDEPENDENT AUDITOR’S REPORTTO THE MEMBERS OF ANGLO AMERICAN PLCWe have audited the financial statements of <strong>Anglo</strong> <strong>American</strong> plc for theyear ended 31 December <strong>2012</strong> which comprise the Consolidated incomestatement, the Consolidated statement of comprehensive income, theConsolidated balance sheet, the Consolidated cash flow statement, theConsolidated statement of changes in equity, the accounting policies, therelated notes 2 to 39 and the balance sheet of the Company and relatedinformation in note 40. The financial reporting framework that has beenapplied in the preparation of the Group financial statements is applicable lawand International Financial <strong>Report</strong>ing Standards (IFRSs) as adopted by theEuropean Union. The financial reporting framework that has been applied inthe preparation of the Company financial statements is applicable law andUnited Kingdom Accounting Standards (United Kingdom Generally AcceptedAccounting Practice).This report is made solely to the Company’s members, as a body, inaccordance with Chapter 3 of Part 16 of the Companies Act 2006. Our auditwork has been undertaken so that we might state to the Company’s membersthose matters we are required to state to them in an auditor’s report and forno other purpose. To the fullest extent permitted by law, we do not accept orassume responsibility to anyone other than the Company and the Company’smembers as a body, for our audit work, for this report, or for the opinions wehave formed.Respective responsibilities of directors and auditorAs explained more fully in the Statement of directors’ responsibilities, thedirectors are responsible for the preparation of the financial statements andfor being satisfied that they give a true and fair view. Our responsibility is toaudit and express an opinion on the financial statements in accordance withapplicable law and International Standards on Auditing (UK and Ireland).Those standards require us to comply with the Auditing Practices Board’s(APB’s) Ethical Standards for Auditors.Scope of the audit of the financial statementsAn audit involves obtaining evidence about the amounts and disclosures inthe financial statements sufficient to give reasonable assurance that thefinancial statements are free from material misstatement, whether causedby fraud or error. This includes an assessment of: whether the accountingpolicies are appropriate to the Group’s and the Company’s circumstances andhave been consistently applied and adequately disclosed; the reasonablenessof significant accounting estimates made by the directors; and the overallpresentation of the financial statements. In addition, we read all the financialand non-financial information in the annual report to identify materialinconsistencies with the audited financial statements. If we become awareof any apparent material misstatements or inconsistencies we consider theimplications for our report.Matters on which we are required to report by exceptionWe have nothing to report in respect of the following:Under the Companies Act 2006 we are required to report to you if, in ouropinion:• adequate accounting records have not been kept by the Company, orreturns adequate for our audit have not been received from branches notvisited by us; or• the Company financial statements and the part of the Remunerationreport to be audited are not in agreement with the accounting recordsand returns; or• certain disclosures of directors’ remuneration specified by law are notmade; or• we have not received all the information and explanations we require forour audit.Under the Listing Rules we are required to review:• the directors’ statement contained within the Directors’ report in relationto going concern;• the part of the Corporate governance section relating to the Company’scompliance with the nine provisions of the UK Corporate GovernanceCode specified for our review; and• certain elements of the report to shareholders by the Board on directors’remuneration.Carl D. Hughes (Senior Statutory Auditor)for and on behalf of Deloitte LLPChartered Accountants and Statutory AuditorLondon, United Kingdom14 February 2013Financial statementsOpinion on financial statementsIn our opinion:• the financial statements give a true and fair view of the state of the Group’sand of the Company’s affairs as at 31 December <strong>2012</strong> and of the Group’sloss and the Company’s profit for the year then ended;• the Group financial statements have been properly prepared in accordancewith IFRSs as adopted by the European Union;• the Company financial statements have been properly prepared inaccordance with United Kingdom Generally Accepted AccountingPractice; and• the financial statements have been prepared in accordance with therequirements of the Companies Act 2006; and, as regards the Groupfinancial statements, Article 4 of the IAS Regulation.Opinion on other matters prescribed by the CompaniesAct 2006In our opinion:• the part of the Remuneration report to be audited has been properlyprepared in accordance with the Companies Act 2006; and• the information given in the Directors’ report for the financial year for which thefinancial statements are prepared is consistent with the financial statements.<strong>Anglo</strong> <strong>American</strong> plc <strong>Annual</strong> <strong>Report</strong> <strong>2012</strong> 137
FINANCIAL STATEMENTS PRINCIPAL STATEMENTSCONSOLIDATED INCOME STATEMENTfor the year ended 31 December <strong>2012</strong>Before specialitems andremeasurementsSpecial items andremeasurements(note 5)<strong>2012</strong> 2011Before specialitems andremeasurementsSpecial items andremeasurements(note 5)US$ millionNoteTotalTotalGroup revenue 2 28,761 – 28,761 30,580 – 30,580Total operating costs (23,356) (7,093) (30,449) (20,912) (229) (21,141)Operating (loss)/profit from subsidiaries and jointventures 2, 3 5,405 (7,093) (1,688) 9,668 (229) 9,439Non-operating special items and remeasurements 5 – 1,394 1,394 – 183 183Share of net income from associates 2, 17 493 (61) 432 978 (1) 977Total profit from operations and associates 5,898 (5,760) 138 10,646 (47) 10,599Investment income 597 – 597 668 – 668Interest expense (798) – (798) (695) – (695)Other financing (losses)/gains (87) (89) (176) 7 203 210Net finance (costs)/income 9 (288) (89) (377) (20) 203 183(Loss)/profit before tax 5,610 (5,849) (239) 10,626 156 10,782Income tax expense 11a (1,488) 1,113 (375) (2,741) (119) (2,860)(Loss)/profit for the financial year 4,122 (4,736) (614) 7,885 37 7,922Attributable to:Non-controlling interests 1,283 (404) 879 1,765 (12) 1,753Equity shareholders of the Company 2,839 (4,332) (1,493) 6,120 49 6,169(Loss)/earnings per share (US$)Basic 13 2.26 (3.45) (1.19) 5.06 0.04 5.10Diluted 13 2.24 (3.43) (1.19) 4.85 0.04 4.89CONSOLIDATED STATEMENT OF COMPREHENSIVE INCOMEfor the year ended 31 December <strong>2012</strong>US$ million Note <strong>2012</strong> 2011(Loss)/profit for the financial year (614) 7,922Net gain on revaluation of available for sale investments 173 115Net loss on cash flow hedges – (94)Net exchange difference on translation of foreign operations (including associates) (747) (4,060)Actuarial net gain/(loss) on post employment benefit schemes 165 (214)Share of associates’ expense recognised directly in equity, net of tax (6) (32)Tax on items recognised directly in equity 11c (115) 24Net expense recognised directly in equity (530) (4,261)Transferred to income statement: disposal of available for sale investments (57) (10)Transferred to income statement: impairment of available for sale investments 84 –Transferred to income statement: cash flow hedges 4 5Transferred to initial carrying amount of hedged items: cash flow hedges 5 54Transferred to income statement: net exchange difference on disposal of foreign operations 24 45Share of associate's net expense transferred from equity (10) –Tax on items transferred from equity 11c 29 (14)Total transferred from equity 79 80Total comprehensive (expense)/income for the financial year (1,065) 3,741Attributable to:Non-controlling interests 842 1,142Equity shareholders of the Company (1,907) 2,599138 <strong>Anglo</strong> <strong>American</strong> plc <strong>Annual</strong> <strong>Report</strong> <strong>2012</strong>
CONSOLIDATED BALANCE SHEETas at 31 December <strong>2012</strong>US$ million Note <strong>2012</strong> 2011ASSETSNon-current assetsIntangible assets 14 4,571 2,322Property, plant and equipment 15 45,089 40,549Environmental rehabilitation trusts 16 393 360Investments in associates 17 3,063 5,240Financial asset investments 19 2,278 2,896Trade and other receivables 21 572 437Deferred tax assets 27 1,223 530Derivative financial assets 25 747 668Other non-current assets 236 138Total non-current assets 58,172 53,140Current assetsInventories 20 5,005 3,517Financial asset investments 19 102 –Trade and other receivables 21 3,275 3,674Current tax assets 470 207Derivative financial assets 25 101 172Cash and cash equivalents 31b 9,094 11,732Total current assets 18,047 19,302Assets classified as held for sale 34 3,150 –Total assets 79,369 72,442LIABILITIESCurrent liabilitiesTrade and other payables 22 (4,536) (5,098)Short term borrowings 24, 31b (2,604) (1,018)Provisions for liabilities and charges 26 (564) (372)Current tax liabilities (819) (1,528)Derivative financial liabilities 25 (280) (162)Total current liabilities (8,803) (8,178)Non-current liabilitiesTrade and other payables 22 (18) –Medium and long term borrowings 24, 31b (15,150) (11,855)Retirement benefit obligations 28 (1,409) (639)Deferred tax liabilities 27 (6,069) (5,730)Derivative financial liabilities 25 (801) (950)Provisions for liabilities and charges 26 (2,384) (1,830)Other non-current liabilities (29) (71)Total non-current liabilities (25,860) (21,075)Liabilities directly associated with assets classified as held for sale 34 (919) –Total liabilities (35,582) (29,253)Net assets 43,787 43,189EQUITYCalled-up share capital 29 772 738Share premium account 4,357 2,714Own shares (6,659) (6,985)Other reserves (1,201) 283Retained earnings 40,388 42,342Equity attributable to equity shareholders of the Company 37,657 39,092Non-controlling interests 6,130 4,097Total equity 43,787 43,189Financial statementsThe financial statements of <strong>Anglo</strong> <strong>American</strong> plc, registered number 03564138, were approved by the Board of directors on 14 February 2013 and signed on itsbehalf by:Cynthia CarrollChief ExecutiveRené MédoriFinance Director<strong>Anglo</strong> <strong>American</strong> plc <strong>Annual</strong> <strong>Report</strong> <strong>2012</strong> 139
FINANCIAL STATEMENTS PRINCIPAL STATEMENTSCONSOLIDATED CASH FLOW STATEMENTfor the year ended 31 December <strong>2012</strong>US$ million Note <strong>2012</strong> 2011Cash flows from operations 31a 7,021 11,498Dividends from associates 286 344Dividends from financial asset investments 54 59Income tax paid (1,799) (2,539)Net cash inflows from operating activities 5,562 9,362Cash flows from investing activitiesAcquisition of subsidiaries, net of cash and cash equivalents acquired 32 (4,816) –Purchase of property, plant and equipment 2 (5,607) (6,203)Cash flows from derivatives related to capital expenditure 2 (71) 439Investments in associates (114) (47)Purchase of financial asset investments (16) (16)Net repayment of loans granted 81 22Interest received and other investment income 279 350Disposal of subsidiaries, net of cash and cash equivalents disposed 33 100 514Sale of interests in joint ventures 33 – 19Repayment of capitalised loans by associates 36 4Proceeds from disposal of property, plant and equipment 66 77Net proceeds from disposal of interests in available for sale investments 273 –Other investing activities (32) (12)Net cash used in investing activities (9,821) (4,853)Cash flows from financing activitiesInterest paid (775) (807)Cash flows from derivatives related to financing activities 149 226Dividends paid to Company shareholders (970) (818)Dividends paid to non-controlling interests (1,267) (1,404)Repayment of short term borrowings (747) (1,261)Net receipt of medium and long term borrowings 5,633 964Movements in non-controlling interests 1,220 4,964Tax on sale of non-controlling interest in <strong>Anglo</strong> <strong>American</strong> Sur (1,015) –Sale of shares under employee share schemes 24 20Purchase of shares by subsidiaries for employee share schemes (1) (253) (367)Other financing activities (49) (43)Net cash inflows from financing activities 1,950 1,474Net (decrease)/increase in cash and cash equivalents (2,309) 5,983Cash and cash equivalents at start of year 31c 11,732 6,460Cash movements in the year (2,309) 5,983Effects of changes in foreign exchange rates (111) (711)Cash and cash equivalents at end of year 31c 9,312 11,732(1)Includes purchase of Kumba Iron Ore Limited and <strong>Anglo</strong> <strong>American</strong> Platinum Limited shares for their respective employee share schemes.140 <strong>Anglo</strong> <strong>American</strong> plc <strong>Annual</strong> <strong>Report</strong> <strong>2012</strong>
CONSOLIDATED STATEMENT OF CHANGES IN EQUITYfor the year ended 31 December <strong>2012</strong>Total sharecapital (1)Ownshares (2)RetainedearningsShare-basedpaymentreserveCumulativetranslationadjustmentreserveFair value andother reserves(note 30)Total equityattributableto equityshareholdersof theCompanyNoncontrollinginterestsUS$ millionTotal equityBalance at 1 January 2011 3,451 (7,159) 34,305 476 1,474 1,692 34,239 3,732 37,971Total comprehensive income/(expense) – – 5,928 – (3,404) 75 2,599 1,142 3,741Dividends payable to Companyshareholders – – (834) – – – (834) – (834)Dividends payable tonon-controlling interests – – – – – – – (1,401) (1,401)Changes in ownership interestin subsidiaries – – 3,027 – – – 3,027 788 3,815Issue of shares tonon-controlling interests – – – – – – – 16 16Equity settled share-basedpayment schemes – 174 (193) (18) – – (37) (167) (204)IFRS 2 charges on black economicempowerment transactions – – 102 – – – 102 29 131Other 1 – 7 (5) – (7) (4) (42) (46)Balance at 1 January <strong>2012</strong> 3,452 (6,985) 42,342 453 (1,930) 1,760 39,092 4,097 43,189Total comprehensive (expense)/income – – (1,349) – (686) 128 (1,907) 842 (1,065)Dividends payable to Companyshareholders – – (970) – – – (970) – (970)Dividends payable tonon-controlling interests – – – – – – – (1,259) (1,259)Conversion of convertible bond 1,677 – 185 – – (355) 1,507 – 1,507Changes in ownership interestin subsidiaries – – (231) – – – (231) 982 751Acquired through businesscombinations – – – – – – – 1,423 1,423Issue of shares tonon-controlling interests – – – – – – – 17 17Equity settled share-basedpayment schemes – 326 (256) 96 – – 166 28 194Other – – 667 – – (667) – – –Balance at 31 December <strong>2012</strong> 5,129 (6,659) 40,388 549 (2,616) 866 37,657 6,130 43,787(1)Includes share capital and share premium.(2)Own shares comprise shares of <strong>Anglo</strong> <strong>American</strong> plc held by the Company (treasury shares), its subsidiaries and employee benefit trusts. Own shares have previously been aggregated withretained earnings. Comparatives have been reclassified to align with current presentation.DividendsNote <strong>2012</strong> 2011Proposed ordinary dividend per share (US cents) 12 53 46Proposed ordinary dividend (US$ million) 12 676 557Financial statementsOrdinary dividends payable during the year per share (US cents) 12 78 68Ordinary dividends payable during the year (US$ million) 12 970 834<strong>Anglo</strong> <strong>American</strong> plc <strong>Annual</strong> <strong>Report</strong> <strong>2012</strong> 141
FINANCIAL STATEMENTSNOTES TO THE FINANCIAL STATEMENTS1. ACCOUNTING POLICIESBasis of preparationThe financial statements have been prepared in accordance with InternationalFinancial <strong>Report</strong>ing Standards (IFRS) and IFRS Interpretations Committee(IFRIC) interpretations as adopted for use by the European Union, with thoseparts of the Companies Act 2006 applicable to companies reporting underIFRS and with the requirements of the Disclosure and Transparency rules ofthe Financial Services Authority in the United Kingdom as applicable toperiodic financial reporting. The financial statements have been preparedunder the historical cost convention as modified by the revaluation of pensionassets and liabilities and certain financial instruments. A summary of theprincipal Group accounting policies is set out below.The preparation of financial statements in conformity with generally acceptedaccounting principles requires the use of estimates and assumptions thataffect the reported amounts of assets and liabilities at the date of the financialstatements and the reported amounts of revenues and expenses during thereporting period. Although these estimates are based on management’s bestknowledge of the amount, event or actions, actual results ultimately may differfrom those estimates.Going concernThe directors have, at the time of approving the financial statements, areasonable expectation that the Company and the Group have adequateresources to continue in operational existence for the foreseeable future.Thus the going concern basis of accounting in preparing the financialstatements continues to be adopted. Further details are contained in theDirectors’ report on page 128.Changes in accounting policies and disclosuresA number of amendments to accounting standards issued by the InternationalAccounting Standards Board (IASB) were applicable from 1 January <strong>2012</strong>.They have not had a material impact on the accounting policies, methods ofcomputation or presentation applied by the Group.Changes in estimatesDue to the nature of Platinum in-process inventories being contained in weirs,pipes and other vessels, physical counts only take place annually, except inthe Precious Metal Refinery which take place once every three years (thelatest being in 2010). Consequently, the Platinum business runs a theoreticalmetal inventory system based on inputs, the results of previous physicalcounts and outputs. Once the results of the physical count are finalised, thevariance between the theoretical count and actual count is investigated andrecorded as a change in estimate.During the year ended 31 December <strong>2012</strong>, the change in estimate followingthe annual physical count has had the effect of increasing the value ofinventory by $172 million (2011: $61 million), resulting in the recognitionof a gain in the income statement.Basis of consolidationThe financial statements incorporate a consolidation of the financial statementsof the Company and entities controlled by the Company (its subsidiaries). Controlis achieved where the Company has the power to govern the financial andoperating policies of an investee entity so as to obtain benefits from its activities.The results of subsidiaries acquired or disposed of during the year areincluded in the income statement from the effective date of acquisition orup to the effective date of disposal, as appropriate.Where necessary, adjustments are made to the results of subsidiaries, jointventures and associates to bring their accounting policies into line with thoseused by the Group. Intra-group transactions, balances, income and expensesare eliminated on consolidation, where appropriate.For non-wholly owned subsidiaries, a share of the profit or loss for thefinancial year and net assets or liabilities is attributed to the non-controllinginterests as shown in the income statement and balance sheet.AssociatesAssociates are investments over which the Group is in a position to exercisesignificant influence, but not control or joint control, through participation inthe financial and operating policy decisions of the investee. Typically theGroup owns between 20% and 50% of the voting equity of its associates.Investments in associates are accounted for using the equity method ofaccounting except when classified as held for sale. The Group’s share ofassociates’ net income is based on their most recent audited financialstatements or unaudited interim statements drawn up to the Group’s balancesheet date.The total carrying values of investments in associates represent the cost ofeach investment including the carrying value of goodwill, the share of postacquisition retained earnings, any other movements in reserves and any longterm debt interests which in substance form part of the Group’s netinvestment. The carrying values of associates are reviewed on a regular basisand if an impairment in value has occurred, the carrying value is impaired inthe period in which the relevant circumstances are identified. The Group’sshare of an associate’s losses in excess of its interest in that associate is notrecognised unless the Group has an obligation to fund such losses.Unrealised gains arising from transactions with associates are eliminatedagainst the investment to the extent of the Group’s interest in the investee.Unrealised losses are eliminated in the same way, but only to the extent thatthere is no evidence of impairment.Jointly controlled entitiesA jointly controlled entity is an entity in which the Group holds a long terminterest and shares joint control over strategic, financial and operatingdecisions with one or more other venturers under a contractual arrangement.The Group’s share of the assets, liabilities, income, expenditure and cashflows of such jointly controlled entities are accounted for using proportionateconsolidation. Proportionate consolidation combines the Group’s share of theresults of the joint venture entity on a line by line basis with similar items in theGroup’s financial statements.Jointly controlled operationsThe Group has contractual arrangements with other participants to engagein joint activities other than through a separate entity. The Group includes itsassets, liabilities, expenditure and its share of revenue in such joint ventureoperations with similar items in the Group’s financial statements.Revenue recognitionRevenue is derived principally from the sale of goods and is measured at thefair value of consideration received or receivable, after deducting discounts,volume rebates, value added tax and other sales taxes. Sales of concentrate arestated at their invoiced amount which is net of treatment and refining charges.A sale is recognised when the significant risks and rewards of ownership havepassed. This is usually when title and insurance risk have passed to thecustomer and the goods have been delivered to a contractually agreed location.Revenue from metal mining activities is based on the payable metal sold.Sales of certain commodities are provisionally priced such that the price is notsettled until a predetermined future date based on the market price at that time.Revenue on these sales is initially recognised (when the above criteria are met)at the current market price. Provisionally priced sales are marked to market ateach reporting date using the forward price for the period equivalent to thatoutlined in the contract. This mark to market adjustment is recognised in revenue.Revenues from the sale of material by-products are included within revenue.Where a by-product is not regarded as significant, revenue may be creditedagainst the cost of sales.Interest income is accrued on a time basis, by reference to the principaloutstanding and at the effective interest rate applicable.Dividend income from investments is recognised when the shareholders’rights to receive payment have been established.Business combinations and goodwill arising thereonThe identifiable assets, liabilities and contingent liabilities of a subsidiary,a joint venture entity or an associate, which can be measured reliably, arerecorded at their provisional fair values at the date of acquisition. Goodwillis the fair value of the consideration transferred (including contingentconsideration and previously held non-controlling interests) less the fair valueof the Group’s share of identifiable net assets on acquisition.Where a business combination is achieved in stages, the Group’s previously heldinterests in the acquired entity are remeasured to fair value at the acquisitiondate and the resulting gain or loss is recognised in the income statement.142 <strong>Anglo</strong> <strong>American</strong> plc <strong>Annual</strong> <strong>Report</strong> <strong>2012</strong>
1. ACCOUNTING POLICIES continuedAmounts arising from interests in the acquiree prior to the acquisition datethat have previously been recognised in other comprehensive income arereclassified to the income statement, where such treatment would beappropriate if that interest were disposed of.Transaction costs incurred in connection with the business combination areexpensed. Provisional fair values are finalised within 12 months of theacquisition date.Goodwill in respect of subsidiaries and joint ventures is included withinintangible assets. Goodwill relating to associates is included within thecarrying value of the associate.Where the fair value of the identifiable net assets acquired exceeds the cost ofthe acquisition, the surplus, which represents the discount on the acquisition,is recognised directly in the income statement in the period of acquisition.For non-wholly owned subsidiaries, non-controlling interests are initiallyrecorded at the non-controlling interest’s proportion of the fair values ofnet assets recognised at acquisition.Property, plant and equipmentMining properties and leases include the cost of acquiring and developingmining properties and mineral rights.Mining properties are depreciated to their residual values using the unitof production method based on proven and probable ore reserves and,in certain limited circumstances, other mineral resources. Mineral resourcesare included in depreciation calculations where there is a high degree ofconfidence that they will be extracted in an economic manner. For diamondoperations, depreciation calculations are based on mineral reserves andresources included in the Life of Mine Plan. Depreciation is charged on newmining ventures from the date that the mining property is capable ofcommercial production. When there is little likelihood of a mineral right beingexploited, or the value of the exploitable mineral right has diminished belowcost, an impairment loss is recognised in the income statement.For open pit operations the removal of overburden or waste ore is requiredto obtain access to the orebody. To the extent that the actual waste materialremoved per tonne of ore mined (known as the stripping ratio) is higher thanthe average stripping ratio, costs associated with this process are deferredand charged to operating costs using the expected average stripping ratioover the life of the area being mined. This reflects the fact that waste removalis necessary to gain access to the orebody and therefore realise futureeconomic benefit. The average stripping ratio is calculated as the numberof tonnes of waste material expected to be removed during the Mine Life,per tonne of ore expected to be mined. The cost of stripping in any periodwill therefore be reflective of the average stripping ratio for the orebody asa whole applied to the actual stripping costs incurred. However, where the pitprofile is such that the actual stripping ratio is cumulatively below the average,no deferral takes place as this would result in the recognition of a liability forwhich there is no obligation. Instead, this position is monitored and when thecumulative calculation reflects a debit balance, deferral commences. Theaverage Mine Life stripping ratio is recalculated annually in light of additionalknowledge and changes in estimates. Changes in the Mine Life stripping ratioare accounted for prospectively as a change in estimate.Properties in the course of construction are measured at cost less anyrecognised impairment. Depreciation commences when the assets are readyfor their intended use. Buildings and plant and equipment are depreciated totheir residual values at varying rates on a straight line basis over theirestimated useful lives or the Mine Life, whichever is shorter. Estimated usefullives normally vary from up to 20 years for items of plant and equipment to amaximum of 50 years for buildings. Land is not depreciated.When parts of an item of property, plant and equipment have different usefullives, they are accounted for as separate items (major components).Depreciation methods, residual values and estimated useful lives arereviewed at least annually.Assets held under finance leases are depreciated over the shorter of the leaseterm and the estimated useful lives of the assets.Gains or losses on disposal of property, plant and equipment are determinedby comparing the proceeds from disposal with the carrying amount. The gainor loss is recognised in the income statement.Non-mining licences and other intangiblesNon-mining licences and other intangibles are measured at cost lessaccumulated amortisation and accumulated impairment losses. Intangibleassets acquired as part of an acquisition of a business are capitalisedseparately from goodwill if the asset is separable or arises from contractual orlegal rights and the fair value can be measured reliably on initial recognition.Intangible assets are amortised over their estimated useful lives, usuallybetween 3 and 20 years, except goodwill and those intangible assets thatare considered to have indefinite lives. For intangible assets with a finite life,the amortisation period is determined as the period over which the Groupexpects to obtain benefits from the asset, taking account of all relevant factsand circumstances including contractual lives and expectations about therenewal of contractual arrangements without significant incremental costs.An intangible asset is deemed to have an indefinite life when, based on ananalysis of all of the relevant factors, there is no foreseeable limit to the periodover which the asset is expected to generate cash flows for the Group.Amortisation methods, residual values and estimated useful lives arereviewed at least annually.Impairment of property, plant and equipment and intangibleassets excluding goodwillAt each reporting date, the Group reviews the carrying amounts of itsproperty, plant and equipment and intangible assets to determine whetherthere is any indication that those assets are impaired. If such an indicationexists, the recoverable amount of the asset is estimated in order to determinethe extent of any impairment. Where the asset does not generate cash flowsthat are independent from other assets, the Group estimates the recoverableamount of the cash generating unit (CGU) to which the asset belongs. Anintangible asset with an indefinite useful life is tested for impairment annuallyand whenever there is an indication that the asset may be impaired.Recoverable amount is the higher of fair value (less costs to sell) and value inuse. In assessing value in use, the estimated future cash flows are discountedto their present value using a pre-tax discount rate that reflects currentmarket assessments of the time value of money and the risks specific to theasset for which estimates of future cash flows have not been adjusted.If the recoverable amount of an asset or CGU is estimated to be less thanits carrying amount, the carrying amount of the asset or CGU is reducedto its recoverable amount. An impairment loss is recognised in the incomestatement as a special item.Where an impairment loss subsequently reverses, the carrying amountof the asset or CGU is increased to the revised estimate of its recoverableamount, but so that the increased carrying amount does not exceed thecarrying amount that would have been determined had no impairment beenrecognised for the asset or CGU. A reversal of an impairment loss isrecognised in the income statement as a special item.Impairment of goodwillGoodwill arising on business combinations is allocated to the group of CGUsthat is expected to benefit from synergies of the combination, and representsthe lowest level at which goodwill is monitored by the Group’s board ofdirectors for internal management purposes. The recoverable amount of theCGU or group of CGUs to which goodwill has been allocated, is tested forimpairment annually, or when events or changes in circumstances indicatethat it may be impaired.Any impairment loss is recognised immediately in the income statement asa special item. Impairment of goodwill is not subsequently reversed.Exploration, evaluation and development expenditureExploration and evaluation expenditure is expensed in the year in which it isincurred. When a decision is taken that a mining property is economicallyfeasible, all subsequent evaluation expenditure is capitalised within property,plant and equipment including, where applicable, directly attributablepre-production development expenditure. Capitalisation of such expenditureceases when the mining property is capable of commercial production.Exploration properties acquired are recognised in the balance sheet at costless any accumulated impairment losses. Such properties and capitalisedevaluation and pre-production development expenditure prior to commercialproduction are assessed for impairment in accordance with the Group’saccounting policy stated above.Financial statements<strong>Anglo</strong> <strong>American</strong> plc <strong>Annual</strong> <strong>Report</strong> <strong>2012</strong> 143
FINANCIAL STATEMENTS NOTES TO THE FINANCIAL STATEMENTS1. ACCOUNTING POLICIES continuedInventoryInventory and work in progress are measured at the lower of cost and netrealisable value. The production cost of inventory includes an appropriateproportion of depreciation and production overheads. Cost is determinedon the following bases:• Raw materials and consumables are measured at cost on a first in, first out(FIFO) basis or a weighted average cost basis.• Finished products are measured at raw material cost, labour cost anda proportion of manufacturing overhead expenses.• Metal and coal stocks are included within finished products and aremeasured at average cost.At precious metals operations that produce ‘joint products’, cost is allocatedamongst products according to the ratio of contribution of these metals togross sales revenues.Retirement benefitsThe Group operates both defined benefit and defined contribution pensionplans for its employees as well as post employment medical plans. Fordefined contribution plans the amount recognised in the income statement isthe contributions paid or payable during the year.For defined benefit pension and post employment medical plans, full actuarialvaluations are carried out every three years using the projected unit creditmethod and updates are performed for each financial year end. The averagediscount rate for the plans’ liabilities is based on AA rated corporate bonds ofa suitable duration and currency or, where there is no deep market for suchbonds, is based on government bonds. Pension plan assets are measuredusing year end market values.Actuarial gains and losses, which can arise from differences between expectedand actual outcomes or changes in actuarial assumptions, are recognisedimmediately in the statement of comprehensive income. Any increase in thepresent value of plan liabilities expected to arise from employee serviceduring the year is charged to operating profit. The expected return on planassets and the expected increase during the year in the present value of planliabilities are included in investment income and interest expense respectively.Past service cost is recognised immediately to the extent that the benefits arealready vested and otherwise is amortised on a straight line basis over theaverage period until the benefits vest.The retirement benefit obligation recognised in the balance sheet representsthe present value of the defined benefit obligation as adjusted for unrecognisedpast service costs and as reduced by the fair value of plan assets. Any assetresulting from this calculation is limited to past service cost, plus the presentvalue of available refunds and reductions in future contributions to the plan.TaxThe tax expense includes the current tax and deferred tax charge recognisedin the income statement.Current tax payable is based on taxable profit for the year. Taxable profitdiffers from net profit as reported in the income statement because itexcludes items of income or expense that are taxable or deductible in otheryears and it further excludes items that are not taxable or deductible. TheGroup’s liability for current tax is calculated using tax rates that have beenenacted or substantively enacted by the reporting date.Deferred tax is recognised in respect of temporary differences between thecarrying amounts of assets and liabilities for financial reporting purposes andthe amounts used for taxation purposes. Deferred tax liabilities are generallyrecognised for all taxable temporary differences and deferred tax assets arerecognised to the extent that it is probable that taxable profits will be availableagainst which deductible temporary differences can be utilised. Such assetsand liabilities are not recognised if the temporary differences arise from theinitial recognition of goodwill or of an asset or liability in a transaction (otherthan in a business combination) that affects neither taxable profit noraccounting profit.Deferred tax liabilities are recognised for taxable temporary differencesarising on investments in subsidiaries, joint ventures and associates exceptwhere the Group is able to control the reversal of the temporary differenceand it is probable that the temporary difference will not reverse in theforeseeable future.The carrying amount of deferred tax assets is reviewed at each reporting dateand is adjusted to the extent that it is no longer probable that sufficient taxableprofit will be available to allow all or part of the asset to be recovered.Deferred tax is calculated at the tax rates that are expected to apply in theperiod when the liability is settled or the asset is realised, based on the lawsthat have been enacted or substantively enacted by the reporting date.Deferred tax is charged or credited to the income statement, except whenit relates to items charged or credited directly to equity, in which case thedeferred tax is also taken directly to equity.Deferred tax assets and liabilities are offset when they relate to income taxeslevied by the same taxation authority and the Group intends to settle itscurrent tax assets and liabilities on a net basis in that taxation authority.LeasesIn addition to lease contracts, other significant contracts are assessed todetermine whether, in substance, they are or contain a lease. This includesassessment of whether the arrangement is dependent on use of a specificasset and the right to use that asset is conveyed through the contract.Rental costs under operating leases are recognised in the income statementin equal annual amounts over the lease term. Finance lease assets arerecognised as assets of the Group on inception of the lease at the lower of fairvalue or the present value of the minimum lease payments discounted at theinterest rate implicit in the lease.Non-current assets and disposal groups held for saleNon-current assets and disposal groups are classified as held for sale if theircarrying amount will be recovered through a sale transaction rather thanthrough continuing use. This condition is regarded as met only when a sale ishighly probable within one year from the date of classification, managementis committed to the sale and the asset or disposal group is available forimmediate sale in its present condition.Non-current assets and disposal groups are classified as held for sale fromthe date these conditions are met and are measured at the lower of carryingamount and fair value (less costs to sell). Any resulting impairment loss isrecognised in the income statement as a special item. On classification asheld for sale the assets are no longer depreciated. Comparative amountsare not adjusted.Environmental restoration and decommissioning obligationsAn obligation to incur environmental restoration, rehabilitation anddecommissioning costs arises when disturbance is caused by thedevelopment or ongoing production of a mining property. Such costsarising from the decommissioning of plant and other site preparation work,discounted to their net present value, are provided for and capitalised at thestart of each project, as soon as the obligation to incur such costs arises.These costs are recognised in the income statement over the life of theoperation, through the depreciation of the asset and the unwinding of thediscount on the provision. Costs for restoration of subsequent site damagewhich is created on an ongoing basis during production are provided forat their net present values and recognised in the income statement asextraction progresses.Changes in the measurement of a liability relating to the decommissioning ofplant or other site preparation work (that result from changes in the estimatedtiming or amount of the cash flow or a change in the discount rate), are addedto or deducted from the cost of the related asset in the current period. If adecrease in the liability exceeds the carrying amount of the asset, the excessis recognised immediately in the income statement. If the asset value isincreased and there is an indication that the revised carrying value is notrecoverable, an impairment test is performed in accordance with theaccounting policy set out above.For some South African operations annual contributions are made todedicated environmental rehabilitation trusts to fund the estimated cost ofrehabilitation during and at the end of the life of the relevant mine. The Groupexercises full control of these trusts and therefore the trusts are consolidated.The trusts’ assets are disclosed separately on the balance sheet as noncurrentassets. The trusts’ assets are measured based on the nature of theunderlying assets in accordance with accounting policies for similar assets.144 <strong>Anglo</strong> <strong>American</strong> plc <strong>Annual</strong> <strong>Report</strong> <strong>2012</strong>
1. ACCOUNTING POLICIES continuedForeign currency transactions and translationForeign currency transactions by Group companies are recognised in thefunctional currencies of the companies at the exchange rate ruling on the dateof the transaction. At each reporting date, monetary assets and liabilities thatare denominated in foreign currencies are retranslated at the rates prevailingon the reporting date. Gains and losses arising on retranslation are included inthe income statement for the period and are classified as either operating orfinancing depending on the nature of the monetary item giving rise to them.Non-monetary assets and liabilities that are measured in terms of historicalcost in a foreign currency are translated using the exchange rate at the dateof the transaction.On consolidation, the assets and liabilities of the Group’s foreign operationsare translated into the presentation currency of the Group at exchange ratesprevailing on the reporting date. Income and expense items are translated atthe average exchange rates for the period where these approximate the ratesat the dates of the transactions. Any exchange differences arising areclassified within the statement of comprehensive income and transferred tothe Group’s cumulative translation adjustment reserve. Exchange differenceson foreign currency balances with foreign operations for which settlement isneither planned nor likely to occur in the foreseeable future and thereforeform part of the Group’s net investment in these foreign operations are offsetin the cumulative translation adjustment reserve.Cumulative translation differences are recycled from equity and recognisedas income or expense on disposal of the operation to which they relate.Goodwill and fair value adjustments arising on the acquisition of foreign entitiesare treated as assets of the foreign entity and translated at the closing rate.Presentation currencyAs permitted by UK company law, the Group’s results are presented in USdollars, the currency in which its business is primarily conducted.Borrowing costsInterest on borrowings directly relating to the financing of qualifying capitalprojects under construction is added to the capitalised cost of those projectsduring the construction phase, until such time as the assets are substantiallyready for their intended use or sale which, in the case of mining properties,is when they are capable of commercial production. Where funds have beenborrowed specifically to finance a project, the amount capitalised representsthe actual borrowing costs incurred. Where the funds used to finance aproject form part of general borrowings, the amount capitalised is calculatedusing a weighted average of rates applicable to relevant general borrowingsof the Group during the period. All other borrowing costs are recognised inthe income statement in the period in which they are incurred.Share-based paymentsThe Group has applied the requirements of IFRS 2 Share-based Payment.In accordance with the transitional provisions, IFRS 2 has been applied to allgrants of equity instruments after 7 November 2002 that had not vested as at1 January 2005.The Group makes equity settled share-based payments to certain employees,which are measured at fair value at the date of grant and expensed on astraight line basis over the vesting period, based on the Group’s estimate ofshares that will eventually vest. For those share schemes with market relatedvesting conditions, the fair value is determined using the Monte Carlo methodat the grant date. The fair value of share options issued with non-market vestingconditions has been calculated using the Black Scholes model. For all othershare awards, the fair value is determined by reference to the market value ofthe shares at the grant date. For all share schemes with non-market vestingconditions, the likelihood of vesting has been taken into account whendetermining the relevant charge. Vesting assumptions are reviewed duringeach reporting period to ensure they reflect current expectations.Black economic empowerment (BEE) transactionsWhere the Group disposes of a portion of a South African based subsidiaryor operation to a BEE company at a discount to fair value, the transaction isconsidered to be a share-based payment (in line with the principle containedin South Africa interpretation AC 503 Accounting for Black EconomicEmpowerment (BEE) Transactions).The discount provided or value given is calculated in accordance with IFRS 2and included in the determination of the profit or loss on disposal.Employee benefit trustShares held by the employee benefit trust are recorded as own shares,and the carrying value is shown as a reduction within shareholders’ equity.Financial instrumentsFinancial assetsCash and cash equivalentsCash and cash equivalents comprise cash in hand and on demand deposits,together with short term, highly liquid investments that are readily convertibleto a known amount of cash and that are subject to an insignificant risk ofchanges in value. Bank overdrafts are shown within short term borrowings incurrent liabilities on the balance sheet. Cash and cash equivalents in the cashflow statement are shown net of overdrafts. Cash and cash equivalents aremeasured at amortised cost.Trade receivablesTrade receivables do not incur any interest, are principally short term in natureand are measured at their nominal value (with the exception of receivablesrelating to provisionally priced sales, as set out in the revenue recognitionaccounting policy), net of appropriate allowance for estimated irrecoverableamounts. Such allowances are raised based on an assessment of debtorageing, past experience or known customer circumstances.InvestmentsInvestments, other than investments in subsidiaries, joint ventures andassociates, are financial asset investments and are initially recognised at fairvalue. At subsequent reporting dates, financial assets that the Group has theexpressed intention and ability to hold to maturity (held to maturity) as well asloans and receivables are measured at amortised cost, less any impairmentlosses. The amortisation of any discount or premium on the acquisition ofa held to maturity investment is recognised in the income statement in eachperiod using the effective interest method.Investments other than those classified as held to maturity or loans andreceivables are classified as either at fair value through profit or loss (whichincludes investments held for trading) or available for sale financial assets.Both categories are subsequently measured at fair value. Where investmentsare held for trading purposes, unrealised gains and losses for the period areincluded in the income statement within other gains and losses. For availablefor sale investments, unrealised gains and losses are recognised in equity untilthe investment is disposed of or impaired, at which time the cumulative gain orloss previously recognised in equity is included in the income statement.Current financial asset investments consist mainly of bank term deposits andfixed and floating rate debt securities. Debt securities that are intended to beheld to maturity are measured at amortised cost, using the effective interestmethod. Debt securities that are not intended to be held to maturity arerecorded at the lower of cost and market value.Impairment of financial assets (including receivables)A financial asset not measured at fair value through profit or loss is assessedat each reporting date to determine whether there is any objective evidencethat it is impaired. A financial asset is impaired if objective evidence indicatesthat a loss event has occurred after the initial recognition of the asset.An impairment loss in respect of a financial asset measured at amortised costis calculated as the difference between its carrying amount and the presentvalue of the estimated cash flows discounted at the asset’s original effectiveinterest rate. Losses are recognised in the income statement. When asubsequent event causes the amount of impairment loss to decrease, thedecrease in impairment loss is reversed through the income statement.Impairment losses relating to available for sale investments are recognisedwhen the decline in fair value is considered significant or prolonged.These impairment losses are recognised by transferring the cumulativeloss that has been recognised in the statement of comprehensive incometo the income statement. The loss recognised in the income statement isthe difference between the acquisition cost and the current fair value.Financial statements<strong>Anglo</strong> <strong>American</strong> plc <strong>Annual</strong> <strong>Report</strong> <strong>2012</strong> 145
FINANCIAL STATEMENTS NOTES TO THE FINANCIAL STATEMENTS1. ACCOUNTING POLICIES continuedFinancial liabilities and equity instrumentsFinancial liabilities and equity instruments are classified and accounted foras debt or equity according to the substance of the contractual arrangementsentered into. An equity instrument is any contract that evidences a residualinterest in the assets of the Group after deducting all of its liabilities.Equity instrumentsEquity instruments issued by the Company are recorded at the proceedsreceived, net of direct issue costs.Trade payablesTrade payables are not interest bearing and are measured at their nominalvalue with the exception of amounts relating to purchases of provisionallypriced concentrate which are marked to market (using the appropriateforward price) until settled.Convertible debtConvertible bonds are classified as compound instruments, consisting ofa liability and an equity component. At the date of issue, the fair value of theliability component is estimated using the prevailing market interest rate forsimilar non-convertible debt and is recognised within borrowings and carriedat amortised cost. The difference between the proceeds of issue of theconvertible bond and the fair value assigned to the liability component,representing the embedded option to convert the liability into equity of theGroup, is included in equity.Issue costs are apportioned between the liability and equity componentsof the convertible bonds where appropriate based on their relative carryingamounts at the date of issue. The portion relating to the equity componentis charged directly against equity.The interest expense on the liability component is calculated by applyingthe effective interest rate for similar non-convertible debt to the liabilitycomponent of the instrument. The difference between this amount andthe interest paid is added to the carrying amount of the liability.Bank borrowingsInterest bearing bank loans and overdrafts are initially recognised at fairvalue, net of directly attributable transaction costs. Finance charges,including premiums payable on settlement or redemption and direct issuecosts are recognised in the income statement using the effective interestmethod. They are added to the carrying amount of the instrument to theextent that they are not settled in the period in which they arise.Derivative financial instruments and hedge accountingIn order to hedge its exposure to foreign exchange, interest rate andcommodity price risk, the Group enters into forward, option and swapcontracts. The Group does not use derivative financial instruments forspeculative purposes. Commodity based (normal purchase or normal sale)contracts that meet the scope exemption in IAS 39 Financial Instruments:Recognition and Measurement are recognised in earnings when they aresettled by physical delivery.All derivatives are held at fair value in the balance sheet within ‘Derivativefinancial assets’ or ‘Derivative financial liabilities’ except if they are linkedto settlement and delivery of an unquoted equity instrument and the fairvalue cannot be measured reliably, in which case they are carried at cost.A derivative cannot be measured reliably where the range of reasonablefair value estimates is significant and the probabilities of various estimatescannot be reasonably assessed.Changes in the fair value of derivative financial instruments that aredesignated and effective as hedges of future cash flows (cash flow hedges)are recognised directly in equity. The gain or loss relating to the ineffectiveportion is recognised immediately in the income statement. If the cash flowhedge of a firm commitment or forecast transaction results in the recognitionof a non-financial asset or liability, then, at the time the asset or liability isrecognised, the associated gains or losses on the derivative that hadpreviously been recognised in equity are included in the initial measurementof the asset or liability.For hedges that do not result in the recognition of a non-financial asset orliability, amounts deferred in equity are recognised in the income statementin the same period in which the hedged item affects profit or loss. For aneffective hedge of an exposure to changes in fair value, the hedged item isadjusted for changes in fair value attributable to the risk being hedged.The corresponding entry, along with gains or losses from remeasuring theassociated derivative, are recognised in the income statement.The gain or loss on hedging instruments relating to the effective portionof a net investment hedge is recognised in equity (part of the cumulativetranslation adjustment reserve). The ineffective portion is recognisedimmediately in the income statement. Gains or losses accumulated in thecumulative translation adjustment reserve are included in the incomestatement on disposal of the foreign operations to which they relate.Hedge accounting is discontinued when the hedging instrument expires or issold, terminated, exercised, revoked, or no longer qualifies for hedge accounting.At that time, any cumulative gain or loss on the hedging instrument recognisedin equity is retained until the forecast transaction occurs. If a hedge transactionis no longer expected to occur, the net cumulative gain or loss previouslyrecognised in equity is included in the income statement for the period.Changes in the fair value of any derivative instruments that are not designatedin a hedge relationship are recognised immediately in the income statementand are classified within other gains and losses or net finance costsdepending on the type of risk to which the derivative relates.Derivatives embedded in other financial instruments or non-financial hostcontracts are treated as separate derivatives when their risks andcharacteristics are not closely related to those of their host contracts and thehost contracts themselves are not carried at fair value with unrealised gainsor losses reported in the income statement.Derecognition of financial assets and financial liabilitiesFinancial assets are derecognised when the right to receive cash flows fromthe asset has expired, the right to receive cash flows has been retained butan obligation to on-pay them in full without material delay has been assumedor the right to receive cash flows has been transferred together withsubstantially all the risks and rewards of ownership.Financial liabilities are derecognised when the associated obligation hasbeen discharged, cancelled or has expired.New IFRS accounting standards and interpretationsnot yet adoptedThe following new or amended IFRS accounting standards and interpretationsnot yet adopted are expected to have a significant impact on the Group:IFRS 9 Financial Instruments – Classification and Measurement reflects thefirst phase of the IASB’s three stage project to replace IAS 39. The first phasedeals with the classification and measurement of financial assets and financialliabilities. The standard applies to annual periods beginning on or after1 January 2015.IFRS 11 Joint Arrangements replaces IAS 31 Interests in Joint Ventures andSIC-13 Jointly-controlled Entities – Non-monetary Contributions by Venturers.Under IFRS 11 a joint arrangement is classified as either a joint operation or ajoint venture, and the option to proportionately consolidate joint ventures hasbeen removed. Interests in joint ventures must be equity accounted. Thisstandard is effective for annual periods beginning on or after 1 January 2014although early adoption is permitted.IFRS 12 Disclosures of Interests in Other Entities will accompany IFRS 10Consolidated Financial Statements and IFRS 11. This standard combines thedisclosure requirements previously covered by IAS 27 Consolidated andSeparate Financial Statements, related to consolidated financial statements,IAS 31 and IAS 28 Investments in Associates, as well as including additionaldisclosure requirements. This standard is effective for annual periodsbeginning on or after 1 January 2014 although early adoption is permitted.IFRIC 20 Stripping Costs in the Production Phase of a Surface Mine providesa model for accounting for costs associated with the removal of wasteduring the production phase of a surface mine, including guidance on theapportionment of the costs incurred for obtaining a current and future benefitand how capitalised costs are depreciated. This interpretation applies toannual periods beginning on or after 1 January 2013.As explained above, the Group currently defers costs associated with theremoval of overburden or waste material such that the cost of stripping in anyperiod is reflective of the average stripping ratio for the orebody as a wholeapplied to the actual stripping costs incurred. Amounts deferred on this basiswill only be carried forward under IFRIC 20 where they relate to existingcomponents of the orebody.146 <strong>Anglo</strong> <strong>American</strong> plc <strong>Annual</strong> <strong>Report</strong> <strong>2012</strong>
1. ACCOUNTING POLICIES continuedAmounts deferred to date which do not relate to existing components of theorebody will be written off to reserves.The following new or amended IFRS accounting standards not yet adoptedare not expected to have a significant impact on the Group:IFRS 10 replaces the portion of IAS 27 that addresses accounting forconsolidated financial statements and SIC-12 Consolidation – SpecialPurpose Entities. IFRS 10 provides a single basis for consolidation with a newdefinition of control. The standard is effective for annual periods beginning onor after 1 January 2014 although early adoption is permitted.IFRS 13 Fair Value Measurement provides a single framework for all fairvalue measurements and applies to annual periods beginning on or after1 January 2013.The amendment to IAS 1 Presentation of Financial Statements requires itemsto be grouped in other comprehensive income based on whether those itemsare subsequently reclassified to profit or loss. The amendment is to be appliedfor annual periods beginning on or after 1 July <strong>2012</strong>.The amendment to IAS 19 Employee Benefits is to be applied retrospectivelyfor annual periods beginning on or after 1 January 2013.Amendments have been made to IAS 27 Consolidated and Separate FinancialStatements and it has been reissued as IAS 27 Separate FinancialStatements. The revised standard prescribes the accounting and disclosurerequirements for investments in subsidiaries, joint ventures and associateswhen an entity prepares separate financial statements. The accounting anddisclosure requirements for investments in subsidiaries, joint ventures andassociates in consolidated financial statements are prescribed by IFRS 10,IFRS 11 and IFRS 12. The revised standard is to be applied for annual periodsbeginning on or after 1 January 2014 although early adoption is permitted.Amendments have been made to IAS 28 Investments in Associates and ithas been reissued as IAS 28 Investments in Associates and Joint Ventures.The revised standard prescribes the application of the equity method whenaccounting for investments in associates and joint ventures. The revisedstandard is to be applied for annual periods beginning on or after1 January 2014 although early adoption is permitted.Amendments to IFRS 1 Government loans and to IFRS 7 Disclosures –Offsetting Financial Assets and Financial Liabilities are effective for annualperiods beginning on or after 1 January 2013.The amendment to IAS 32 Financial Instruments – Presentation is effectivefor annual periods beginning on or after 1 January 2014.Critical accounting judgements and key sources of estimationand uncertaintyIn the course of preparing financial statements, management necessarilymakes judgements and estimates that can have a significant impact on thefinancial statements. The most critical of these relate to estimation of theore reserves and useful economic lives of assets, impairment of assets, fairvaluation of net assets on acquisition, restoration, rehabilitation andenvironmental costs, retirement benefits, financial assets and liabilities at fairvalue through profit and loss and contingent liabilities. These are detailedbelow. The use of inaccurate assumptions in calculations for any of theseestimates could result in a significant impact on financial results.Ore Reserve estimates and useful economic lives of assetsWhen determining Ore Reserves, which may be used to calculate depreciationon the Group’s mining properties, assumptions that were valid at the time ofestimation may change when new information becomes available. Any changescould affect prospective depreciation rates and asset carrying values.The calculation of the unit of production rate of amortisation could be impactedto the extent that actual production in the future is different from current forecastproduction based on proven and probable mineral reserves. Factors which couldimpact useful economic lives of assets and Ore Reserve estimates include:• changes to Proved and Probable Reserves• the grade of Ore Reserves varying significantly from time to time• differences between actual commodity prices and commodity priceassumptions used in the estimation of mineral reserves• renewal of mining licences• unforeseen operational issues at mine sites• adverse changes in capital, operating, mining, processing and reclamationcosts, discount rates and foreign exchange rates used to determinemineral reservesFor property, plant and equipment depreciated on a straight line basis overits useful economic life, management reviews the appropriateness of usefuleconomic life at least annually and any changes could affect prospectivedepreciation rates and asset carrying values.Impairment of assetsIn making assessments for impairment, management necessarily applies itsjudgement in allocating assets that do not generate independent cash flowsto appropriate CGUs, and also in estimating the timing and value of underlyingcash flows within the calculation of recoverable amount. Factors which couldimpact underlying cash flows include:• commodity prices and exchange rates• timelines of granting of licences and permits• capital and operating expenditure• available reserves and resources and future production profileSubsequent changes to the CGU allocation or to the timing of or assumptionsused to determine cash flows could impact the carrying value of therespective assets, see note 14.Fair valuation of net assets on acquisitionThe Group applies the acquisition method of accounting for acquisitions.This requires all identifiable assets, liabilities and contingent liabilities ofa subsidiary, joint venture entity or an associate acquired on the date controlis obtained, which can be measured reliably, to be recognised at theirprovisional fair values at the date of acquisition.The fair value of identifiable assets and liabilities is determined usingdiscounted cash flows or other valuation techniques using assumptionsconsidered to be reasonable and consistent with those that would be appliedby a market participant. The assessment of assumptions used in determiningthe fair value of identifiable assets and liabilities is inherently subjective andthe use of inaccurate valuation assumptions could result in a significantimpact on financial results.Restoration, rehabilitation and environmental costsCosts for restoration of site damage, rehabilitation and environmental costsare estimated using either the work of external consultants or internalexperts. Management uses its judgement and experience to provide for andamortise these estimated costs over the life of the mine.Retirement benefitsThe expected costs of providing pensions and post employment benefitsunder defined benefit arrangements relating to employee service during theperiod are determined based on financial and actuarial assumptions.Assumptions in respect of the expected costs are set after consultation withqualified actuaries. While management believes the assumptions used areappropriate, a change in the assumptions used would impact the Group’sother comprehensive income going forward.Financial assets and liabilities at fair value through profit and lossThe fair value of the Group’s financial assets and liabilities held at fair valuethough profit and loss represents the market value of quoted investments andother traded instruments where available. For financial assets and liabilitiesheld at fair value through profit and loss for which market prices are notreadily available, fair value is determined using discounted cash flows orother valuation techniques using assumptions considered to be reasonableand consistent with those that would be used by a market participant.The assessment of assumptions used in applying valuation techniques isinherently subjective and the use of inaccurate assumptions could resultin a significant impact on financial results.Contingent liabilitiesOn an ongoing basis the Group is a party to various legal disputes, theoutcomes of which cannot be assessed with a high degree of certainty.A liability is recognised where, based on the Group’s legal views and advice,it is considered probable that an outflow of resources will be required to settlea present obligation that can be measured reliably. Disclosure of othercontingent liabilities is made in note 35 unless the possibility of a loss arisingis considered remote.Financial statements<strong>Anglo</strong> <strong>American</strong> plc <strong>Annual</strong> <strong>Report</strong> <strong>2012</strong> 147
FINANCIAL STATEMENTS NOTES TO THE FINANCIAL STATEMENTS2. SEGMENTAL INFORMATIONThe Group’s segments are aligned to the structure of business units based around core commodities. Each business unit has a management team thatis accountable to the Chief Executive. The Kumba Iron Ore, Iron Ore Brazil and Samancor business units have been aggregated as the Iron Ore and Manganesesegment on the basis of the ultimate product produced (ferrous metals).Phosphates and Niobium (previously Copebrás and Catalão) are reported in the Other Mining and Industrial segment. Following a strategic review during thefirst half of the year, Amapá was transferred to the Other Mining and Industrial business unit, and accordingly is presented as part of the Other Mining andIndustrial segment. It was previously reported as part of the Iron Ore and Manganese segment. Comparatives have been reclassified to align with current yearpresentation. Tarmac is not considered to be individually significant to the Group and is therefore also presented in the Other Mining and Industrial segment.Until November <strong>2012</strong> this reporting segment also included Scaw South Africa.On 16 August <strong>2012</strong> the Group acquired a controlling interest in De Beers (Diamonds segment). Until this date De Beers was accounted for as an associate ofthe Group. From 16 August <strong>2012</strong> De Beers ceased to be an associate and has been accounted for as a subsidiary of the Group. For details of this acquisition,see note 32.The Group’s Executive Committee evaluates the financial performance of the Group and its segments principally with reference to underlying operating profit.Underlying operating profit is presented before special items and remeasurements and includes the Group’s attributable share of associates’ operating profitbefore special items and remeasurements.Segment revenue includes the Group’s attributable share of associates’ revenue. Segments predominantly derive revenue as follows – Iron Ore andManganese: iron ore, manganese ore and alloys; Metallurgical Coal: metallurgical coal; Thermal Coal: thermal coal; Copper and Nickel: base metals; Platinum:platinum group metals; Diamonds: rough and polished diamonds and diamond jewellery; and Other Mining and Industrial: phosphates, niobium, heavy buildingmaterials, iron ore, and, until November <strong>2012</strong>, steel products.The Exploration segment includes the cost of the Group’s exploration activities across all segments.The segment results are stated after elimination of inter-segment transactions and include an allocation of corporate costs.Analysis by segmentRevenue and operating (loss)/profit by segmentUnderlying operatingRevenue (1)(loss)/profit (2)US$ million <strong>2012</strong> 2011 <strong>2012</strong> 2011Iron Ore and Manganese 6,403 7,643 2,949 4,400Metallurgical Coal 3,889 4,347 405 1,189Thermal Coal 3,447 3,722 793 1,230Copper 5,122 5,144 1,687 2,461Nickel 336 488 26 57Platinum 5,489 7,359 (120) 890Diamonds 4,028 3,320 496 659Other Mining and Industrial 4,066 4,520 337 315Exploration – – (206) (121)Corporate Activities and Unallocated Costs 5 5 (203) 15Segment measure 32,785 36,548 6,164 11,095Reconciliation:Less: associates (4,024) (5,968) (759) (1,427)Operating special items and remeasurements – – (7,093) (229)Statutory measure 28,761 30,580 (1,688) 9,439(1)Segment revenue includes the Group’s attributable share of associates’ revenue. This is reconciled to Group revenue from subsidiaries and joint ventures as presented in the Consolidatedincome statement.(2)Segment underlying operating (loss)/profit is revenue less operating costs before special items and remeasurements, and includes the Group’s attributable share of associates’ operating profitbefore special items and remeasurements. This is reconciled to operating (loss)/profit from subsidiaries and joint ventures after special items and remeasurements as presented in theConsolidated income statement.Associates’ revenue and underlying operating profitAssociates’ underlyingAssociates’ revenueoperating profit/(loss) (1)US$ million <strong>2012</strong> 2011 <strong>2012</strong> 2011Iron Ore and Manganese 831 926 104 165Metallurgical Coal 315 372 111 207Thermal Coal 970 1,080 355 482Platinum 231 269 (63) (86)Diamonds 1,675 3,320 252 659Other Mining and Industrial 2 1 – –4,024 5,968 759 1,427Reconciliation:Associates’ net finance costs (58) (48)Associates’ income tax expense (202) (385)Associates’ non-controlling interests (6) (16)Share of net income from associates (before special items and remeasurements) 493 978Associates’ special items and remeasurements (57) (5)Associates’ special items and remeasurements tax (3) 1Associates’ non-controlling interests on special items and remeasurements (1) 3Share of net income from associates 432 977(1)Associates’ underlying operating profit/(loss) is the Group’s attributable share of associates’ revenue less operating costs before special items and remeasurements.148 <strong>Anglo</strong> <strong>American</strong> plc <strong>Annual</strong> <strong>Report</strong> <strong>2012</strong>
2. SEGMENTAL INFORMATION continuedNon-cash itemsSignificant non-cash items included within underlying operating profit are as follows:Depreciation and amortisation (1) Other non-cash expenses (2)US$ million <strong>2012</strong> 2011 <strong>2012</strong> 2011Iron Ore and Manganese 199 153 31 95Metallurgical Coal 458 375 140 104Thermal Coal 125 128 30 30Copper 492 289 98 124Nickel 24 27 25 10Platinum 658 729 81 76Diamonds 142 – 52 –Other Mining and Industrial 148 225 (59) 83Exploration – – 3 3Corporate Activities and Unallocated Costs 43 41 70 54(3)2,289(3)1,967 471 579(1)In addition the Group’s attributable share of associates’ depreciation and amortisation is $233 million (2011: $286 million). This is split by segment as follows: Iron Ore and Manganese $50 million(2011: $33 million), Metallurgical Coal $14 million (2011: $13 million), Thermal Coal $54 million (2011: $52 million), Platinum $42 million (2011: $53 million) and Diamonds $73 million(2011: $135 million).(2)Other non-cash expenses include equity settled share-based payment charges and amounts included in operating costs in respect of provisions, excluding amounts recorded within special items.(3)In addition $70 million (2011: $84 million) of accelerated depreciation and $41 million (2011: nil) of depreciation and amortisation charges arising due to the fair value uplift of the pre-existing45% shareholding of De Beers have been recorded within operating special items and remeasurements (see note 5), and $81 million (2011: $39 million) of pre-commercial productiondepreciation has been capitalised.Capital expenditure and net debtCapital expenditure (1) Net debt (2)US$ million <strong>2012</strong> 2011 <strong>2012</strong> 2011Iron Ore and Manganese 2,077 1,659 1,112 1,277Metallurgical Coal 1,028 695 (510) (211)Thermal Coal 266 190 32 81Copper 996 1,570 (775) (781)Nickel 100 398 477 603Platinum 822 970 98 20Diamonds 94 – 839 –Other Mining and Industrial 260 225 (45) 272Exploration 6 1 (8) (6)Corporate Activities and Unallocated Costs 29 56 7,608 1195,678 5,764 8,828 1,374Net (cash) in disposal groups (3) (213) –8,615 1,374Reconciliation:Remove: cash flows from derivatives relating to capital expenditure (71) 439Purchase of property, plant and equipment 5,607 6,203Interest capitalised 280 321Non-cash movements (4) 120 27Property, plant and equipment additions in disposal groups (50) (2)Property, plant and equipment additions (5) 5,957 6,549Financial statements(1)Capital expenditure is segmented on a cash basis and is reconciled to balance sheet additions. Cash capital expenditure includes cash flows on related derivatives.(2)Segment net debt includes related hedges and excludes net debt in disposal groups. For a reconciliation of net debt to the balance sheet, see note 31b.(3)Previously reported within the Other Mining and Industrial segment, see note 34.(4)Includes movements on capital expenditure accruals, movements relating to deferred stripping and the impact of realised cash flow hedges.(5)Property, plant and equipment additions are split by segment as follows: Iron Ore and Manganese $2,143 million (2011: $2,052 million), Metallurgical Coal $980 million (2011: $681 million),Thermal Coal $277 million (2011: $231 million), Copper $1,069 million (2011: $1,877 million), Nickel $207 million (2011: $405 million), Platinum $865 million (2011: $1,014 million), Diamonds$172 million (2011: nil), Other Mining and Industrial $207 million (2011: $232 million), Exploration $6 million (2011: $1 million) and Corporate Activities and Unallocated Costs $31 million(2011: $56 million).<strong>Anglo</strong> <strong>American</strong> plc <strong>Annual</strong> <strong>Report</strong> <strong>2012</strong> 149
FINANCIAL STATEMENTS NOTES TO THE FINANCIAL STATEMENTS2. SEGMENTAL INFORMATION continuedSegment assets and liabilitiesThe following balance sheet segment measures are provided for information:Segment assets (1) Segment liabilities (2) Net segment assets/(liabilities)US$ million <strong>2012</strong> 2011 <strong>2012</strong> 2011 <strong>2012</strong> 2011Iron Ore and Manganese 9,837 12,909 (481) (482) 9,356 12,427Metallurgical Coal 6,078 5,660 (859) (968) 5,219 4,692Thermal Coal 2,726 2,650 (761) (764) 1,965 1,886Copper 9,662 8,767 (1,126) (1,124) 8,536 7,643Nickel 2,613 2,655 (104) (120) 2,509 2,535Platinum 11,490 12,288 (1,071) (1,097) 10,419 11,191Diamonds 14,412 – (1,468) – 12,944 –Other Mining and Industrial 960 4,660 (174) (817) 786 3,843Exploration 8 2 (4) (3) 4 (1)Corporate Activities and Unallocated Costs 424 375 (709) (584) (285) (209)58,210 49,966 (6,757) (5,959) 51,453 44,007Other assets and liabilitiesInvestments in associates (3) 3,063 5,240 – – 3,063 5,240Financial asset investments 2,380 2,896 – – 2,380 2,896Deferred tax assets/(liabilities) 1,223 530 (6,069) (5,730) (4,846) (5,200)Derivative financial assets/(liabilities) 848 840 (1,081) (1,112) (233) (272)Cash and cash equivalents 9,094 11,732 – – 9,094 11,732Other non-operating assets/(liabilities) 1,401 1,238 (1,660) (2,715) (259) (1,477)Borrowings – – (17,754) (12,873) (17,754) (12,873)Other provisions for liabilities and charges – – (1,342) (864) (1,342) (864)Assets/(liabilities) classified as held for sale (4) 3,150 – (919) – 2,231 –Net assets 79,369 72,442 (35,582) (29,253) 43,787 43,189(1)Segment assets are operating assets and consist of intangible assets of $4,571 million (2011: $2,322 million), property, plant and equipment of $45,089 million (2011: $40,549 million),environmental rehabilitation trusts of $393 million (2011: $360 million), biological assets of $19 million (2011: $17 million), retirement benefit assets of $176 million (2011: $70 million),inventories of $5,005 million (2011: $3,517 million) and operating receivables of $2,957 million (2011: $3,131 million).(2)Segment liabilities are operating liabilities and consist of non-interest bearing current liabilities of $3,742 million (2011: $3,982 million), environmental restoration and decommissioningprovisions of $1,606 million (2011: $1,338 million) and retirement benefit obligations of $1,409 million (2011: $639 million).(3)See note 17 for a split of investments in associates by segment.(4)Previously reported in the Other Mining and Industrial segment, see note 34.Revenue by productThe Group’s analysis of segment revenue by product is as follows:US$ million <strong>2012</strong> 2011Iron ore 5,508 6,830Manganese ore and alloys 831 926Metallurgical coal 3,048 3,444Thermal coal 4,287 4,621Copper 5,038 5,023Nickel 678 948Platinum 3,441 4,578Palladium 906 1,076Rhodium 389 703Diamonds 4,027 3,320Phosphates 597 571Heavy building materials 2,171 2,347Steel products 798 931Other 1,066 1,23032,785 36,548150 <strong>Anglo</strong> <strong>American</strong> plc <strong>Annual</strong> <strong>Report</strong> <strong>2012</strong>
2. SEGMENTAL INFORMATION continuedGeographical analysisRevenue by destination and non-current segment assets by locationThe Group’s geographical analysis of segment revenue allocated based on the country in which the customer is located, and non-current segment assets,allocated based on the country in which the assets are located, is as follows:Revenue Non-current segment assets (1)US$ million <strong>2012</strong> 2011 <strong>2012</strong> 2011South Africa 3,115 3,589 16,452 15,215Other Africa 715 618 8,029 357Brazil 1,093 1,177 8,700 12,622Chile 1,241 2,030 7,470 7,001Other South America 46 50 623 655North America 1,274 1,861 2,205 685Australia 340 312 4,673 4,170China 5,927 6,446 – –India 2,544 2,343 – –Japan 4,049 4,925 – –Other Asia 3,595 3,487 31 47United Kingdom (<strong>Anglo</strong> <strong>American</strong> plc’s country of domicile) 3,781 3,962 1,325 2,117Other Europe 5,065 5,748 152 232,785 36,548 49,660 42,871(1)Non-current segment assets are non-current operating assets and consist of intangible assets and property, plant and equipment.Revenue and underlying operating profit by originSegment revenue and underlying operating profit by origin are provided for information:Underlying operatingRevenueprofit/(loss)US$ million <strong>2012</strong> 2011 <strong>2012</strong> 2011South Africa 14,592 17,855 3,335 6,059Other Africa 3,256 2,763 437 501Brazil 1,274 1,404 200 152Chile 5,122 5,170 1,863 2,581Other South America 1,131 1,364 304 512North America 559 615 (138) 256Australia and Asia 4,616 5,058 465 1,318Europe 2,235 2,319 (302) (284)32,785 36,548 6,164 11,095Segment assets and liabilities by locationThe Group’s geographical analysis of segment assets and liabilities, allocated based on where assets and liabilities are located, are provided for information:Financial statementsSegment assets (1) Segment liabilities Net segment assetsUS$ million <strong>2012</strong> 2011 <strong>2012</strong> 2011 <strong>2012</strong> 2011South Africa 20,155 18,364 (2,922) (2,620) 17,233 15,744Other Africa 8,313 385 (202) (20) 8,111 365Brazil 9,124 13,188 (244) (303) 8,880 12,885Chile 8,695 7,950 (1,094) (1,101) 7,601 6,849Other South America 717 808 (55) (48) 662 760North America 2,500 782 (298) (107) 2,202 675Australia and Asia 5,900 5,450 (838) (953) 5,062 4,497Europe 2,806 3,039 (1,104) (807) 1,702 2,23258,210 49,966 (6,757) (5,959) 51,453 44,007(1)Investments in associates of $3,063 million (2011: $5,240 million) are not included in segment assets. The geographical distribution of these investments, based on the location of theunderlying assets, is disclosed in note 17.<strong>Anglo</strong> <strong>American</strong> plc <strong>Annual</strong> <strong>Report</strong> <strong>2012</strong> 151
FINANCIAL STATEMENTS NOTES TO THE FINANCIAL STATEMENTS3. OPERATING (LOSS)/PROFIT FROM SUBSIDIARIES AND JOINT VENTURESUS$ million <strong>2012</strong> 2011Group revenue 28,761 30,580Cost of sales (1) (25,993) (17,343)Gross profit 2,768 13,237Selling and distribution costs (2,031) (1,788)Administrative expenses (2,127) (2,034)Other gains and losses (see below) (92) 145Exploration expenditure (see note 7) (206) (121)Operating (loss)/profit from subsidiaries and joint ventures (1,688) 9,439(1)Includes operating special item charges of $6,977 million (2011: $164 million), see note 5. Operating remeasurements are included in ‘Other gains and losses’, see below.US$ million <strong>2012</strong> 2011Operating (loss)/profit is stated after charging/(crediting):Depreciation of property, plant and equipment (see note 15) (1) 2,258 1,947Amortisation of intangible assets (see note 14) (2) 31 20Rentals under operating leases 182 128Project evaluation expenditure 525 418Research and development expenditure 80 38Operating special items (see note 5) 6,977 164Employee costs (see note 8) 5,033 4,707Adjustment due to provisional pricing (3) (14) 286Royalties (4) 554 742Other gains and losses comprise:Operating remeasurements (see note 5) (116) (65)Other fair value gains/(losses) on derivatives – realised 9 (57)Foreign exchange gains on other monetary items 12 256Fair value gains on biological assets 3 11Total other gains and losses (92) 145(1)In addition $70 million (2011: $84 million) of accelerated depreciation and $35 million (2011: nil) of depreciation arising due to the fair value uplift of the Group’s pre-existing 45% shareholding inDe Beers have been recorded within operating special items and remeasurements (see note 5) and $81 million (2011: $39 million) of pre-commercial production depreciation has been capitalised.(2)In addition $6 million of amortisation arising due to the fair value uplift of the Group’s pre-existing 45% shareholding in De Beers has been included within operating remeasurements.(3)Provisionally priced contracts resulted in a total (realised and unrealised) gain in revenue of $37 million (2011: loss of $283 million) and total (realised and unrealised) loss in operating costsof $23 million (2011: $3 million).(4)Excludes those royalties which meet the definition of income tax on profit and accordingly have been accounted for as taxes.Auditor remunerationPaid/payableto auditor (ifPaid/payable to Deloitte not Deloitte)UnitedKingdom Overseas Total Overseas<strong>2012</strong> 2011Paid/payableto auditor (ifPaid/payable to Deloitte not Deloitte)UnitedKingdom Overseas Total OverseasUS$ millionPaid to the Company’s auditor for auditof the <strong>Anglo</strong> <strong>American</strong> plc <strong>Annual</strong> <strong>Report</strong> 2.2 4.8 7.0 0.1 1.7 4.3 6.0 0.1Paid to the Company’s auditor for otherservices to the GroupAudit of the Company’s subsidiaries 1.1 4.8 5.9 1.1 0.7 3.2 3.9 0.6Total audit fees 3.3 9.6 12.9 1.2 2.4 7.5 9.9 0.7Audit related assurance services (1) 0.8 1.0 1.8 – 0.5 0.8 1.3 0.1Taxation compliance services – 0.2 0.2 0.3 – 0.1 0.1 0.1Taxation advisory services 0.2 0.2 0.4 0.1 0.4 0.3 0.7 0.2Other assurance services (2) 0.4 1.3 1.7 0.6 0.2 1.4 1.6 0.5Total non-audit fees 1.4 2.7 4.1 1.0 1.1 2.6 3.7 0.9(1)Includes $1.3 million (2011: $1.3 million) for the interim review.(2)Includes $0.1 million (2011: $0.1 million) for the audit of Group pension plans.152 <strong>Anglo</strong> <strong>American</strong> plc <strong>Annual</strong> <strong>Report</strong> <strong>2012</strong>
4. OPERATING PROFIT AND UNDERLYING EARNINGS BY SEGMENTThe following table analyses operating profit (including attributable share of associates’ operating profit) by segment and reconciles it to underlying earningsby segment. In <strong>2012</strong> Amapá has been reclassified from the Iron Ore and Manganese segment to the Other Mining and Industrial segment to align with internalmanagement reporting. Comparatives have been reclassified to align with current presentation.Underlying earnings is an alternative earnings measure, which the directors consider to be a useful additional measure of the Group’s performance.Underlying earnings is profit for the financial year attributable to equity shareholders of the Company before special items and remeasurements and istherefore presented after net finance costs, income tax expense and non-controlling interests. For a reconciliation from ‘(Loss)/profit for the financial yearattributable to equity shareholders of the Company’ to ‘Underlying earnings for the financial year’, see note 13.US$ millionOperatingprofit/(loss)before specialitems andremeasurements(1)Operatingspecialitems andremeasurements(note 5)Operatingprofit/(loss)after specialitems andremeasurementsNet financecosts, incometax expenseand noncontrollinginterestsUnderlyingearnings<strong>2012</strong> 2011Operatingprofit/(loss)before specialitems andremeasurements(1)Operatingspecialitems andremeasurements(note 5)Operatingprofit/(loss)after specialitems andremeasurementsNet financecosts, incometax expenseand noncontrollinginterestsUnderlyingearningsIron Ore andManganese 2,949 5,139 (2,190) (1,912) 1,037 4,400 79 4,321 (2,943) 1,457Metallurgical Coal 405 365 40 (130) 275 1,189 – 1,189 (345) 844Thermal Coal 793 (1) 794 (270) 523 1,230 (1) 1,231 (328) 902Copper 1,687 (9) 1,696 (779) 908 2,461 1 2,460 (851) 1,610Nickel 26 184 (158) (15) 11 57 72 (15) (34) 23Platinum (120) 921 (1,041) (105) (225) 890 6 884 (480) 410Diamonds 496 456 40 (184) 312 659 18 641 (216) 443Other Mining andIndustrial 337 28 309 (108) 229 315 70 245 (140) 175Exploration (206) – (206) 11 (195) (121) – (121) 3 (118)Corporate Activitiesand Unallocated Costs (203) 68 (271) 167 (36) 15 2 13 359 374Total 6,164 7,151 (987) (3,325) 2,839 11,095 247 10,848 (4,975) 6,120Analysed as:Core operations 5,996 7,127 (1,131) (3,278) 2,718 10,964 177 10,787 (4,910) 6,054Non-coreoperations (2) 168 24 144 (47) 121 131 70 61 (65) 66(1)Operating profit/(loss) before special items and remeasurements includes attributable share of associates’ operating profit before special items and remeasurements which is reconciled to‘Share of net income from associates’ in note 2.(2)Non-core operations relate to Amapá, Tarmac and, until November <strong>2012</strong>, Scaw South Africa.Underlying earnings by originUS$ million <strong>2012</strong> 2011South Africa 1,449 2,726Other Africa 357 326South America 1,359 2,080North America (198) 218Australia and Asia 336 967Europe (464) (197)2,839 6,120Financial statements5. SPECIAL ITEMS AND REMEASUREMENTSSpecial items are those items of financial performance that the Group believes should be separately disclosed on the face of the income statement to assistin the understanding of the underlying financial performance achieved by the Group. Such items are material by nature or amount to the year’s results andrequire separate disclosure in accordance with IAS 1 paragraph 97. Special items that relate to the operating performance of the Group are classified asoperating special items and principally include impairment charges. Non-operating special items include profits and losses on disposals of investments andbusinesses as well as certain adjustments relating to business combinations.Remeasurements comprise other items which the Group believes should be reported separately to aid an understanding of the underlying financialperformance of the Group. This category includes:• Unrealised gains and losses on ‘non-hedge’ derivative instruments open at the year end (in respect of future transactions) and the reversal of the historicalmarked to market value of such instruments settled in the year. Where the underlying transaction is recorded in the income statement, the realised gains orlosses are recorded in underlying earnings in the same year as the underlying transaction for which such instruments provide an economic, but not formallydesignated, hedge. If the underlying transaction is recorded in the balance sheet, for example, capital expenditure, the realised amount remains inremeasurements on settlement of the derivative. Such amounts are classified in the income statement as operating when the underlying exposure is inrespect of the operating performance of the Group and otherwise as financing.• Foreign exchange impacts arising in US dollar functional currency entities where tax calculations are generated based on local currency financial informationand hence deferred tax is susceptible to currency fluctuations. Such amounts are included within income tax expense.• The remeasurement and subsequent depreciation of a previously held equity interest as a result of a business combination.<strong>Anglo</strong> <strong>American</strong> plc <strong>Annual</strong> <strong>Report</strong> <strong>2012</strong> 153
FINANCIAL STATEMENTS NOTES TO THE FINANCIAL STATEMENTS5. SPECIAL ITEMS AND REMEASUREMENTS continuedSubsidiariesand jointventures Associates (1) Total<strong>2012</strong> 2011Subsidiariesand jointventures Associates (1) TotalUS$ millionImpairment of Minas-Rio (4,960) – (4,960) – – –Platinum operations (860) – (860) – – –Cessation of Loma de Níquel (159) – (159) (84) – (84)Other impairments and related charges (168) (62) (230) (70) – (70)Onerous contract provisions (386) – (386) – – –Reversal of De Beers inventory uplift (421) – (421) – – –Restructuring costs (23) – (23) (10) (9) (19)Operating special items (6,977) (62) (7,039) (164) (9) (173)Operating remeasurements (116) 4 (112) (65) (9) (74)Operating special items and remeasurements (7,093) (58) (7,151) (229) (18) (247)Loss on transfer of Tarmac Quarry Materials to assets held for sale (135) – (135) – – –Loss on transfer of Amapá to assets held for sale (404) – (404) – – –Disposal of Scaw South Africa (21) – (21) – – –Disposal of Mondi 27 – 27 – – –Disposal of Lisheen and Black Mountain – – – 397 – 397Disposal of Tarmac businesses – – – (75) – (75)Kumba Envision Trust (77) – (77) – – –Platinum BEE transactions and related charges – – – (141) – (141)Other 16 – 16 2 20 22Non-operating special items (594) – (594) 183 20 203Non-operating remeasurement – net gain on acquisition of De Beers 1,988 – 1,988 – – –Non-operating special items and remeasurements 1,394 – 1,394 183 20 203Financing special items – – – – (9) (9)Financing remeasurements (89) 1 (88) 203 2 205Total special items and remeasurements before tax andnon-controlling interests (5,788) (57) (5,845) 157 (5) 152Special items and remeasurements tax 1,113 (3) 1,110 (119) 1 (118)Non-controlling interests on special items and remeasurements 404 (1) 403 12 3 15Net total special items and remeasurements attributable to equityshareholders of the Company (4,271) (61) (4,332) 50 (1) 49(1)Relates to the Iron Ore and Manganese, Platinum and, until 16 August, Diamonds segment in <strong>2012</strong> (2011: Diamonds only).Operating special itemsMinas-RioAn impairment charge of $4,960 million has been recorded in relation to the Minas-Rio iron ore project (Iron Ore Brazil). Of this charge, $1,105 million hasbeen recorded against goodwill and $3,855 million has been recorded against mining properties, with an associated deferred tax credit of $960 million.The post-tax impairment charge is $4,000 million.Platinum operationsThe impairment charge of $860 million relates to certain Platinum projects and other assets, not in use, that are not considered economically viable in thecurrent market environment. The charge includes a write-off of fair value uplifts associated with these assets held at a Group level of $89 million.Cessation of Loma de NíquelA charge of $159 million has arisen at Loma de Níquel due to the cancellation of its mining concessions in November <strong>2012</strong>. The charge comprises $70 millionof accelerated depreciation (2011: $84 million) and $89 million of related closure and retrenchment costs, including inventory write-offs of $61 million.Other impairments and related chargesOther impairments and related charges of $230 million (2011: $70 million) relate to various impairments across the Group, including an impairment of$42 million of fixed assets relating to onerous contracts at Callide (Metallurgical Coal); an impairment of $44 million relating to Wesizwe, an available forsale asset held in Platinum where the fair value has had a significant and prolonged decline; and $50 million of asset impairments recognised in Samancor,an associate investment. In 2011 the $70 million charge related to the impairment of Tarmac Building Products.Onerous contract provisionsThe charge of $386 million in relation to onerous contracts principally reflects a provision increase of $292 million for coal supply agreements inherited onacquisition of Callide in 2000. The pricing in the agreements, which extend to 2031, is significantly below market rates resulting in the unavoidable costs ofmeeting the obligations exceeding the economic benefit expected to be received from the contract.The settlement of an unused inherited transhipment contract at Amapá resulted in a charge of $43 million and the settlement of unutilised energy contractsat Minas-Rio resulted in a charge of $38 million.Reversal of De Beers inventory upliftInventory held by De Beers at the date of acquisition is required to be recognised at fair value under IFRS. This results in negligible margins being realisedupon the subsequent sale of inventory held at the acquisition date. The reversal of fair value uplifts on inventory sold in <strong>2012</strong> of $421 million has been excludedfrom the Group’s underlying earnings so as not to distort the operating margins of De Beers and to provide more useful information about the performance ofthe Group.Operating remeasurementsOperating remeasurements reflect a net loss of $112 million (2011: net loss of $74 million) principally in respect of non-hedge derivatives related to capitalexpenditure in Iron Ore Brazil. Derivatives which have been realised during the period had a cumulative net loss since their inception of $71 million (2011: netgain of $383 million). The depreciation and amortisation charge arising due to the fair value uplift on the pre-existing 45% shareholding of De Beers, whichwas required on acquisition of a controlling stake, is $41 million in <strong>2012</strong>.154 <strong>Anglo</strong> <strong>American</strong> plc <strong>Annual</strong> <strong>Report</strong> <strong>2012</strong>
5. SPECIAL ITEMS AND REMEASUREMENTS continuedNon-operating special itemsIn May <strong>2012</strong> the Competition Commission approved the formation of a 50:50 joint venture between the Group and Lafarge combining their cement,aggregates, ready-mix concrete, asphalt and asphalt surfacing, maintenance services, and waste services businesses in the UK subject to a number ofconditions being met. In July <strong>2012</strong> the Group accepted the conditions of the Competition Commission and consequently the associated Tarmac QuarryMaterials assets were classified as held for sale and recognised at fair value less costs to sell. This resulted in a loss being recognised of $135 million.In December <strong>2012</strong> the Group agreed the sale of its 70% interest in the Amapá iron ore system. The net assets have been reclassified to held for sale andrecognised at fair value less costs to sell. This resulted in a loss being recognised of $404 million.The Group completed the sale of Scaw South Africa (Pty) Ltd (Scaw South Africa), an integrated steel maker, in November <strong>2012</strong>. This resulted in a net cashinflow of $100 million, generating a loss on disposal of $21 million.The Group sold its 5.28% shareholding in Mondi in November <strong>2012</strong> for net proceeds of $273 million, realising a net fair value gain recycled from reservesof $27 million.The Kumba Envision Trust charge of $77 million relates to Kumba’s broad based employee share scheme provided solely for the benefit of non-managerialHistorically Disadvantaged South African employees who do not participate in other Kumba share schemes.Non-operating remeasurementThe non-operating remeasurement of $1,988 million (2011: nil) reflects the net gain of $2,017 million, after transaction costs, resulting from the remeasurementto fair value of the Group’s existing 45% shareholding held in De Beers at the date a controlling stake was acquired. This includes a $2.7 billion uplift ondepreciable assets which will unwind through operating remeasurements in the current and future years.Financing remeasurementsFinancing remeasurements reflect a net loss of $88 million (2011: net gain of $205 million) and relates to an embedded interest rate derivative, non-hedgederivatives relating to debt and other financing remeasurements.Special items and remeasurements taxSpecial items and remeasurements tax amounted to a credit of $1,110 million (2011: charge of $118 million). This relates to a credit for one-off tax items of$922 million (2011: credit of $137 million), a tax remeasurement charge of $189 million (2011: charge of $230 million) and a tax credit on special items andremeasurements of $377 million (2011: charge of $25 million).The total tax credit relating to subsidiaries and joint ventures of $1,113 million (2011: charge of $119 million) comprises a current tax charge of $8 million(2011: charge of $12 million) and a deferred tax credit of $1,121 million (2011: charge of $107 million).The credit relating to one-off tax items of $922 million (2011: credit of $137 million) relates principally to the net deferred tax credit of $960 million relating toMinas-Rio and a net deferred tax credit of $70 million relating to the reassessment of deferred tax assets as a result of changes in tax regimes within operatingsegments, partially offset by the write-off of the deferred tax asset in Amapá of $108 million following the decision to sell the system.The tax credit of $377 million on special items and remeasurements primarily arises on the impairments at Platinum and the reversal of the De Beersinventory uplift.Financial statements6. UNDERLYING EBITDAEarnings before interest, tax, depreciation and amortisation (underlying EBITDA) is operating profit before special items and remeasurements, depreciationand amortisation in subsidiaries and joint ventures and includes attributable share of underlying EBITDA of associates.US$ million <strong>2012</strong> 2011Iron Ore and Manganese (1) 3,198 4,586Metallurgical Coal 877 1,577Thermal Coal 972 1,410Copper 2,179 2,750Nickel 50 84Platinum 580 1,672Diamonds 711 794Other Mining and Industrial (1) 485 540Exploration (206) (121)Corporate Activities and Unallocated Costs (160) 56Underlying EBITDA 8,686 13,348(1)In <strong>2012</strong> Amapá has been reclassified from Iron Ore and Manganese to Other Mining and Industrial to align with internal management reporting. Comparatives have been reclassified to align withcurrent year presentation.Underlying EBITDA is reconciled to operating profit, including attributable share of associates, before special items and remeasurements and to ‘Total profitfrom operations and associates’ as follows:US$ million <strong>2012</strong> 2011Underlying EBITDA 8,686 13,348Depreciation and amortisation: subsidiaries and joint ventures (2,289) (1,967)Depreciation and amortisation: associates (233) (286)Operating profit, including associates, before special items and remeasurements 6,164 11,095Operating special items and remeasurements (7,093) (229)Non-operating special items and remeasurements 1,394 183Associates’ net special items and remeasurements (61) (1)Share of associates’ net finance costs, tax and non-controlling interests (266) (449)Total profit from operations and associates 138 10,599<strong>Anglo</strong> <strong>American</strong> plc <strong>Annual</strong> <strong>Report</strong> <strong>2012</strong> 155
FINANCIAL STATEMENTS NOTES TO THE FINANCIAL STATEMENTS7. EXPLORATION EXPENDITUREUS$ million <strong>2012</strong> 2011By commodityIron ore 23 5Metallurgical coal 18 5Thermal coal 14 9Copper 39 27Nickel 32 26Platinum group metals 4 5Diamonds 23 –Phosphates and niobium 2 –Central exploration activities 51 44206 1218. EMPLOYEE NUMBERS AND COSTSThe average number of employees, excluding contractors and associates’ employees, and including a proportionate share of employees within joint ventureentities, was:Thousand <strong>2012</strong> 2011By segmentIron Ore and Manganese (1) 8 7Metallurgical Coal 4 3Thermal Coal 9 9Copper 5 5Nickel 2 2Platinum 57 55Diamonds (2) 3 –Other Mining and Industrial (1) 16 17Corporate Activities and Unallocated Costs 2 2106 100(1)In <strong>2012</strong> Amapá has been reclassified from Iron Ore and Manganese to Other Mining and Industrial to align with internal management reporting. Comparatives have been reclassified to align withcurrent year presentation.(2)The average number of employees in Diamonds reflects the acquisition of De Beers from 16 August <strong>2012</strong>.The average number of employees by principal location of employment was:Thousand <strong>2012</strong> 2011South Africa 82 79Other Africa 2 1South America 11 10North America 1 –Australia and Asia 4 4Europe 6 6106 100Payroll costs in respect of the employees included in the tables above were:US$ million <strong>2012</strong> 2011Wages and salaries 4,522 4,201Social security costs 166 142Post employment benefits (1) 378 343Share-based payments (see note 29) 321 260Total payroll costs 5,387 4,946Reconciliation:Less: employee costs capitalised (247) (229)Less: employee costs included within special items (107) (10)Employee costs included in operating costs 5,033 4,707(1)Includes contributions to defined contribution pension and medical plans, and current service costs related to defined benefit pension and medical schemes, and other benefits provided tocertain employees during retirement, see note 28.In accordance with IAS 24 Related Party Disclosures (Amended), key management personnel are those persons having authority and responsibility forplanning, directing and controlling the activities of the Group, directly or indirectly, including any director (executive and non-executive) of the Group.Compensation for key management was as follows:US$ million <strong>2012</strong> 2011Salaries and short term employee benefits 24 23Social security costs 3 2Termination benefits 2 –Post employment benefits 3 8Share-based payments 25 2257 55Key management comprises members of the Board and the Executive Committee.Disclosure of directors’ emoluments, pension entitlements, share options and long term incentive plan awards required by the Companies Act 2006 and thosespecified for audit by Regulation 11 and Schedule 8 of the Large and Medium-Sized Companies and Groups (Accounts and <strong>Report</strong>s) Regulations 2008 areincluded in the Remuneration report.156 <strong>Anglo</strong> <strong>American</strong> plc <strong>Annual</strong> <strong>Report</strong> <strong>2012</strong>
9. NET FINANCE (COSTS)/INCOMEFinance costs and exchange (losses)/gains are presented net of hedges for respective interest bearing and foreign currency borrowings.The weighted average capitalisation rate applied to qualifying capital expenditure was 4.2% (2011: 5.0%).US$ million <strong>2012</strong> 2011Investment incomeInterest income from cash and cash equivalents 155 239Other interest income 195 194Expected return on defined benefit arrangements 200 199Dividend income from financial asset investments 54 59604 691Less: interest income capitalised (7) (23)Total investment income 597 668Interest expenseInterest and other finance expense (691) (615)Interest payable on convertible bond (25) (68)Unwinding of discount on convertible bond (25) (71)Interest cost on defined benefit arrangements (230) (205)Unwinding of discount relating to provisions and other liabilities (114) (80)(1,085) (1,039)Less: interest expense capitalised 287 344Total interest expense (798) (695)Other financing (losses)/gainsNet foreign exchange losses (90) (16)Net fair value (losses)/gains on fair value hedges (24) 16Other net fair value gains 27 7Total other financing (losses)/gains (87) 7Net finance costs before remeasurements (288) (20)Remeasurements (see note 5) (89) 203Net finance (costs)/income after remeasurements (377) 18310. FINANCIAL INSTRUMENT GAINS AND LOSSESThe net gains and losses recorded in the Consolidated income statement in respect of financial instruments were as follows:US$ million <strong>2012</strong> 2011At fair value through profit and lossCash flow hedge derivatives transferred from equity (1) (4) (5)Fair value hedge derivatives (193) (263)Fair value hedge underlying instruments 169 279Foreign exchange gains/(losses) 12 (9)Other fair value movements (2) (144) (205)Loans and receivablesForeign exchange gains 17 9Interest income at amortised cost (3) 307 368Available for saleNet gain transferred on sale from equity 67 10Dividend income 54 59Impairment of available for sale investments (84) –Foreign exchange losses (30) –Other financial liabilitiesForeign exchange (losses)/gains (106) 240Interest expense at amortised cost (3) (404) (345)Financial statements(1)These amounts are included in Group revenue.(2)Includes the impact of provisional pricing, see note 3, and certain operating and financing remeasurements, see note 5.(3)Interest income and expense at amortised cost are shown net of amounts capitalised.<strong>Anglo</strong> <strong>American</strong> plc <strong>Annual</strong> <strong>Report</strong> <strong>2012</strong> 157
FINANCIAL STATEMENTS NOTES TO THE FINANCIAL STATEMENTS11. INCOME TAX EXPENSEa) Analysis of charge for the yearUS$ million <strong>2012</strong> 2011United Kingdom corporation tax (credit)/charge (12) 16South Africa tax 802 1,307Other overseas tax 605 1,067Prior year adjustments 61 (92)Current tax (1) 1,456 2,298Deferred tax 32 443Income tax expense before special items and remeasurements 1,488 2,741Special items and remeasurements tax (1,113) 119Income tax expense 375 2,860(1)Includes royalties which meet the definition of income tax and are in addition to royalties recorded in operating costs.b) Factors affecting tax charge for the yearThe effective tax rate for the year of (156.9)% (2011: 26.5%) is lower than (2011: same as) the applicable weighted average statutory rate of corporation tax inthe United Kingdom of 24.5% (2011: 26.5%). The reconciling items, excluding the impact of associates, are:US$ million <strong>2012</strong> 2011(Loss)/profit before tax (239) 10,782Less: share of net income from associates (432) (977)(Loss)/profit before tax (excluding associates) (671) 9,805Tax on (loss)/profit (excluding associates) calculated at United Kingdom corporation tax rate of 24.5% (2011: 26.5%) (164) 2,598Tax effects of:Items not taxable/deductible for tax purposesExploration expenditure 43 27Non-taxable/deductible net foreign exchange loss 7 24Non-taxable net interest income (25) (20)Other non-deductible expenses 51 60Other non-taxable income (63) (57)Temporary difference adjustmentsCurrent year losses not recognised 86 38Recognition of losses not previously recognised (69) (103)Other temporary differences (40) (57)Special items and remeasurements 305 77Other adjustmentsSecondary tax on companies and dividend withholding taxes 26 407Effect of differences between local and United Kingdom rates 68 (61)Prior year adjustments to current tax 61 (92)Other adjustments 89 19Income tax expense 375 2,860IAS 1 requires income from associates to be presented net of tax on the face of the income statement. Associates’ tax is therefore not included within theGroup’s income tax expense. Associates’ tax included within ‘Share of net income from associates’ for the year ended 31 December <strong>2012</strong> is $205 million(2011: $384 million). Excluding special items and remeasurements this becomes $202 million (2011: $385 million).The effective rate of tax before special items and remeasurements including attributable share of associates’ tax for the year ended 31 December <strong>2012</strong> was29.0%. The increase compared to the equivalent effective tax rate of 28.3% for the year ended 31 December 2011 is due to the reduced impact of certainnon-recurring factors. The non-recurring factors in <strong>2012</strong> include further recognition of previously unrecognised tax losses and the reassessment of certainwithholding tax provisions across the Group. In future periods it is expected that the effective tax rate, including associates’ tax, will remain above the UnitedKingdom statutory tax rate.c) Tax amounts included in total comprehensive incomeAn analysis of tax by individual item presented in the Consolidated statement of comprehensive income is presented below:US$ million <strong>2012</strong> 2011Tax on items recognised directly in equityNet gain on revaluation of available for sale investments (79) (26)Net (gain)/loss on cash flow hedges (1) 20Net exchange difference on translation of foreign operations (16) 11Actuarial net (gain)/loss on post employment benefit plans (19) 19(115) 24Tax on items transferred from equityTransferred to income statement: disposal of available for sale investments 30 –Transferred to initial carrying amount of hedged items: cash flow hedges (1) (12)Transferred to income statement: cash flow hedges – (2)29 (14)d) Tax amounts recognised directly in equityCapital gains tax of $290 million relating to the profit on sale of a 25.4% share in <strong>Anglo</strong> <strong>American</strong> Sur SA (AA Sur) in August <strong>2012</strong> has been charged directlyto equity (2011: $1,017 million relating to the profit on sale of a 24.5% share in AA Sur in November 2011). There were no other material current tax amountscharged directly to equity in <strong>2012</strong> or 2011. Deferred tax of $110 million has been charged directly to equity (2011: charge of $127 million), see note 27.158 <strong>Anglo</strong> <strong>American</strong> plc <strong>Annual</strong> <strong>Report</strong> <strong>2012</strong>
12. DIVIDENDSDividends payable during the year are as follows:US$ million <strong>2012</strong> 2011Final ordinary dividend for 2011 – 46 US cents per ordinary share (2010: 40 US cents per ordinary share) 559 495Interim ordinary dividend for <strong>2012</strong> – 32 US cents per ordinary share (2011: 28 US cents per ordinary share) 411 339970 834(1)Of this, $599 million (2011: $561 million) was recognised in the parent Company.(1) (1)Total dividends paid during the year were $970 million (2011: $818 million). In 2011 the difference to dividends payable arose due to movements in exchangerates between the date of recognition and the date of payment.The directors are proposing a final dividend in respect of the financial year ended 31 December <strong>2012</strong> of 53 US cents per share. Based on shares eligible fordividends at 31 December <strong>2012</strong>, this will result in an estimated distribution of $676 million of shareholders’ funds, of which $395 million will be distributed bythe parent Company. These financial statements do not reflect this dividend payable as it is still subject to shareholder approval.As stated in note 29, the employee benefit trust has waived the right to receive dividends on the shares it holds.13. EARNINGS PER SHAREUS$ <strong>2012</strong> 2011(Loss)/profit for the financial year attributable to equity shareholders of the CompanyBasic (loss)/earnings per share (1.19) 5.10Diluted (loss)/earnings per share (1.19) 4.89Headline earnings for the financial year (1)Basic earnings per share 0.95 4.89Diluted earnings per share 0.95 4.69Underlying earnings for the financial year (1)Basic earnings per share 2.26 5.06Diluted earnings per share 2.24 4.85(1)Basic and diluted earnings per share are also shown based on headline earnings, a Johannesburg Stock Exchange (JSE Limited) defined performance measure, and underlying earnings, whichthe directors consider to be a useful additional measure of the Group’s performance. Both earnings measures are further explained below.The calculation of basic and diluted earnings per share is based on the following data:(Loss)/profit attributableto equity shareholdersof the Company Headline earnings Underlying earnings<strong>2012</strong> 2011 <strong>2012</strong> 2011 <strong>2012</strong> 2011Earnings (US$ million)Basic (loss)/earnings (1,493) 6,169 1,197 5,913 2,839 6,120Effect of dilutive potential ordinary sharesInterest payable on convertible bond (net of tax) (1) – 50 – 50 19 50Unwinding of discount on convertible bond (net of tax) (1) – 52 – 52 19 52Diluted earnings (1,493) 6,271 1,197 6,015 2,877 6,222Number of shares (million)Basic number of ordinary shares outstanding 1,254 1,210 1,254 1,210 1,254 1,210Effect of dilutive potential ordinary sharesShare options and awards – 10 5 10 5 10Convertible bond – 62 – 62 23 62Diluted number of ordinary shares outstanding 1,254 1,282 1,259 1,282 1,282 1,282Financial statements(1)All outstanding convertible bonds were converted or redeemed during the year, see note 24.Diluted earnings per share is calculated by adjusting the weighted average number of ordinary shares in issue on the assumption of conversion of all potentiallydilutive ordinary shares. Potential ordinary shares shall be treated as dilutive when, and only when, their conversion to ordinary shares would decreaseearnings per share or increase loss per share from continuing operations. Consequently, in <strong>2012</strong> basic loss per share equals diluted loss per share and16,325,905 (2011: 270,095) shares have been excluded from the calculation of diluted earnings per share as they are anti-dilutive as at 31 December <strong>2012</strong>.As at 31 December <strong>2012</strong>, 10,339,454 (2011: 270,095) shares have been excluded from the calculation of diluted headline earnings per share and dilutedunderlying earnings per share as they are anti-dilutive.Basic and diluted number of ordinary shares outstanding represent the weighted average for the year. The average number of ordinary shares in issueexcludes shares held by employee benefit trusts and <strong>Anglo</strong> <strong>American</strong> plc shares held by Group companies.<strong>Anglo</strong> <strong>American</strong> plc <strong>Annual</strong> <strong>Report</strong> <strong>2012</strong> 159
FINANCIAL STATEMENTS NOTES TO THE FINANCIAL STATEMENTS13. EARNINGS PER SHARE continuedUnderlying earnings is presented after non-controlling interests and excludes special items and remeasurements, see note 5. Underlying earnings is distinctfrom ‘Headline earnings’, which is a JSE Limited defined performance measure.The calculation of basic and diluted earnings per share, based on headline and underlying earnings, uses the following earnings data:US$ million <strong>2012</strong> 2011(Loss)/profit for the financial year attributable to equity shareholders of the Company (1,493) 6,169Operating special items 6,050 70Operating special items – tax (1,600) –Operating special items – non-controlling interests (123) –Non-operating special items and remeasurements (1,492) (347)Non-operating special items – tax 35 36Non-operating special items – non-controlling interests (180) –Financing special items – 9Tax special items – (24)Headline earnings for the financial year 1,197 5,913Operating special items (1) 989 103Operating remeasurements 112 74Non-operating special items and remeasurements (2) 98 144Financing remeasurements 88 (205)Special items and remeasurements tax 455 106Non-controlling interests on special items and remeasurements (100) (15)Underlying earnings for the financial year 2,839 6,120(1)Includes onerous contract provisions, accelerated depreciation and the reversal of the inventory uplift on De Beers.(2)Principally includes Kumba Envision Trust charge and transaction costs relating to the De Beers acquisition (2011: Platinum BEE transactions and related charges).14. INTANGIBLE ASSETSBrands,contractsand otherintangibles (1) Goodwill (2) Total<strong>2012</strong> 2011Brands,contractsand otherintangibles (1) Goodwill (2) TotalUS$ millionNet book valueAt 1 January 83 2,239 2,322 85 2,231 2,316Acquired through business combinations 1,588 2,355 3,943 – – –Additions 34 – 34 26 – 26Amortisation charge for the year (3) (37) – (37) (20) – (20)Impairments and losses on assets transferred to held for sale (30) (1,169) (1,199) – (15) (15)Disposals and transfer to assets held for sale (7) (441) (448) – (25) (25)Adjustments relating to deferred and contingent consideration – – – – 81 81Currency movements (14) (30) (44) (8) (33) (41)At 31 December 1,617 2,954 4,571 83 2,239 2,322Cost 1,724 2,954 4,678 182 2,239 2,421Accumulated amortisation (107) – (107) (99) – (99)(1)Includes $517 million (2011: nil) of assets with indefinite lives acquired through the acquisition of De Beers. Brands, contracts and other intangible assets are provided net of cumulativeimpairment charges of $29 million (2011: $37 million).(2)The goodwill balances provided are net of cumulative impairment charges of $1,120 million (2011: $337 million).(3)Includes $6 million (2011: nil) of amortisation arising due to the fair value uplift of the Group’s pre-existing 45% shareholding in De Beers. This has been included within operatingremeasurements.Impairment tests for goodwillGoodwill is allocated for impairment testing purposes to cash generating units (CGUs) or groups of CGUs which reflect how it is monitored for internalmanagement purposes. This allocation largely represents the Group’s segments. Any goodwill associated with CGUs subsumed within these segments is notsignificant when compared to the goodwill of the Group (2011: material components of goodwill within Iron Ore and Manganese and Other Mining andIndustrial). The allocation of goodwill to CGUs or groups of CGUs is as follows:US$ million <strong>2012</strong> 2011Iron Ore and ManganeseIron Ore Brazil – 1,123Thermal Coal 88 88Copper 124 124Nickel 10 10Platinum 230 230Diamonds 2,324 –Other Mining and IndustrialTarmac (1) – 456Other 178 2082,954 2,239(1)The goodwill balance in Tarmac as at 31 December <strong>2012</strong> relates to Tarmac Quarry Materials and has been transferred to assets held for sale, see note 34.For the purposes of goodwill impairment testing, the recoverable amount of a CGU is determined based on a fair value less costs to sell basis, with theexception of Minas-Rio which is determined on a value in use basis.160 <strong>Anglo</strong> <strong>American</strong> plc <strong>Annual</strong> <strong>Report</strong> <strong>2012</strong>
14. INTANGIBLE ASSETS continuedValue in use is based on the present value of future cash flows expected to be derived from the CGU or reportable segment in its current state. Fair value lesscosts to sell is normally supported by observable market data (in the case of listed subsidiaries, market share price at 31 December of the respective entity)or discounted cash flow models taking account of assumptions that would be made by market participants.Expected future cash flows are inherently uncertain and could materially change over time. They are significantly affected by a number of factors including orereserves and resources, together with economic factors such as commodity prices, discount rates, exchange rates, estimates of costs to produce reserves andfuture capital expenditure. Management believes that any reasonably possible change in a key assumption on which the recoverable amounts are based wouldnot cause the carrying amounts to exceed their recoverable amounts.Cash flow projections are based on financial budgets and mine life plans or non-mine production plans, incorporating key assumptions as detailed below:Reserves and resourcesOre reserves and, where considered appropriate, mineral resources are incorporated in projected cash flows, based on ore reserves and mineral resourcestatements and exploration and evaluation work undertaken by appropriately qualified persons. Mineral resources are included where management has a highdegree of confidence in their economic extraction, despite additional evaluation still being required prior to meeting the requirements of reserve classification.For further information refer to the Ore Reserves and Mineral Resources section of the <strong>Annual</strong> <strong>Report</strong>.Commodity pricesCommodity prices are based on latest internal forecasts for commodity prices, benchmarked with external sources of information, to ensure they are withinthe range of available analyst forecasts. Where existing sales contracts are in place, the effects of such contracts are taken into account in determining futurecash flows.Operating costs and capital expenditureOperating costs and capital expenditure are based on financial budgets covering a three year period. Cash flow projections beyond three years are based onmine life plans or non-mine production plans as applicable, and internal management forecasts. Cost assumptions incorporate management experience andexpectations, as well as the nature and location of the operation and the risks associated therewith. Underlying input cost assumptions are consistent withrelated output price assumptions.Non-commodity based businessesFor non-commodity based businesses, margin and revenue are based on financial budgets covering a three year period. Beyond the financial budget, revenueis forecast using a steady growth rate consistent with the markets in which those businesses operate, and for those periods five years or more from the balancesheet date, at a rate not exceeding the long term growth rate for the country of operation. Where existing sales contracts are in place, the effects of suchcontracts are taken into account in determining future cash flows.Discount ratesCash flow projections used in fair value less costs to sell impairment models are discounted based on a real post-tax discount rate of 6.5% (2011: 6.0%). Thediscount rate for Minas-Rio is a real pre-tax rate of 8.5% (2011: 8.0%). Adjustments to the rate are made for any risks that are not reflected in the underlyingcash flows.Foreign exchange ratesForeign exchange rates are based on latest internal forecasts for foreign exchange, benchmarked with external sources of information for relevant countriesof operation. Foreign exchange rates are kept constant from 2017 onwards.Minas-RioThe Minas-Rio iron ore project (Minas-Rio) in Brazil was acquired in two separate transactions in 2007 and 2008. Minas-Rio is expected to produce 26.5 Mtpaof high quality pellet feed in its first phase of development, with the potential to increase to 29.8 Mtpa following asset optimisation. Pre-feasibility studies forthe subsequent expansion phases of Minas-Rio commenced during 2011, supported by an estimated resource base at that time of 5.77 billion tonnes,as detailed in the 2011 Ore Reserves and Mineral Resources statement. We have subsequently converted 1.45 billion tonnes to Ore Reserves.While progress is being made, construction activities at the beneficiation plant and land access along the 525 km pipeline route have been impeded by a seriesof challenges, including three legal injunctions. All three injunctions were resolved during the second half of <strong>2012</strong> and construction activity in the affectedareas has resumed.Additional capital expenditure has been incurred as a result of, inter alia, the delays arising from the injunctions, scope changes and higher than expectedinflation of operational costs. Management has completed a detailed review to assess the impact of these additional costs and the forecast capital expenditurefor the first phase of Minas-Rio has increased from $5.8 billion to $8.8 billion, including a $0.6 billion contingency, on an attributable basis.The delivery of the project on the revised schedule is dependent upon a number of development milestones: suppression of caves at the mine site; completionof the tailings dam before the rainy season; land release for the transmission line to the beneficiation plant and pipeline; and fulfilment of installation licences’conditions such that operating licences can be issued in due course. Subject to no further unexpected interventions and the successful completion of thesekey milestones in the next 12 months, first ore on ship is anticipated at the end of 2014.The valuation of Minas-Rio at 31 December <strong>2012</strong> has been assessed by reference to its value in use, determined on a discounted cash flow basis (real pre-taxdiscount rate of 8.5%). The valuation considers the risk of further escalation in capital expenditure and of further delay to first ore on ship. It also considers theimpact of further unanticipated impediments to progress. These risks reflect the history of unforeseen challenges that have affected the project to date. Thevaluation model employs long term iron ore prices based on detailed analysis of market fundamentals and adjusted for iron ore quality. The long term iron oreprice which is used in the valuation from 2022 onwards is within the range of published analyst forecasts and is slightly above the median of $80 per tonne.Based on this valuation, the Group has recorded an impairment charge of $4,960 million (before tax) against the carrying value of the asset. Of this charge,$1,105 million has been recorded against goodwill and $3,855 million has been recorded against mining properties, with an associated deferred tax credit of$960 million. The post-tax impairment charge is $4,000 million.Financial statements<strong>Anglo</strong> <strong>American</strong> plc <strong>Annual</strong> <strong>Report</strong> <strong>2012</strong> 161
FINANCIAL STATEMENTS NOTES TO THE FINANCIAL STATEMENTS15. PROPERTY, PLANT AND EQUIPMENTMiningpropertiesand leases (1)Land andbuildingsPlant andequipment Other (2) Total<strong>2012</strong> 2011Miningpropertiesand leases (1)Land andbuildingsPlant andequipment Other (2) TotalUS$ millionNet book valueAt 1 January 14,643 2,620 14,822 8,464 40,549 15,376 2,004 10,839 11,591 39,810Acquired throughbusiness combinations 7,307 420 395 790 8,912 – – – – –Additions 338 44 181 5,394 5,957 352 76 287 5,834 6,549Depreciation chargefor the year (3) (559) (200) (1,641) (44) (2,444) (414) (113) (1,501) (42) (2,070)Impairmentsand losses on transferto assets held for sale (4,009) (35) (352) (794) (5,190) – – (61) – (61)Disposal of assets (5) (4) (45) (12) (66) (2) (7) (39) (28) (76)Disposal and transferto assets held for sale (644) (148) (1,007) (155) (1,954) (39) (4) (13) (1) (57)Reclassifications (4) 558 346 2,149 (3,053) – 532 826 6,408 (7,929) (163)Currency movements (264) (47) (217) (147) (675) (1,162) (162) (1,098) (961) (3,383)At 31 December 17,365 2,996 14,285 10,443 45,089 14,643 2,620 14,822 8,464 40,549Cost 25,057 4,001 23,358 10,628 63,044 19,532 3,450 24,116 8,648 55,746Accumulateddepreciation (7,692) (1,005) (9,073) (185) (17,955) (4,889) (830) (9,294) (184) (15,197)(1)Includes amounts in relation to deferred stripping.(2)Includes $10,193 million (2011: $8,088 million) of assets in the course of construction, which are not depreciated.(3)Includes $2,258 million (2011: $1,947 million) of depreciation within operating profit, $70 million (2011: $84 million) of accelerated depreciation, a $35 million (2011: nil) depreciation chargearising due to the fair value uplift on the pre-existing 45% shareholding of De Beers (see note 5) and $81 million (2011: $39 million) of pre-commercial production depreciation which has beencapitalised. See note 2 for a split of depreciation, and amortisation for intangibles, by segment.(4)Relates mainly to amounts transferred from assets in the course of construction. In 2011 the net amount of $163 million relates to federal tax credits on qualifying capital projects in Brazil. Thesecredits have been reclassified, as appropriate, to reflect the expected realisation.Included in the additions above is $280 million (2011: $321 million) of net interest expense incurred on borrowings funding the construction of qualifyingassets which has been capitalised during the year.Assets held under finance leases relate to plant and equipment with a net book value of $27 million (2011: $25 million). Depreciation charges in the yearamounted to $7 million (2011: $9 million).The net book value of land and buildings comprises:US$ million <strong>2012</strong> 2011Freehold 2,952 2,604Leasehold – long 41 8Leasehold – short (less than 50 years) 3 82,996 2,62016. ENVIRONMENTAL REHABILITATION TRUSTSThe Group makes contributions to controlled funds that were established to meet the cost of some of its restoration and environmental rehabilitation liabilities,primarily in South Africa. The funds comprise the following investments:US$ million <strong>2012</strong> 2011Equity 150 146Bonds 151 130Cash 92 84393 360These assets are primarily rand denominated. Cash is held in short term fixed deposits or earns interest at floating inter-bank rates. Bonds earn interest ata weighted average fixed rate of 8% (2011: 6%) for an average period of five years (2011: four years). Equity investments are recorded at fair value throughprofit and loss while other assets are treated as loans and receivables.These funds are not available for the general purposes of the Group. All income from these assets is reinvested to meet specific environmental obligations.These obligations are included in provisions, see note 26.162 <strong>Anglo</strong> <strong>American</strong> plc <strong>Annual</strong> <strong>Report</strong> <strong>2012</strong>
17. INVESTMENTS IN ASSOCIATESUS$ million <strong>2012</strong> 2011At 1 January 5,240 4,900Net income from associates 432 977Dividends received (286) (344)Share of expense recognised directly in equity, net of tax (6) (32)Other equity movements (4) –Investment in equity and capitalised loans 114 47Interest on capitalised loans 9 23Acquired through business combinations 12 –Repayment of capitalised loans (36) (4)Transfer to available for sale investments – (66)Disposals (1) (2,372) –Other movements 1 (1)Currency movements (41) (260)At 31 December (2) 3,063 5,240(1)Represents the carrying value of the Group’s pre-existing 45% shareholding in De Beers prior to the acquisition of a controlling interest on 16 August <strong>2012</strong>, see note 32.(2)The fair value of the Group’s investment in Atlatsa Resources Corporation (previously known as Anooraq Resources Corporation) at 31 December <strong>2012</strong> was $18 million (2011: $51 million).The Group’s total investments in associates comprise:US$ million <strong>2012</strong> 2011Equity 2,359 4,593Loans (1) 704 6473,063 5,240(1)The Group’s total investments in associates include long term debt which in substance forms part of the Group’s investment. These loans are not repayable in the foreseeable future.The Group’s attributable share of the summarised income statement information of associates is shown in note 2. Summarised balance sheet information ofassociates is as follows:US$ million <strong>2012</strong> 2011Non-current assets 2,521 6,111Current assets 1,494 2,188Current liabilities (379) (742)Non-current liabilities (573) (2,317)Group’s share of associates’ net assets 3,063 5,240Segmental information is provided as follows:Share of net incomeAggregate investmentUS$ million <strong>2012</strong> 2011 <strong>2012</strong> 2011By segmentIron Ore and Manganese 31 142 902 936Metallurgical Coal 79 141 277 294Thermal Coal 248 317 1,085 932Platinum (94) (65) 786 848Diamonds 168 442 13 2,230432 977 3,063 5,240Financial statementsAggregate investmentUS$ million <strong>2012</strong> 2011By geographySouth Africa 1,165 1,950Other Africa – 996South America 1,075 917North America – 343Australia and Asia 807 794Europe 16 2403,063 5,240The Group’s share of associates’ contingent liabilities incurred jointly by investors is $33 million (2011: $112 million).Details of principal associates are set out in note 38.<strong>Anglo</strong> <strong>American</strong> plc <strong>Annual</strong> <strong>Report</strong> <strong>2012</strong> 163
FINANCIAL STATEMENTS NOTES TO THE FINANCIAL STATEMENTS18. JOINT VENTURESThe Group’s share of the summarised financial information of joint venture entities that are proportionately consolidated in the financial statements is asfollows:US$ million <strong>2012</strong> 2011Non-current assets 10,407 2,546Current assets 1,000 572Current liabilities (651) (434)Non-current liabilities (1,299) (703)Group’s share of joint venture entities’ net assets 9,457 1,981Revenue 2,394 1,932Operating costs (1,915) (944)Net finance costs (39) (44)Income tax expense (110) (230)Group’s share of joint venture entities’ profit for the financial year 330 714The Group’s share of joint venture entities’ contingent liabilities incurred jointly with other venturers is $25 million (2011: $32 million) and its share of capitalcommitments is $569 million (2011: $74 million).Within the Metallurgical Coal segment, the Group also holds interests in a number of proportionately consolidated jointly controlled operations. The Group’sshare of net assets of such operations is $1,802 million (2011: $1,538 million) and its share of profit for the financial year is $224 million (2011: $615 million).The Group’s share of these operations’ contingent liabilities incurred jointly with other venturers is $32 million (2011: $19 million) and its share of capitalcommitments is $85 million (2011: $80 million).Details of principal joint ventures are set out in note 38.19. FINANCIAL ASSET INVESTMENTSLoans andreceivablesAvailablefor saleinvestments<strong>2012</strong> 2011Loans andreceivablesAvailablefor saleinvestmentsUS$ millionTotalTotalAt 1 January 1,690 1,206 2,896 1,920 1,300 3,220Additions 8 8 16 4 84 88Acquired through business combinations 41 19 60 – – –Interest receivable 14 – 14 76 – 76Net repayments (79) – (79) (22) – (22)Transfer to assets held for sale (16) – (16) – – –Disposals (314) (273) (587) – (14) (14)Movements in fair value 26 173 199 (10) 115 105Currency movements (54) (69) (123) (278) (279) (557)At 31 December 1,316 1,064 2,380 1,690 1,206 2,896No provision for impairment is recorded against financial assets classified as ‘Loans and receivables’ (2011: nil).Maturity analysis of financial asset investments:US$ million <strong>2012</strong> 2011Current 102 –Non-current 2,278 2,8962,380 2,89620. INVENTORIESUS$ million <strong>2012</strong> 2011Raw materials and consumables 936 837Work in progress 1,500 1,488Finished products 2,569 1,1925,005 3,517The cost of inventories recognised as an expense and included in cost of sales amounted to $15,776 million (2011: $16,146 million). An additional $421 millionwas recognised as an expense within operating special items (2011: nil) relating to the reversal of fair value uplifts on De Beers inventory, see note 5.Inventories held at net realisable value amounted to $352 million (2011: $285 million).Write-down of inventories (net of revaluation of provisionally priced purchases) amounted to $145 million, including write-offs of $61 million relating toinventory at Loma de Níquel recorded in operating special items (2011: $16 million).There were nil inventory write-downs reversed and recognised as a reduction in the inventory expense for the year (2011: nil).164 <strong>Anglo</strong> <strong>American</strong> plc <strong>Annual</strong> <strong>Report</strong> <strong>2012</strong>
21. TRADE AND OTHER RECEIVABLESDue withinone yearDue afterone year<strong>2012</strong> 2011Due withinone yearDue afterone yearUS$ millionTotalTotalTrade receivables 2,520 204 2,724 2,704 168 2,872Other receivables 570 318 888 744 236 980Prepayments and accrued income 185 50 235 226 33 2593,275 572 3,847 3,674 437 4,111The historical level of customer default is minimal and as a result the credit quality of year end trade receivables which are not past due is considered to behigh. Of the year end trade receivables balance the following were past due at 31 December (stated after associated impairment provision):US$ million <strong>2012</strong> 2011Less than one month 29 137Greater than one month, less than two months 7 16Greater than two months, less than three months 2 7Greater than three months 4 1942 179The overdue debtor ageing profile above is typical of the industry in which certain of the Group’s businesses operate. Given this, the existing insurance cover(including letters of credit from financial institutions) and the nature of the related counterparties, these amounts are considered recoverable.Total trade receivables are stated net of the following impairment provision:US$ million <strong>2012</strong> 2011At 1 January 54 53Charge for the year – 6Unused amounts reversed (6) –Disposals and transfer to assets held for sale (25) (3)Currency movements – (2)At 31 December 23 5422. TRADE AND OTHER PAYABLESUS$ million <strong>2012</strong> 2011Trade payables 2,701 3,001Tax and social security 105 177Other payables 707 939Accruals and deferred income (1) 1,041 9814,554 5,098(1)Includes $18 million (2011: nil) of deferred income recorded within non-current liabilities.Financial statements23. FINANCIAL ASSETSThe carrying amounts and fair values of financial assets are as follows:Estimatedfair value<strong>2012</strong> 2011CarryingvalueEstimatedfair valueUS$ millionAt fair value through profit and lossTrade and other receivables (1) 581 581 596 596Derivative financial assets (2) 848 848 840 840Loans and receivablesCash and cash equivalents 9,094 9,094 11,732 11,732Trade and other receivables (1) 3,031 3,031 3,256 3,256Financial asset investments 1,286 1,316 1,647 1,690Available for sale investmentsFinancial asset investments 1,064 1,064 1,206 1,206Total financial assets 15,904 15,934 19,277 19,320(1)Trade and other receivables exclude prepayments and accrued income.(2)Derivative instruments are analysed between those which are ‘Held for trading’ and those designated into hedge relationships in note 25.CarryingvalueFor financial assets which are traded on an active market, such as listed investments, fair value is determined by reference to market value. For non-tradedfinancial assets, fair value is calculated using discounted cash flows, considered to be reasonable and consistent with those that would be used by a marketparticipant, unless carrying value is considered to approximate fair value.<strong>Anglo</strong> <strong>American</strong> plc <strong>Annual</strong> <strong>Report</strong> <strong>2012</strong> 165
FINANCIAL STATEMENTS NOTES TO THE FINANCIAL STATEMENTS23. FINANCIAL ASSETS continuedFair value hierarchyAn analysis of financial assets carried at fair value is set out below:<strong>2012</strong> 2011US$ million Level 1 (1) Level 2 (2) Level 3 (3) Total Level 1 (1) Level 2 (2) Level 3 (3) TotalAt fair value through profit and lossTrade and other receivables – 581 – 581 – 596 – 596Derivative financial assets 1 813 34 848 – 677 163 840Available for sale investmentsFinancial asset investments 980 11 73 1,064 1,142 10 54 1,206981 1,405 107 2,493 1,142 1,283 217 2,642(1)Valued using unadjusted quoted prices in active markets for identical financial instruments. This category includes listed equity shares.(2)Valued using techniques based significantly on observable market data. Instruments in this category are valued using valuation techniques where all of the inputs that have a significant effecton the valuation are directly or indirectly based on observable market data.(3)Instruments in this category have been valued using a valuation technique where at least one input (which could have a significant effect on the instrument’s valuation) is not based onobservable market data. Where inputs can be observed from market data without undue cost and effort, the observed input is used. Otherwise, management determines a reasonable estimatefor the input. Financial assets included within level 3 primarily consist of embedded derivatives, financial asset investments and certain cross currency swaps of Brazilian real denominatedborrowings, whose valuation depends upon unobservable inputs.The movements in the fair value of the level 3 financial assets are shown in the following table:US$ million <strong>2012</strong> 2011At 1 January 217 96Net (loss)/gain recorded in remeasurements (141) 37Net gain recorded in the statement of comprehensive income 19 9Cash flow – (29)Additions – 9Disposals and transfer to assets held for sale – (12)Reclassification from/to level 3 financial liabilities 14 123Currency movements (2) (16)At 31 December 107 217For the level 3 financial assets, changing certain inputs to reasonably possible alternative assumptions may change the fair value significantly. Wheresignificant, the effect of a change in these assumptions to a reasonably possible alternative assumption is outlined in the table below. These sensitivities havebeen calculated by amending the fair value of the level 3 financial assets at 31 December for a change in each individual assumption, as outlined below, whilekeeping all other assumptions consistent with those used to calculate the fair value recognised in the financial statements.Increase/(decrease)in fair value of assets<strong>2012</strong> 2011Increase/(decrease)in fair value of assetsUS$ millionChange in assumptionDerivative financial assets Increase of 5% in dividend forecast 5 10Decrease of 5% in dividend forecast (5) (10)Shift of TJLP curve (1) n/a n/aFinancial asset investments Decrease of 10% in liquidity discount percentage 9 11Increase of 10% in liquidity discount percentage (9) (11)(1)TJLP is a Brazilian domestic interest rate. The sensitivities are provided on the net liability position of such level 3 financial instruments and are disclosed in note 24.Financial asset risk exposures are set out in note 25.24. FINANCIAL LIABILITIESThe carrying amounts and fair values of financial liabilities are as follows:Estimatedfair value<strong>2012</strong> 2011CarryingvalueEstimatedfair valueUS$ millionAt fair value through profit and lossTrade and other payables (1) 296 296 262 262Derivative financial liabilities (2) 1,081 1,081 1,112 1,112Designated into fair value hedgeBorrowings 13,735 13,425 8,867 8,074Financial liabilities at amortised costTrade and other payables (1) 4,102 4,102 4,637 4,637Borrowings 4,181 4,329(3)5,526 4,799Other non-current liabilities 29 29 55 55Total financial liabilities 23,424 23,262 20,459 18,939(1)Trade and other payables exclude tax and social security and deferred income.(2)Derivative instruments are analysed between those which are ‘Held for trading’ and those designated into hedge relationships in note 25.(3)The fair value of the convertible bond at 31 December 2011 represented the quoted price of the debt and therefore included the portion accounted for in equity.Carryingvalue166 <strong>Anglo</strong> <strong>American</strong> plc <strong>Annual</strong> <strong>Report</strong> <strong>2012</strong>
24. FINANCIAL LIABILITIES continuedFor financial liabilities which are traded on an active market, such as listed debt instruments, fair value is determined by reference to market value. Fornon-traded financial liabilities, fair value is calculated using discounted cash flows, considered to be reasonable and consistent with those that would be usedby a market participant, unless carrying value is considered to approximate fair value.Fair value hierarchyAn analysis of financial liabilities carried at fair value is set out below:<strong>2012</strong> 2011US$ million Level 1 (1) Level 2 (2) Level 3 (3) Total Level 1 (1) Level 2 (2) Level 3 (3) TotalAt fair value through profit and lossTrade and other payables – 296 – 296 – 262 – 262Derivative financial liabilities – 865 216 1,081 – 924 188 1,112– 1,161 216 1,377 – 1,186 188 1,374(1)Valued using unadjusted quoted prices in active markets for identical financial instruments.(2)Valued using techniques based significantly on observable market data. Instruments in this category are valued using valuation techniques where all of the inputs that have a significant effecton the valuation are directly or indirectly based on observable market data.(3)Instruments in this category have been valued using a valuation technique where at least one input (which could have a significant effect on the instrument’s valuation) is not based onobservable market data. Where inputs can be observed from market data without undue cost and effort, the observed input is used. Otherwise, management determines a reasonable estimatefor the input. Financial instruments included within level 3 primarily consist of embedded derivatives and certain cross currency swaps of Brazilian real denominated borrowings, whosevaluation depends upon unobservable inputs and commodity sales contracts which do not meet the conditions for the ‘own use’ exemption under IAS 39.The movements in the fair value of the level 3 financial liabilities are shown in the following table:US$ million <strong>2012</strong> 2011At 1 January 188 60Net gain/(loss) recorded in remeasurements 14 (5)Cash flow – 15Reclassification to/from level 3 financial assets 14 123Currency movements – (5)At 31 December 216 188For the level 3 financial liabilities, changing certain inputs to reasonably possible alternative assumptions may change the fair value significantly. Wheresignificant, the effect of a change in these assumptions to a reasonably possible alternative assumption is outlined in the table below. These sensitivities havebeen calculated by amending the fair value of the level 3 financial liabilities at 31 December for a change in each individual assumption, as outlined below, whilekeeping all other assumptions consistent with those used to calculate the fair value recognised in the financial statements.<strong>2012</strong> 2011US$ millionChange in assumptionIncrease in fairvalue of liabilitiesIncrease in fairvalue of liabilitiesDerivative financial liabilities Shift of TJLP curve (1) 17 21(1)TJLP is a Brazilian domestic interest rate. The sensitivities are provided on the net liability position of such level 3 financial instruments.Financial statementsFinancial liability risk exposures are set out in note 25.Analysis of borrowingsAn analysis of borrowings, as presented on the Consolidated balance sheet, is set out below:Due withinone yearDue afterone year<strong>2012</strong> 2011Due withinone yearDue afterone yearUS$ millionTotalTotalSecuredBank loans and overdrafts (1) 5 21 26 55 276 331Obligations under finance leases (2) 3 19 22 4 17 218 40 48 59 293 352UnsecuredBank loans and overdrafts 251 2,871 3,122 673 1,722 2,395Bonds issued under EMTN programme 994 6,382 7,376 163 4,167 4,330US bonds 767 4,628 5,395 – 3,408 3,408Convertible bond (3) – – – – 1,504 1,504Other loans 584 1,229 1,813 123 761 8842,596 15,110 17,706 959 11,562 12,521Total 2,604 15,150 17,754 1,018 11,855 12,873(1)Assets with a book value of $49 million (2011: $408 million) have been pledged as security, of which $35 million (2011: $170 million) are property, plant and equipment, $10 million(2011: $113 million) are financial assets and $4 million (2011: $125 million) are inventories. Related to these assets are borrowings of $26 million (2011: $331 million).(2)Details of assets held under finance leases are provided in note 15. The minimum lease payments under finance leases fall due as follows:US$ million <strong>2012</strong> 2011Within one year 5 4Greater than one year, less than five years 14 12Greater than five years 12 1331 29Future finance charges on finance leases (9) (8)Present value of finance lease liabilities 22 21(3)All outstanding convertible bonds were converted or redeemed during the year, see below.<strong>Anglo</strong> <strong>American</strong> plc <strong>Annual</strong> <strong>Report</strong> <strong>2012</strong> 167
FINANCIAL STATEMENTS NOTES TO THE FINANCIAL STATEMENTS24. FINANCIAL LIABILITIES continuedNet additional medium and long term borrowings were $5,633 million (2011: $964 million) and net repayments of short term borrowings were $747 million(2011: $1,261 million) as disclosed in the Consolidated cash flow statement.Corporate bondsDuring <strong>2012</strong> the Group issued corporate bonds with a US$ equivalent value of $5.1 billion in the US, European and South African markets. These included$600 million 2.625% senior notes due 2017, $750 million 2.625% senior notes due 2017, $600 million 4.125% senior notes due 2022, €750 million 3.50%guaranteed notes due 2022, €750 million 2.75% guaranteed notes due 2019 and €750 million 2.50% guaranteed notes due 2018 issued under the EuroMedium Term Note (EMTN) programme, and R600 million floating rate notes at 3M JIBAR + 1.38% due 2017 and R1.4 billion 9.27% fixed rate notes due 2019issued under the South African Domestic Medium Term Note programme.Convertible bondOn 23 March <strong>2012</strong> <strong>Anglo</strong> <strong>American</strong> plc gave notice that it had exercised its right to redeem its $1.7 billion of convertible bonds (the Bonds) on 22 May <strong>2012</strong>(the optional redemption date). The Bonds were due to mature on 7 May 2014. On 13 April <strong>2012</strong> following the announcement of the recommended 2011 fullyear dividend, and in accordance with the terms and conditions of the Bonds, the conversion price was adjusted from £18.36 to £18.02.Of the $1,700 million Bonds issued, $1,678 million were converted to equity prior to the optional redemption date, including $1 million converted in 2011,and the remaining $22 million were redeemed by the Group. As a result, 62.5 million ordinary shares were issued and the financial liability of $1,529 million,representing the notional value of the outstanding Bonds of $1,699 million less unamortised discount of $170 million, was derecognised. The balance in theconvertible debt reserve of $355 million, which related to the Bonds, was transferred to share premium ($170 million) and retained earnings ($185 million).25. FINANCIAL RISK MANAGEMENT AND DERIVATIVESThe Group is exposed in varying degrees to a variety of financial instrument related risks. The Board approves and monitors the risk management processes,including documented treasury policies, counterparty limits, controlling and reporting structures. The risk management processes of the Group’sindependently listed subsidiaries are in line with the Group’s own policy.The types of risk exposure, the way in which such exposure is managed and quantification of the level of exposure in the Consolidated balance sheet at yearend is provided as follows (subcategorised into credit risk, liquidity risk and market risk).Credit riskThe Group’s principal financial assets, including amounts in assets held for sale, are cash, trade and other receivables, investments and derivative financialinstruments. The Group’s maximum exposure to credit risk primarily arises from these financial assets and is as follows:US$ million <strong>2012</strong> 2011Cash and cash equivalents 9,312 11,732Trade and other receivables (1) 4,003 3,852Financial asset investments (2) 1,331 1,690Derivative financial assets 848 840Financial guarantees (3) 33 5115,527 18,165(1)Trade and other receivables exclude prepayments and accrued income.(2)Financial asset investments exclude available for sale investments.(3)Financial guarantees issued by the Group in respect of third party liabilities represent an exposure to credit risk in excess of the Group’s financial assets.The Group limits credit risk on liquid funds and derivative financial instruments through diversification of exposures with a range of approved financialinstitutions. Counterparty limits are set for each financial institution with reference to credit ratings assigned by S&P, Moody’s and Fitch Ratings.Given the diverse nature of the Group’s operations (both in relation to commodity markets and geographically), together with insurance cover (includingletters of credit from financial institutions), it does not have significant concentration of credit risk in respect of trade receivables, with exposure spread overa large number of customers.An allowance for impairment of trade receivables is made where there is an identified loss event, which based on previous experience, is evidence of areduction in the recoverability of the cash flows. Details of the credit quality of trade receivables and the associated provision for impairment are disclosedin note 21.Liquidity riskThe Group ensures that there are sufficient committed loan facilities (including refinancing, where necessary) in order to meet short term businessrequirements, after taking into account cash flows from operations and its holding of cash and cash equivalents, as well as any Group distribution restrictionsthat exist. In addition, certain projects are financed by means of limited recourse project finance, if appropriate.168 <strong>Anglo</strong> <strong>American</strong> plc <strong>Annual</strong> <strong>Report</strong> <strong>2012</strong>
25. FINANCIAL RISK MANAGEMENT AND DERIVATIVES continuedThe expected undiscounted cash flows of the Group’s financial liabilities (including associated derivatives), by remaining contractual maturity, based onconditions existing at the balance sheet date are as follows:<strong>2012</strong> 2011Within one year One to two years Within one year One to two yearsUS$ millionFixedinterestFloatinginterestCapitalrepaymentFixedinterestFloatinginterestCapitalrepaymentFixedinterestFloatinginterestCapitalrepaymentFixedinterestFloatinginterestCapitalrepaymentFinancial liabilities(excluding derivatives) (647) (202)(1)(6,981) (493) (163) (2,336) (549) (181) (5,962) (1) (549) (127) (2,433)Net settled derivatives (2) 619 (389) (127) 485 (253) (27) 470 (246) 2 470 (250) (140)(28) (591) (7,108) (8) (416) (2,363) (79) (427) (5,960) (79) (377) (2,573)Fixedinterest<strong>2012</strong> 2011Two to five years Greater than five years Two to five years Greater than five yearsFloatinginterestCapitalrepaymentFixedinterestFloatinginterestCapitalrepaymentFixedinterestFloatinginterestCapitalrepaymentFixedinterestFloatinginterestCapitalrepaymentUS$ millionFinancial liabilities(excluding derivatives) (1,064) (218) (5,746) (619) (67) (7,695) (798) (254) (6,551) (354) (104) (3,952)Net settled derivatives (2) 1,058 (551) (464) 616 (308) (126) 761 (305) (468) 350 (127) (219)(6) (769) (6,210) (3) (375) (7,821) (37) (559) (7,019) (4) (231) (4,171)(1)Assumes maximum cash outflow in respect of third party guarantees issued by the Group and repayment of all short term borrowings with no refinancing.(2)The expected maturities are not materially different from the contracted maturities.The Group had the following undrawn committed borrowing facilities at 31 December:US$ million <strong>2012</strong> 2011Expiry dateWithin one year (1) 2,923 1,781Greater than one year, less than two years 569 1,268Greater than two years, less than five years 5,765 5,294Greater than five years – 769,257 8,419(1)Includes undrawn rand facilities equivalent to $1.5 billion (2011: $1.6 billion) in respect of a series of facilities with 364 day maturities which roll automatically on a daily basis, unless noticeis served.Market riskMarket risk is the risk that financial instrument fair values will fluctuate due to changes in market prices. The significant market risks to which the Group isexposed are foreign exchange risk, interest rate risk and commodity price risk.Foreign exchange riskAs a global business, the Group is exposed to many currencies principally as a result of non-US dollar operating costs and to a lesser extent, from non-USdollar revenues. The Group’s policy is generally not to hedge such exposures as hedging is not deemed appropriate given the diversified nature of the Group,though exceptions can be approved by the Group Management Committee.In addition, currency exposures exist in respect of non-US dollar approved capital expenditure projects and non-US dollar borrowings in US dollar functionalcurrency entities. The Group’s policy is that such exposures should be hedged subject to a review of the specific circumstances of the exposure.The exposure of the Group’s financial assets and liabilities (excluding intra-group loan balances) to currency risk is as follows:Financial statementsFinancialassets(excludingderivatives)Impact ofcurrencyderivatives (1)DerivativeassetsTotal financialassets –exposure tocurrency risk<strong>2012</strong> 2011Financialassets(excludingderivatives)Impact ofcurrencyderivatives (1)DerivativeassetsTotal financialassets –exposure tocurrency riskUS$ millionUS dollar 9,241 (64) 808 9,985 10,639 (186) 742 11,195Rand 3,894 64 37 3,995 5,761 186 98 6,045Brazilian real 728 – – 728 839 – – 839Sterling 123 – 1 124 467 – – 467Australian dollar 494 – – 494 383 – – 383Euro 45 – 1 46 9 – – 9Other currencies 561 – 1 562 382 – – 382Total financial assets 15,086 – 848 15,934 18,480 – 840 19,320Financialliabilities(excludingderivatives)Impact ofcurrencyderivatives (1)DerivativeliabilitiesTotal financialliabilities –exposure tocurrency risk<strong>2012</strong> 2011Financialliabilities(excludingderivatives)Impact ofcurrencyderivatives (1)DerivativeliabilitiesTotal financialliabilities –exposure tocurrency riskUS$ millionUS dollar (8,269) (8,492) (1,046) (17,807) (6,970) (5,282) (1,096) (13,348)Rand (3,287) (5) (35) (3,327) (3,595) (37) (16) (3,648)Brazilian real (1,597) 1,119 – (478) (1,608) 1,138 – (470)Sterling (913) 785 – (128) (1,181) 740 – (441)Australian dollar (422) – – (422) (564) – – (564)Euro (6,601) 6,593 – (8) (3,436) 3,428 – (8)Other currencies (1,092) – – (1,092) (473) 13 – (460)Total financial liabilities (22,181) – (1,081) (23,262) (17,827) – (1,112) (18,939)(1)Where currency derivatives are held to manage financial instrument exposures, the notional principal amount is reallocated to reflect the remaining exposure to the Group.<strong>Anglo</strong> <strong>American</strong> plc <strong>Annual</strong> <strong>Report</strong> <strong>2012</strong> 169
FINANCIAL STATEMENTS NOTES TO THE FINANCIAL STATEMENTS25. FINANCIAL RISK MANAGEMENT AND DERIVATIVES continuedInterest rate riskInterest rate risk arises due to fluctuations in interest rates which impact on the value of short term investments and financing activities. The Group’s exposureto interest rate risk is particularly with reference to changes in US and South African interest rates.The Group’s policy is to borrow funds at floating rates of interest as, over the longer term, this is considered by management to give somewhat of a naturalhedge against commodity price movements, given the correlation with economic growth (and industrial activity), which in turn shows a high correlation withcommodity price fluctuation. In certain circumstances, the Group uses interest rate swap contracts to manage its exposure to interest rate movements on aportion of its existing debt. Strategic hedging using fixed rate debt may also be undertaken from time to time if approved by the Group Management Committee.In respect of financial assets, the Group’s policy is to invest cash at floating rates of interest and to maintain cash reserves in short term investments (less thanone year) in order to maintain liquidity, while achieving a satisfactory return for shareholders.The exposure of the Group’s financial assets (excluding intra-group loan balances) to interest rate risk is as follows:FloatingrateInterest bearingfinancial assetsFixedrate (1)Non-interestbearing financial assetsEquityinvestments Other Total<strong>2012</strong> 2011FloatingrateInterest bearingfinancial assetsFixedrate (1)Non-interestbearing financial assetsEquityinvestments Other TotalUS$ millionFinancial assets (excluding derivatives) (2) 9,651 508 1,062 3,865 15,086 12,623 689 1,206 3,962 18,480Derivative assets 748 – – 100 848 638 – – 202 840Financial asset exposure to interestrate risk 10,399 508 1,062 3,965 15,934 13,261 689 1,206 4,164 19,320(1)Includes $397 million (2011: $534 million) of preference shares in BEE entities.(2)At 31 December <strong>2012</strong> and 31 December 2011 no interest rate swaps were held in respect of financial asset exposures.Floating rate financial assets consist mainly of cash and bank term deposits. Interest on floating rate financial assets is based on the relevant nationalinter-bank rates. Fixed rate financial assets consist principally of financial asset investments and cash, and have a weighted average interest rate of 11.6%(2011: 12.7%) for an average period of one year (2011: three years). Equity investments have no maturity period and the majority are fully liquid.The exposure of the Group’s financial liabilities (excluding intra-group loan balances) to interest rate risk is as follows:FloatingrateInterest bearingfinancial liabilitiesFixedrateNon-interestbearingfinancialliabilities<strong>2012</strong> 2011FloatingrateInterest bearingfinancial liabilitiesFixedrateNon-interestbearingfi n a n c i a lliabilitiesUS$ millionTotalTotalFinancial liabilities (excluding derivatives) (4,296) (13,444) (4,441) (22,181) (3,254) (9,610) (4,963) (17,827)Impact of interest rate swaps (1) (13,135) 13,135 – – (8,074) 8,074 – –Derivative liabilities (165) – (916) (1,081) (158) – (954) (1,112)Financial liability exposure to interest rate risk (17,596) (309) (5,357) (23,262) (11,486) (1,536) (5,917) (18,939)(1)Where interest rate swaps are held to manage financial liability exposures the notional principal amount is reallocated to reflect the remaining exposure to the Group.Interest on floating rate financial liabilities is based on the relevant national inter-bank rates. Remaining fixed rate borrowings accrue interest at a weightedaverage interest rate of 6.2% (2011: 9.3%) for an average period of three years (2011: two years). Average maturity on non-interest bearing instruments is17 months (2011: 12 months).Commodity price riskThe Group’s earnings are principally exposed to movements in the prices of the commodities it produces.The Group policy is generally not to hedge commodity price risk, although some hedging may be undertaken for strategic reasons. In such cases, the Groupgenerally uses forward and deferred contracts to hedge the price risk.Certain of the Group’s sales and purchases are provisionally priced and as a result are susceptible to future price movements. The exposure of the Group’sfinancial assets and liabilities to commodity price risk is as follows:Commodity price linkedSubject topricemovementsFixedprice (1)Notlinked tocommodityprice<strong>2012</strong> 2011Commodity price linkedNotSubject tolinked topriceFixed commodityTotal movementsprice (1) priceTotalUS$ millionTotal net financial instruments (excludingderivatives) 304 1,087 (8,486) (7,095) 352 945 (644) 653Commodity derivatives (net) (1) – – (1) (17) – – (17)Non-commodity derivatives (net) – – (232) (232) – – (255) (255)Total financial instrument exposure tocommodity risk 303 1,087 (8,718) (7,328) 335 945 (899) 381(1)Includes receivables and payables for commodity sales and purchases not subject to price adjustment at the balance sheet date.170 <strong>Anglo</strong> <strong>American</strong> plc <strong>Annual</strong> <strong>Report</strong> <strong>2012</strong>
25. FINANCIAL RISK MANAGEMENT AND DERIVATIVES continuedDerivativesIn accordance with IAS 32 Financial Instruments: Presentation and IAS 39, the fair values of derivatives are separately recorded on the balance sheet within‘Derivative financial assets’ and ‘Derivative financial liabilities’. Derivatives are classified as current or non-current depending on the maturity of the derivative.The Group utilises derivative instruments to manage certain market risk exposures as explained above. The Group does not use derivative financialinstruments for speculative purposes, however it may choose not to designate certain derivatives as hedges for accounting purposes. Such derivatives areclassified as ‘non-hedges’ and fair value movements are recorded in the income statement.The use of derivative instruments is subject to limits and the positions are regularly monitored and reported to senior management.Embedded derivativesDerivatives embedded in other financial instruments or other host contracts are treated as separate derivatives when their risks and characteristics are notclosely related to those of their host contract and the host contract is not carried at fair value. Embedded derivatives may be designated into hedgerelationships and are accounted for in accordance with the Group’s accounting policy set out in note 1.Cash flow hedgesIn certain cases the Group classifies its forward foreign currency and commodity price contracts, which hedge highly probable forecast transactions, as cashflow hedges. Where this designation is documented, changes in fair value are recognised in equity until the hedged transactions occur, at which time therespective gains or losses are transferred to the income statement (or hedged balance sheet item) in accordance with the Group’s accounting policy set outin note 1.Fair value hedgesThe majority of interest rate swaps (taken out to swap the Group’s fixed rate borrowings to floating rate, in accordance with the Group’s policy) have been designatedas fair value hedges. The carrying value of the hedged debt is adjusted at each balance sheet date to reflect the impact on its fair value of changes in marketinterest rates. Changes in the fair value of the hedged debt are offset against fair value changes in the interest rate swap and classified within net finance costsin the income statement.Non-hedgesThe Group may choose not to designate certain derivatives as hedges. This may occur where the Group is economically hedged but IAS 39 hedge accountingcannot be achieved or where gains and losses on both the derivative and hedged item naturally offset in the income statement, which for example may be thecase for certain cross currency swaps of non-US dollar debt. Where derivatives have not been designated as hedges, fair value changes are recognised in theincome statement in accordance with the Group’s accounting policy set out in note 1 and are classified as financing or operating depending on the nature ofthe associated hedged risk.The fair value of the Group’s open derivative position at 31 December (excluding normal purchase and sale contracts held off balance sheet), recorded within‘Derivative financial assets’ and ‘Derivative financial liabilities’ is as follows:CurrentNon-current<strong>2012</strong> 2011 <strong>2012</strong> 2011US$ million Asset Liability Asset Liability Asset Liability Asset LiabilityCash flow hedgeForward foreign currency contracts 3 – 6 (1) – – – –Fair value hedgeInterest rate swaps 31 – – – 687 (6) 538 –Forward commodity contracts 1 (2) – (5) – – – –Non-hedge (‘Held for trading’)Forward foreign currency contracts 35 (124) 117 (121) – (1) 11 (33)Cross currency swaps 31 (124) 49 – 60 (781) 55 (908)Other – (30) – (35) – (13) 64 (9)101 (280) 172 (162) 747 (801) 668 (950)Financial statementsThese marked to market valuations are in no way predictive of the future value of the hedged position, nor of the future impact on the profit of the Group.The valuations represent the cost of closing all hedge contracts at year end, at market prices and rates available at the time.Normal purchase and normal sale contractsCommodity based contracts that meet the scope exemption in IAS 39 (in that they are settled through physical delivery of the Group’s production or are usedwithin the production process), are classified as normal purchase or sale contracts. In accordance with IAS 39 these contracts are not marked to market.Capital risk managementThe Group’s objectives when managing capital are to safeguard the Group’s ability to continue as a going concern in order to provide returns for shareholdersand benefits for other stakeholders and, with cognisance of forecast future market conditions and structuring, to maintain an optimal capital structure toreduce the cost of capital.In order to manage the short and long term capital structure, the Group adjusts the amount of ordinary dividends paid to shareholders, returns capital toshareholders (via, for example, share buybacks and special dividends), arranges debt to fund new acquisitions and may also sell non-core assets to reduce debt.<strong>Anglo</strong> <strong>American</strong> plc <strong>Annual</strong> <strong>Report</strong> <strong>2012</strong> 171
FINANCIAL STATEMENTS NOTES TO THE FINANCIAL STATEMENTS25. FINANCIAL RISK MANAGEMENT AND DERIVATIVES continuedThe Group monitors capital on the basis of the ratio of net debt to total capital (gearing). Net debt is calculated as total borrowings less cash and cashequivalents (including derivatives which provide an economic hedge of debt and the net debt of disposal groups). Total capital is calculated as ‘Net assets’(as shown in the Consolidated balance sheet) excluding net debt. Total capital and gearing are as follows:US$ million <strong>2012</strong> 2011 2010Net assets 43,787 43,189 37,971Net debt including hedges (see note 31c) 8,615 1,374 7,384Total capital 52,402 44,563 45,355Gearing 16.4% 3.1% 16.3%The increase in gearing since 31 December 2011 reflects the $7.2 billion increase in net debt in the year. Net assets at 31 December <strong>2012</strong> were $0.6 billionhigher than at 31 December 2011 due to net movements in equity, including the conversion of the convertible bond, offsetting the retained loss for the year.Gearing levels remain at a sustainable level given the Group’s strong level of operating cash flows.Financial instrument sensitivitiesFinancial instruments affected by market risk include borrowings, deposits, derivative financial instruments, trade receivables and trade payables. Thefollowing analysis, required by IFRS 7, is intended to illustrate the sensitivity of the Group’s financial instruments (at 31 December) to changes in commodityprices, interest rates and foreign currencies.The sensitivity analysis has been prepared on the basis that the components of net debt, the ratio of fixed to floating interest rates of the debt and derivativesportfolio and the proportion of financial instruments in foreign currencies are all constant and on the basis of the hedge designations in place at 31 December.In addition, the commodity price impact for provisionally priced contracts is based on the related trade receivables and trade payables at 31 December. As aconsequence, this sensitivity analysis relates to the position at 31 December.The following assumptions were made in calculating the sensitivity analysis:• All income statement sensitivities also impact equity.• For debt and other deposits carried at amortised cost, carrying value does not change as interest rates move.• No sensitivity is provided for interest accruals as these are based on pre-agreed interest rates and therefore are not susceptible to further rate changes.• Changes in the carrying value of derivatives (from movements in commodity prices and interest rates) designated as cash flow hedges are assumed to berecorded fully within equity on the grounds of materiality.• No sensitivity has been calculated on derivatives and related underlying instruments designated into fair value hedge relationships as these are assumedmaterially to offset one another.• All hedge relationships are assumed to be fully effective on the grounds of materiality.• Debt with a maturity of less than one year is floating rate, unless it is a long term fixed rate debt in its final year.• Translation of foreign subsidiaries and operations into the Group’s presentation currency has been excluded from the sensitivity.Using the above assumptions, the following table shows the illustrative effect on the income statement and equity that would result from reasonably possiblechanges in the relevant commodity price. The Group has determined that at 31 December <strong>2012</strong> and 31 December 2011, based on the above assumptions,there is no significant sensitivity to changes in market interest rates.<strong>2012</strong> 2011US$ millionIncomestatement EquityIncomestatement EquityForeign currency sensitivities (1)+10% US dollar to rand (74) (73) (81) (77)–10% US dollar to rand 74 73 81 77+10% US dollar to Brazilian real (2) 190 190 402 405–10% US dollar to Brazilian real (2) (194) (194) (279) (282)+10% US dollar to Australian dollar 41 41 36 36–10% US dollar to Australian dollar (41) (41) (36) (36)+10% US dollar to Chilean peso (2) 29 29 15 15–10% US dollar to Chilean peso (2) (36) (36) (18) (18)Commodity price sensitivities10% increase in the copper price 63 63 37 3710% decrease in the copper price (63) (63) (37) (37)10% increase in the platinum price (17) (17) (15) (15)10% decrease in the platinum price 17 17 15 15(1)+ represents strengthening of US dollar against the respective currency.(2)Includes sensitivities for non-hedge derivatives related to capital expenditure.The above sensitivities are calculated with reference to a single moment in time and are subject to change due to a number of factors including:• fluctuating trade receivable and trade payable balances• derivative instruments and borrowings settled throughout the year• fluctuating cash balances• changes in currency mixAs the sensitivities are limited to year end financial instrument balances, they do not take account of the Group’s sales and operating costs, which are highlysensitive to changes in commodity prices and exchange rates. In addition, each of the sensitivities is calculated in isolation, whilst in reality commodity prices,interest rates and foreign currencies do not move independently.172 <strong>Anglo</strong> <strong>American</strong> plc <strong>Annual</strong> <strong>Report</strong> <strong>2012</strong>
26. PROVISIONS FOR LIABILITIES AND CHARGESUS$ millionEnvironmentalrestoration (1) Decommissioning (1) Employeebenefits Other TotalAt 1 January 989 349 257 607 2,202Acquired through business combinations 83 129 118 217 547Charged to the income statement 90 – 218 424 732Capitalised 37 42 – (9) 70Unwinding of discount 60 29 1 12 102Amounts applied (37) (2) (129) (109) (277)Unused amounts reversed (34) (1) – (143) (178)Transfer to liabilities directly associated with assets classified as held for sale (83) (22) (10) (108) (223)Currency movements (16) (7) (16) 12 (27)At 31 December 1,089 517 439 903 2,948(1)The Group makes contributions to controlled funds to meet the cost of some of its environmental restoration and decommissioning liabilities, see note 16.<strong>2012</strong>Maturity analysis of total provisions:US$ million <strong>2012</strong> 2011Current 564 372Non-current 2,384 1,8302,948 2,202Environmental restorationThe Group has an obligation to undertake restoration, rehabilitation and environmental work when environmental disturbance is caused by the developmentor ongoing production of a mining property. A provision is recognised for the present value of such costs. It is anticipated that these costs will be incurred overa period in excess of 20 years.DecommissioningProvision is made for the present value of costs relating to the decommissioning of plant or other site restoration work. It is anticipated that these costs will beincurred over a period in excess of 20 years.Employee benefitsProvision is made for statutory or contractual employee entitlements including long service leave, annual leave, sickness pay obligations and cash settledshare-based payment obligations. It is anticipated that these costs will be incurred when employees choose to take their benefits.OtherOther provisions primarily relate to indemnities, warranties and legal claims. It is anticipated that these costs will be incurred over a five year period. Otherprovisions also includes obligations for certain long term contracts where the unavoidable costs of meeting the Group’s obligations is expected to exceedthe benefits to be received, see note 5. It is anticipated these costs will be incurred over a period in excess of 15 years.Financial statements27. DEFERRED TAXThe movement in net deferred tax liabilities during the year is as follows:US$ million <strong>2012</strong> 2011At 1 January (5,200) (5,252)Credited/(charged) to the income statement 1,090 (550)(Charged)/credited to the statement of comprehensive income (86) 10Charged directly to equity (110) (127)Acquired through business combinations (850) –Transfer to assets held for sale 118 –Disposal of businesses – 5Currency movements 192 714At 31 December (4,846) (5,200)Comprising:Deferred tax assets 1,223 530Deferred tax liabilities (6,069) (5,730)The amount of deferred tax recognised in the balance sheet is as follows:US$ million <strong>2012</strong> 2011Deferred tax assetsTax losses 374 273Post employment benefits 118 35Share-based payments 9 15Enhanced tax depreciation 560 –Other temporary differences 162 2071,223 530Deferred tax liabilitiesCapital allowances in excess of depreciation (3,311) (3,334)Fair value adjustments (2,582) (1,806)Tax losses 29 103Derivatives 15 (167)Provisions 416 393Chilean withholding tax (570) (656)Other temporary differences (66) (263)(6,069) (5,730)<strong>Anglo</strong> <strong>American</strong> plc <strong>Annual</strong> <strong>Report</strong> <strong>2012</strong> 173
FINANCIAL STATEMENTS NOTES TO THE FINANCIAL STATEMENTS27. DEFERRED TAX continuedThe amount of deferred tax credited/(charged) to the income statement is as follows:US$ million <strong>2012</strong> 2011Capital allowances in excess of depreciation (22) (615)Fair value adjustments (133) (118)Tax losses 11 167Derivatives 99 36Provisions 41 82Chilean withholding taxes 86 (137)Other temporary differences(1)1,008 351,090 (550)(1)In <strong>2012</strong> this principally relates to Minas-Rio ($960 million credit). This is made up of a deferred tax credit of $1,360 million in relation to the impairment of Minas-Rio and a deferred tax charge of$400 million in relation to the partial derecognition of a deferred tax asset for enhanced tax depreciation in Minas-Rio.The current expectation regarding the maturity of deferred tax balances is as follows:US$ million <strong>2012</strong> 2011Deferred tax assetsRecoverable within one year 131 52Recoverable after one year 1,092 4781,223 530Deferred tax liabilitiesPayable within one year (368) (505)Payable after one year (5,701) (5,225)(6,069) (5,730)The Group has the following balances in respect of which no deferred tax asset has been recognised:Taxlosses –revenueTaxlosses –capitalOthertemporarydifferences<strong>2012</strong> 2011Taxlosses –revenueTaxlosses –capitalOthertemporarydifferencesUS$ millionTotalTotalExpiry dateWithin one year 17 – – 17 – – – –Greater than one year, less than five years 286 – – 286 – – – –Greater than five years 3 – 2,997 3,000 111 – – 111No expiry date 4,467 1,097 1,953 7,517 3,082 1,067 403 4,5524,773 1,097 4,950 10,820 3,193 1,067 403 4,663The Group also has unused tax credits of $16 million (2011: $18 million) for which no deferred tax asset is recognised in the balance sheet. All of these creditsexpire within five years.No deferred tax has been recognised in respect of temporary differences associated with investments in subsidiaries, branches and associates and interestsin joint ventures where the Group is in a position to control the timing of the reversal of the temporary differences and it is probable that such differenceswill not reverse in the foreseeable future. The aggregate amount of temporary differences associated with such investments in subsidiaries, branches andassociates and interests in joint ventures is represented by the contribution of those investments to the Group’s retained earnings and amounted to$22,442 million (2011: $25,876 million).28. RETIREMENT BENEFITSThe Group operates a number of defined contribution and defined benefit pension plans. It also operates post employment medical arrangements,principally in southern Africa.Defined contribution plansThe defined contribution pension and medical cost represents the actual contributions payable by the Group to the various plans. At 31 December <strong>2012</strong> therewere no material outstanding or prepaid contributions and so no accrual or prepayment has been disclosed in the balance sheet in relation to these plans.The assets of the defined contribution plans are held separately in independently administered funds. The charge in respect of these plans is calculated on thebasis of the contribution payable by the Group in the financial year. The charge for the year for defined contribution pension plans (net of amounts capitalised)was $262 million (2011: $254 million) and for defined contribution medical plans (net of amounts capitalised) was $69 million (2011: $57 million).Defined benefit pension plans and post employment medical plansFollowing the Group’s acquisition of De Beers on 16 August <strong>2012</strong>, the Group has consolidated the defined benefit pension and post employment healthcareplans of De Beers.The majority of the defined benefit pension plans are funded. The assets of these plans are held separately from those of the Group, in independentlyadministered funds, in accordance with statutory requirements or local practice throughout the world. The unfunded liabilities are principally in relation totermination indemnity plans in South America.The post employment medical arrangements provide health benefits to retired employees and certain dependants. Eligibility for cover is dependent uponcertain criteria. The majority of these plans are unfunded, and are principally in southern Africa.The Group’s provision of anti-retroviral therapy to HIV positive staff has not significantly impacted the post employment medical plan liability.Independent qualified actuaries carry out full valuations every three years using the projected unit credit method. The actuaries have updated the valuationsto 31 December <strong>2012</strong>.174 <strong>Anglo</strong> <strong>American</strong> plc <strong>Annual</strong> <strong>Report</strong> <strong>2012</strong>
28. RETIREMENT BENEFITS continuedActuarial assumptionsThe principal assumptions used to determine the actuarial present value of benefit obligations and pension charges and credits under IAS 19 EmployeeBenefits are detailed below (shown as weighted averages):SouthernAfricaTheAmericas<strong>2012</strong> 2011SouthernAfricaTheAmericas%EuropeEuropeDefined benefit pension plansAverage discount rate for plan liabilities 8.1 6.9 4.3 8.5 7.8 4.8Average rate of inflation 6.3 3.5 2.8 6.5 3.6 2.7Average rate of increase in salaries 8.3 6.2 2.9 7.8 6.5 n/aAverage rate of increase of pensions in payment 6.3 3.2 3.1 6.5 3.3 3.0Average long term rate of return on plan assets (3) 8.4 10.2 4.2 9.2 12.8 5.0Post employment medical plansAverage discount rate for plan liabilities 8.0 n/a 3.7 8.5 n/a n/aAverage rate of inflation 6.3 n/a 2.3 6.5 n/a n/aExpected average increase in healthcare costs 7.7 n/a 7.0 7.9 n/a n/a(1) (2) (1) (2)(1)With the exception of De Beers, plans in southern Africa have ceased future accrual of benefits but some benefits remain linked to salary increases.(2)With the exception of De Beers, European plans have ceased future accrual of benefits.(3)The long term expected return on plan assets has been set with reference to current market yields on government and corporate bonds, plus expected equity and corporate bondoutperformanceover government bonds in the relevant jurisdictions. The expected return on cash assets has been set with reference to current bank base rates. The overall long termexpected rate of return for each asset class is weighted by the asset allocation to the asset class at the balance sheet date.Mortality assumptions are determined based on standard mortality tables with adjustments, as appropriate, to reflect experience of conditions locally.In southern Africa, the PA90 tables (2011: PA90 tables) are used. The main plans in Europe use the SAPS tables with plan specific adjustments basedon mortality investigations (2011: SAPS tables). The main plans in the Americas use the RV2009 and AT2000 tables (2011: RV2009 and AT2000 tables).The mortality tables used imply that a male or female aged 60 at the balance sheet date has the following future life expectancy:MaleFemaleYears <strong>2012</strong> 2011 <strong>2012</strong> 2011Southern Africa 20.1 20.9 24.9 25.8The Americas 23.3 23.2 27.4 27.2Europe 28.5 27.4 30.1 30.0Summary of plans by geographyThe Group’s plans in respect of pension and post employment healthcare are summarised as follows:SouthernAfricaTheAmericas Europe Total<strong>2012</strong> 2011SouthernAfricaTheAmericas Europe TotalUS$ millionAssets (1)Defined benefit pension plans in surplus 176 – – 176 70 – – 70Financial statementsLiabilitiesDefined benefit pension plans in deficit – (225) (603) (828) – (181) (171) (352)Post employment medical plans in deficit (573) – (8) (581) (287) – – (287)(573) (225) (611) (1,409) (287) (181) (171) (639)(1)Amounts are included in ‘Other non-current assets’.Five year summary of plan assets and liabilitiesUS$ million <strong>2012</strong> 2011 2010 2009 2008Defined benefit pension plansFair value of plan assets 5,327 2,583 2,732 2,731 2,073Present value of plan liabilities (5,862) (2,792) (2,840) (2,975) (2,157)Net deficit (535) (209) (108) (244) (84)Surplus restriction (117) (73) (59) (106) (61)Net deficit after surplus restriction (652) (282) (167) (350) (145)Actuarial gain/(loss) on plan assets (1) 151 (32) 76 184 (392)Actuarial gain/(loss) on plan liabilities (2) 66 (135) 19 (361) 208Post employment medical plansFair value of plan assets 21 22 25 20 17Present value of plan liabilities (602) (309) (337) (322) (241)Net deficit (581) (287) (312) (302) (224)Actuarial gain on plan assets (3) – 1 2 – 1Actuarial (loss)/gain on plan liabilities (4) (35) (22) (13) (10) 16(1)Net experience gains on pension plan assets were $151 million (2011: losses of $32 million; 2010: gains of $76 million; 2009: gains of $184 million; 2008: losses of $392 million).(2)Net experience losses on pension plan liabilities were $123 million (2011: losses of $10 million; 2010: gains of $38 million; 2009: losses of $17 million; 2008: losses of $29 million).(3)Net experience gains on medical plan assets were nil (2011: gains of $1 million; 2010: gains of $2 million; 2009: nil; 2008: gains of $1 million).(4)Net experience losses on medical plan liabilities were $32 million (2011: losses of $1 million; 2010: gains of $5 million; 2009: losses of $3 million; 2008: losses of $7 million).<strong>Anglo</strong> <strong>American</strong> plc <strong>Annual</strong> <strong>Report</strong> <strong>2012</strong> 175
FINANCIAL STATEMENTS NOTES TO THE FINANCIAL STATEMENTS28. RETIREMENT BENEFITS continuedThe actuarial gain recognised in the Consolidated statement of comprehensive income of $165 million (2011: loss of $214 million) includes a charge for theincrease in the surplus restriction of $17 million (2011: charge for the increase of $26 million). The movement in the surplus restriction in the Consolidatedstatement of comprehensive income differs from that in the table above due to the exclusion of a surplus restriction on De Beers’ pension plans of $30 millionarising from the acquisition, and exchange differences. Cumulative net actuarial losses recognised in the Consolidated statement of comprehensive incomeare $427 million (2011: $592 million; 2010: $378 million; 2009: $509 million; 2008: $292 million).Income statementThe amounts recognised in the income statement are as follows:PensionplansPostemploymentmedicalplans<strong>2012</strong> 2011PensionplansPostemploymentmedicalplansUS$ millionTotalTotalAnalysis of the amount charged to operating profitCurrent service costs 18 4 22 18 3 21Effects of settlements 9 – 9 – – –Total within operating costs 27 4 31 18 3 21Analysis of the amount charged to net finance costsExpected return on plan assets (1) (199) (1) (200) (197) (2) (199)Interest costs on plan liabilities (2) 196 34 230 181 24 205Net charge to net finance costs (3) 33 30 (16) 22 6Total charge to the income statement 24 37 61 2 25 27(1)Included in ‘Investment income’, see note 9.(2)Included in ‘Interest expense’, see note 9.Pension plan assets and liabilities by geographyThe split of the present value of funded and unfunded obligations in defined benefit pension plans, the fair value of the pension assets and the long termexpected rate of return at 31 December are as follows:<strong>2012</strong> 2011Southern Africa The Americas Europe Total Southern Africa The Americas Europe TotalRate ofreturn%FairvalueUS$millionRate ofreturn%FairvalueUS$millionRate ofreturn%FairvalueUS$millionEquity 9.5 652 7.0 11 5.5 1,150 1,813 11.5 283 14.6 13 7.0 726 1,022Bonds 7.8 1,077 10.5 133 3.8 1,605 2,815 8.1 512 12.6 124 3.7 715 1,351Other 7.7 116 10.7 3 2.6 580 699 6.5 42 11.8 5 1.4 163 210Fair value of pensionplan assets (1) 1,845 147 3,335 5,327 837 142 1,604 2,583Present value offunded obligations (1) (1,589) (163) (3,895) (5,647) (718) (150) (1,751) (2,619)Present value ofunfunded obligations – (209) (6) (215) – (173) – (173)Present value of pensionplan liabilities (1,589) (372) (3,901) (5,862) (718) (323) (1,751) (2,792)Net surplus/(deficit)in pension plans 256 (225) (566) (535) 119 (181) (147) (209)Surplus restriction relatedto pension plans (80) – (37) (117) (49) – (24) (73)Recognised pensionplan assets/(liabilities) 176 (225) (603) (652) 70 (181) (171) (282)Amounts in thebalance sheetPension assets 176 – – 176 70 – – 70Pension liabilities – (225) (603) (828) – (181) (171) (352)176 (225) (603) (652) 70 (181) (171) (282)(1)The fair value of assets was used to determine the funding level of the plans. The fair value of the assets of the funded plans was sufficient to cover 94% (2011: 99%) of the benefits thathad accrued to members after allowing for expected increases in future earnings and pensions. Companies within the Group are paying contributions as required in accordance with localactuarial advice.FairvalueUS$millionRate ofreturn%FairvalueUS$millionRate ofreturn%FairvalueUS$millionRate ofreturn%FairvalueUS$millionFairvalueUS$million176 <strong>Anglo</strong> <strong>American</strong> plc <strong>Annual</strong> <strong>Report</strong> <strong>2012</strong>
28. RETIREMENT BENEFITS continuedMovement analysisThe changes in the fair value of plan assets are as follows:PensionplansPostemploymentmedicalplans<strong>2012</strong> 2011PensionplansPostemploymentmedicalplansUS$ millionTotalTotalAt 1 January 2,583 22 2,605 2,732 25 2,757Acquired through business combinations 2,417 – 2,417 – – –Effects of settlements (50) – (50) (31) – (31)Expected return(1)199 1 200(1)197 2 199Actuarial gains/(losses)(1)151 – 151(1)(32) 1 (31)Contributions paid by employer (2) 90 – 90 81 – 81Benefits paid (151) (1) (152) (136) (1) (137)Contributions paid by plan participants 1 – 1 1 – 1Currency movements 87 (1) 86 (229) (5) (234)At 31 December 5,327 21 5,348 2,583 22 2,605(1)The actual return on assets in respect of pension plans was $350 million (2011: $165 million).(2)The Group expects to contribute approximately $162 million to its pension plans and $32 million to its post employment medical plans in 2013.The changes in the present value of defined benefit obligations are as follows:Postemploymentmedicalplans<strong>2012</strong> 2011PostemploymentmedicalplansUS$ millionPensionplansTotalPensionplansTotalAt 1 January (2,792) (309) (3,101) (2,840) (337) (3,177)Acquired through business combinations (2,974) (302) (3,276) – – –Current service costs (18)(1)(3) (21) (18) (3) (21)Effects of settlements 41 – 41 31 – 31Interest costs (196)(1)(30) (226) (181) (24) (205)Actuarial gains/(losses) 66(1)(36) 30 (135) (22) (157)Benefits paid 151(1)24 175 136 16 152Contributions paid by plan participants (1) – (1) (1) – (1)Transfer to liabilities directly associated with assets held for sale – 39 39 – – –Currency movements (139) 15 (124) 216 61 277At 31 December (5,862) (602) (6,464) (2,792) (309) (3,101)(1)Movements in post employment medical plans exclude movements within the obligations transferred to held for sale.Healthcare sensitivity analysisAmounts recognised in the Consolidated income statement in respect of post employment medical plans are sensitive to assumed healthcare cost trend rates.A 1% change in assumed healthcare cost trend rates would have the following effects:Financial statements1% increase 1% decreaseUS$ million <strong>2012</strong> 2011 <strong>2012</strong> 2011Effect on the sum of service costs and interest costs 8 4 (5) (3)Effect on defined benefit obligations 78 35 (63) (28)29. CALLED-UP SHARE CAPITAL AND SHARE-BASED PAYMENTSCalled-up share capital<strong>2012</strong> 2011Number of shares US$ million Number of shares US$ millionCalled-up, allotted and fully paid:5% cumulative preference shares of £1 each 50,000 – 50,000 –Ordinary shares of 54 86 /91 US cents each:At 1 January 1,342,967,458 738 1,342,932,714 738Allotted during the year 62,492,295 34 34,744 –At 31 December 1,405,459,753 772 1,342,967,458 738During <strong>2012</strong>, 8,354 ordinary shares of 54 86 /91 US cents each were allotted to certain non-executive directors by subscription of their post-tax directors’ fees(2011: 5,487 ordinary shares). In addition, 62,483,941 ordinary shares of 54 86 /91 US cents each were allotted upon the conversion of <strong>Anglo</strong> <strong>American</strong> plcconvertible bonds due 2014 (2011: 29,257), see note 24.Excluding shares held in treasury (but including the shares held by the Group in other structures, as outlined in the Tenon and Employee benefit trust sectionsbelow) the number and carrying value of called-up, allotted and fully paid ordinary shares as at 31 December <strong>2012</strong> was 1,390,954,633 and $764 million (2011:1,323,428,547; $727 million).At general meetings, every member who is present in person has one vote on a show of hands and, on a poll, every member who is present in person or byproxy has one vote for every ordinary share held.<strong>Anglo</strong> <strong>American</strong> plc <strong>Annual</strong> <strong>Report</strong> <strong>2012</strong> 177
FINANCIAL STATEMENTS NOTES TO THE FINANCIAL STATEMENTS29. CALLED-UP SHARE CAPITAL AND SHARE-BASED PAYMENTS continuedIn the event of winding up, the holders of the cumulative preference shares will be entitled to the repayment of a sum equal to the nominal capital paid up, orcredited as paid up, on the cumulative preference shares held by them and any accrued dividend, whether such dividend has been earned or declared or not,calculated up to the date of the winding up.No ordinary shares were allotted on exercise of employee share option plans (2011: nil).Own sharesNumber of ordinary shares of 54 86 /91 US cents <strong>2012</strong> 2011Own sharesTreasury shares 14,505,120 19,538,911Own shares held by subsidiaries and employee benefit trusts 115,970,790 115,226,079Total own shares 130,475,910 134,764,990The movement in treasury shares during the year is as follows:Number of ordinary shares of 54 86 /91 US cents <strong>2012</strong> 2011Treasury sharesAt 1 January 19,538,911 22,880,468Transferred to employees in settlement of share awards (5,033,791) (3,341,557)At 31 December 14,505,120 19,538,911TenonTenon Investment Holdings (Pty) Limited (Tenon), a wholly owned subsidiary of <strong>Anglo</strong> <strong>American</strong> South Africa Limited (AASA), has entered into agreementswith Epoch Investment Holdings Limited (Epoch), Epoch Two Investment Holdings Limited (Epoch Two) and Tarl Investment Holdings Limited (Tarl)(collectively the Investment Companies), each owned by independent charitable trusts whose trustees are independent of the Group. Under the terms of theseagreements, the Investment Companies have purchased <strong>Anglo</strong> <strong>American</strong> plc shares on the market and have granted to Tenon the right to nominate a thirdparty (which may include <strong>Anglo</strong> <strong>American</strong> plc but not any of its subsidiaries) to take transfer of the <strong>Anglo</strong> <strong>American</strong> plc shares each has purchased on themarket. Tenon paid the Investment Companies 80% of the cost of the <strong>Anglo</strong> <strong>American</strong> plc shares including associated costs for this right to nominate, whichtogether with subscriptions by Tenon for non-voting participating redeemable preference shares in the Investment Companies, provided all the fundingrequired to acquire the <strong>Anglo</strong> <strong>American</strong> plc shares through the market. These payments by Tenon were sourced from the cash resources of AASA. Tenon isable to exercise its right of nomination at any time up to 31 December 2025 against payment of an average amount of $6.41 per share to Epoch, $9.96 pershare to Epoch Two and $8.27 per share to Tarl which will be equal to 20% of the total costs respectively incurred by Epoch, Epoch Two and Tarl in purchasingshares nominated for transfer to the third party. These funds will then become available for redemption of the preference shares issued by the InvestmentCompanies. The amount payable by the third party on receipt of the <strong>Anglo</strong> <strong>American</strong> plc shares will accrue to Tenon and, in accordance with paragraph 33 ofIAS 32, any resulting gain or loss recorded by Tenon will not be recognised in the Consolidated income statement of <strong>Anglo</strong> <strong>American</strong> plc.Under the agreements, the Investment Companies will receive dividends on the shares they hold and have agreed to waive the right to vote on those shares.The preference shares issued to the charitable trusts are entitled to a participating right of up to 10% of the profit after tax of Epoch and 5% of the profit aftertax of Epoch Two and Tarl. The preference shares issued to Tenon will carry a fixed coupon of 3% plus a participating right of up to 80% of the profit after tax ofEpoch and 85% of the profit after tax of Epoch Two and Tarl. Any remaining distributable earnings in the Investment Companies, after the above dividends, arethen available for distribution as ordinary dividends to the charitable trusts.The structure effectively provides Tenon with a beneficial interest in the price risk on these shares together with a participation in future dividend receipts.The Investment Companies will retain legal title to the shares until Tenon exercises its right to nominate a transferee.At 31 December <strong>2012</strong> the Investment Companies together held 112,300,129 (2011: 112,300,129) <strong>Anglo</strong> <strong>American</strong> plc shares, which represented 8.1%(2011: 8.5%) of the ordinary shares in issue (excluding treasury shares) with a market value of $3,455 million (2011: $4,125 million). The InvestmentCompanies are not permitted to hold more than an aggregate of 10% of the issued share capital of <strong>Anglo</strong> <strong>American</strong> plc at any one time.Although the Group has no voting rights in the Investment Companies and cannot appoint or remove trustees of the charitable trusts, the InvestmentCompanies continue to meet the accounting definition of a subsidiary in accordance with IAS 27. As a result, the Investment Companies are consolidated inaccordance with the definitions of IAS 27 and the principles set out in SIC-12.Employee benefit trustThe provision of shares to certain of the Company’s share option and share incentive schemes may be facilitated by an employee benefit trust or settled bythe issue of treasury shares. During <strong>2012</strong> no shares (2011: nil) from the trust were transferred to employees in settlement of share awards. The employeebenefit trust has waived the right to receive dividends on these shares.The market value of the 985 shares (2011: 985 shares) held by the trust at 31 December <strong>2012</strong> was $30,000 (2011: $36,000).The costs of operating the trust are borne by the Group but are not material.Share-based paymentsDuring the year ended 31 December <strong>2012</strong> the Group had share-based payment arrangements with employees relating to shares of the Company, the detailsof which are described in the Remuneration report. All of these Company schemes are equity settled, either by award of ordinary shares (BSP, LTIP and SIP)or award of options to acquire ordinary shares (ESOS, DOP and SAYE). The ESOS is now closed to new participants, having been replaced with the BSP. TheDOP has since replaced the ESOS for use in special circumstances, relating to the recruitment or retention of key executives. No options have been grantedunder the DOP.178 <strong>Anglo</strong> <strong>American</strong> plc <strong>Annual</strong> <strong>Report</strong> <strong>2012</strong>
29. CALLED-UP SHARE CAPITAL AND SHARE-BASED PAYMENTS continuedThe total share-based payment charge relating to <strong>Anglo</strong> <strong>American</strong> plc shares for the year is split as follows:US$ million <strong>2012</strong> 2011BSP 103 92LTIP 46 36Other schemes 8 15Share-based payment charge relating to <strong>Anglo</strong> <strong>American</strong> plc shares (1) 157 143(1)In addition, there are equity settled employee share-based payment charges of $89 million (2011: $47 million) relating to Kumba Iron Ore Limited shares and $72 million (2011: $72 million)relating to <strong>Anglo</strong> <strong>American</strong> Platinum Limited shares. Certain business units also operate cash settled employee share-based payment schemes. These schemes had a net charge of $3 million(2011: credit of $2 million).Schemes settled by award of ordinary sharesThe fair value of ordinary shares awarded under the BSP, LTIP and LTIP – AOSC, being the more material share schemes, was calculated using a BlackScholes model. The fair value of shares awarded under the LTIP – TSR scheme was calculated using a Monte Carlo model. The assumptions used in thesecalculations are set out below:<strong>2012</strong> 2011Arrangement (1) BSP LTIP LTIP – AOSC LTIP – TSR BSP LTIP LTIP – AOSC LTIP – TSRDate of grant 02/03/12 02/03/12 02/03/12 02/03/12 04/03/11 04/03/11 04/03/11 04/03/11Number of instruments 4,579,741 1,044,808 329,665 329,665 3,364,610 879,630 267,407 267,407Share price at the date of grant (£) 26.41 26.41 26.41 26.41 32.08 31.99 31.99 31.99Contractual life (years) 3 3 3 3 3 3 3 3Vesting conditions(2) (3) (4) (5) (2) (3) (4) (5)Expected volatility 40% 40% 40% 40% 40% 40% 40% 40%Risk free interest rate 0.5% 0.5% 0.5% 0.5% 1.9% 1.9% 1.9% 1.9%Expected departures 5% pa 5% pa 5% pa 5% pa 5% pa 5% pa 5% pa 5% paExpected outcome of meeting performancecriteria (at date of grant) 100% 100% 100% n/a 100% 100% 100% n/aFair value at date of grant (weightedaverage) (£) 25.78 26.41 26.41 15.24 33.25 33.25 33.25 21.80(1)The number of instruments used in the fair value models may differ from the total number of instruments awarded in the year due to awards made subsequent to the fair value calculations. Thefair value calculated per the assumptions above has been applied to the total number of awards. The difference in income statement charge is not considered significant.(2)Three years of continuous employment with enhancement shares having variable vesting based on non-market based performance conditions.(3)Three years of continuous employment.(4)Variable vesting dependent on three years of continuous employment and Group AOSC target being achieved.(5)Variable vesting dependent on three years of continuous employment and market based performance conditions being achieved.The expected volatility is based on historic volatility over the last five years. The risk free interest rate is the yield on zero-coupon UK government bonds witha term similar to the expected life of the award.The charges arising in respect of the other <strong>Anglo</strong> <strong>American</strong> plc employee share schemes that the Group operated during the year are not considered material.The movements in the number of shares for the more significant share-based payment arrangements are as follows:Financial statementsBonus Share Plan (1)Ordinary shares of 54 86 /91 US cents may be awarded under the terms of this scheme for no consideration.<strong>2012</strong> 2011Outstanding at 1 January 10,106,373 9,020,260Conditionally awarded in year 4,579,239 3,366,076Vested in year (4,264,598) (1,052,193)Forfeited in year (764,181) (1,227,770)Outstanding at 31 December 9,656,833 10,106,373(1)The BSP was approved by shareholders in 2004 as a replacement for the ESOS. Further information in respect of the BSP, including performance conditions, is shown in the Remuneration report.Long Term Incentive Plan (1)(2)Ordinary shares of 54 86 /91 US cents may be awarded under the terms of this scheme for no consideration.<strong>2012</strong> 2011Outstanding at 1 January 3,720,535 4,012,568Conditionally awarded in year 1,704,138 1,414,444Vested in year (1,060,822) (730,807)Forfeited in year (378,080) (975,670)Outstanding at 31 December 3,985,771 3,720,535(1)The early vesting of share awards is permitted at the discretion of the Company upon, inter alia, termination of employment, ill health or death.(2)The LTIP awards are contingent on pre-established performance criteria being met. Further information in respect of this scheme is shown in the Remuneration report.Share Incentive PlanOrdinary shares of 54 86 /91 US cents may be awarded under the terms of this scheme for no consideration.Awards outstanding atAwards outstanding at31 December <strong>2012</strong>31 December 2011 Latest release dateShare Incentive Plan 1,115,426 1,016,074 7 December 2015<strong>Anglo</strong> <strong>American</strong> plc <strong>Annual</strong> <strong>Report</strong> <strong>2012</strong> 179
FINANCIAL STATEMENTS NOTES TO THE FINANCIAL STATEMENTS29. CALLED-UP SHARE CAPITAL AND SHARE-BASED PAYMENTS continuedSchemes settled by award of optionsThe fair value of options granted under the SAYE scheme, being the only material option scheme, was calculated using a Black Scholes model. Theassumptions used in these calculations for the current and prior years are set out in the table below:Arrangement (1) <strong>2012</strong> SAYE 2011 SAYEDate of grant 20/04/12 20/04/11Number of instruments 245,790 115,026Exercise price (£) 19.68 25.47Share price at the date of grant (£) 24.60 31.85Contractual life (years) 3.5-7.5 3.5-7.5Vesting conditions (2) 3-7 3-7Expected volatility 40% 40%Expected option life (years) 3.5-7.5 3.5-7.5Risk free interest rate (weighted average) 0.9% 2.3%Expected departures 5% pa 5% paFair value per option granted (weighted average) (£) 6.14 11.77(1)The number of instruments used in the fair value models may differ from the total number of instruments awarded in the year due to awards made subsequent to the fair value calculations. Thefair value calculated per the assumptions above has been applied to the total number of awards. The difference in income statement charge is not considered significant.(2)Number of years of continuous employment.The expected volatility is based on historic volatility over the last five years. The expected life is the average expected period to exercise. The risk free interestrate is the yield on zero-coupon UK government bonds with a term similar to the expected life of the option.A reconciliation of option movements for the more significant share-based payment arrangements over the year to 31 December <strong>2012</strong> and the prior year isshown below. All options outstanding at 31 December <strong>2012</strong> with an exercise date on or prior to 31 December <strong>2012</strong> are deemed exercisable. Options wereexercised regularly during the year and the weighted average share price for the year ended 31 December <strong>2012</strong> was £21.43 (2011: £27.96).Executive Share Option Scheme (1)Options to acquire ordinary shares of 54 86 /91 US cents were outstanding under the terms of this scheme as follows:<strong>2012</strong> 2011Weightedaverageexerciseprice £Weightedaverageexerciseprice £NumberNumberOutstanding at 1 January 2,500,107 11.42 3,488,329 11.22Exercised in year (809,259) 10.83 (949,341) 10.75Forfeited in year (56,051) 13.42 (38,881) 10.09Outstanding at 31 December 1,634,797 11.64 2,500,107 11.42(1)The early exercise of share options is permitted at the discretion of the Company upon, inter alia, termination of employment, ill health or death.SAYE Share Option Scheme (1)Options to acquire ordinary shares of 54 86 /91 US cents were outstanding under the terms of this scheme as follows:<strong>2012</strong> 2011Weightedaverageexerciseprice £Weightedaverageexerciseprice £NumberNumberOutstanding at 1 January 1,520,677 12.91 1,669,812 12.33Granted in year 245,790 24.60 115,026 25.47Exercised in year (589,299) 10.11 (125,333) 14.99Forfeited in year (128,664) 20.86 (138,828) 14.47Outstanding at 31 December 1,048,504 16.26 1,520,677 12.91(1)The early exercise of share options is permitted at the discretion of the Company upon, inter alia, termination of employment, ill health or death.30. CONSOLIDATED EQUITY ANALYSISFair value and other reserves comprise:ConvertibledebtreserveAvailablefor salereserveCashflow hedgereserveOtherreserves (1)Totalfair valueand otherreservesUS$ millionBalance at 1 January 2011 355 468 38 831 1,692Total comprehensive income/(expense) – 108 (33) – 75Other – – – (7) (7)Balance at 1 January <strong>2012</strong> 355 576 5 824 1,760Total comprehensive income – 118 10 – 128Conversion of convertible bond (355) – – – (355)Other – – – (667) (667)Balance at 31 December <strong>2012</strong> – 694 15 157 866(1)Following a capital reduction in the Corporate segment, $667 million has been transferred from the legal reserve to retained earnings, reducing the legal reserve from $675 million to $8 million.Other reserves also comprise a revaluation reserve of $34 million (2011: $34 million) and a capital redemption reserve of $115 million (2011: $115 million).180 <strong>Anglo</strong> <strong>American</strong> plc <strong>Annual</strong> <strong>Report</strong> <strong>2012</strong>
31. CONSOLIDATED CASH FLOW ANALYSISa) Reconciliation of (loss)/profit before tax to cash flows from operationsUS$ million <strong>2012</strong> 2011(Loss)/profit before tax (239) 10,782Depreciation and amortisation 2,289 1,967Share-based payment charges 233 254Non-operating special items and remeasurements (1,394) (183)Operating and financing remeasurements 205 (138)Non-cash element of operating special items 6,913 105Net finance costs before remeasurements 288 20Share of net income from associates (432) (977)Provisions (127) 6Increase in inventories (330) (352)Increase in operating receivables (31) (264)(Decrease)/increase in operating payables (166) 457Deferred stripping (148) (171)Other adjustments (40) (8)Cash flows from operations 7,021 11,498b) Reconciliation to the balance sheetCash and cash equivalentsShort term borrowingsMedium andlong term borrowingsUS$ million <strong>2012</strong> 2011 <strong>2012</strong> 2011 <strong>2012</strong> 2011Balance sheet 9,094 11,732 (2,604) (1,018) (15,150) (11,855)Balance sheet – disposal groups (1) 227 – (14) – – –Bank overdrafts (9) – 9 – – –Net debt classifications 9,312 11,732 (2,609) (1,018) (15,150) (11,855)(1)Disposal group balances are shown within ‘Assets classified as held for sale’ and ‘Liabilities directly associated with assets classified as held for sale’ on the balance sheet.c) Movement in net debtCashand cashequivalents (1)Debt duewithinone yearDebt dueafterone yearNet debtNet debthedges Hedges (2) hedgesexcludingincludingUS$ millionBalance at 1 January 2011 6,460 (1,535) (11,904) (6,979) (405) (7,384)Cash flow 5,983 1,261 (964) 6,280 (226) 6,054Unwinding of discount on convertible bond – – (71) (71) – (71)Disposal of businesses – 5 – 5 – 5Reclassifications – (777) 777 – – –Movement in fair value – – (264) (264) 404 140Other non-cash movements – (18) (38) (56) – (56)Currency movements (711) 46 609 (56) (6) (62)Balance at 1 January <strong>2012</strong> 11,732 (1,018) (11,855) (1,141) (233) (1,374)Cash flow (2,309) 747 (5,633) (7,195) (149) (7,344)Unwinding of discount on convertible bond – – (25) (25) – (25)Conversion of convertible bond – – 1,507 1,507 – 1,507Acquired through business combinations – (3) (1,578) (1,581) (15) (1,596)Disposal of businesses – 53 228 281 – 281Reclassifications – (2,396) 2,396 – – –Movement in fair value – 2 (198) (196) 229 33Other non-cash movements – (14) (21) (35) – (35)Currency movements (111) 20 29 (62) – (62)Balance at 31 December <strong>2012</strong> 9,312 (2,609) (15,150) (8,447) (168) (8,615)Financial statements(1)The Group operates in certain countries where the existence of exchange controls may restrict the use of certain cash balances (principally South Africa and Venezuela). These restrictions arenot expected to have a material effect on the Group’s ability to meet its ongoing obligations.(2)Derivative instruments that provide an economic hedge of assets and liabilities in net debt are included above to reflect the true net debt position of the Group at the year end. These consist ofnet current derivative liabilities of $116 million (2011: assets of $82 million) and net non-current derivative liabilities of $52 million (2011: $315 million) which are classified within ‘Derivativefinancial assets’ and ‘Derivative financial liabilities’ on the balance sheet.<strong>Anglo</strong> <strong>American</strong> plc <strong>Annual</strong> <strong>Report</strong> <strong>2012</strong> 181
FINANCIAL STATEMENTS NOTES TO THE FINANCIAL STATEMENTS32. ACQUISITIONSDe BeersOn 16 August <strong>2012</strong> <strong>Anglo</strong> <strong>American</strong> plc acquired an additional 40% of the share capital of De Beers Société Anonyme (De Beers) to bring its totalshareholding to 85%. De Beers is a leading diamond company with expertise in the exploration, mining and marketing of diamonds.The Group funded the acquisition by way of cash consideration of $5.2 billion, less cash acquired of $0.4 billion. The acquisition has been accounted for asa business combination using the acquisition method of accounting with an effective date of 16 August <strong>2012</strong>, being the date the Group gained control ofDe Beers.The provisional fair values of identifiable assets and liabilities of De Beers as at the date of acquisition were:US$ million <strong>2012</strong>AssetsIntangible assets 1,588Property, plant and equipment (including mineral properties and projects) 8,912Investments in associates 12Deferred tax assets 247Inventory 2,133Other assets (1) 328Total assets 13,220LiabilitiesProvisions for liabilities and charges (including contingent liabilities (2) and retirement benefit obligations) (1,487)Deferred tax liabilities (1,097)Loans and borrowings (1,581)Other liabilities (468)Total liabilities (4,633)Net assets acquired 8,587Non-controlling interests (3) (1,423)Net attributable assets acquired 7,164Goodwill 2,355Net attributable assets including goodwill 9,519ConsiderationCash 5,223Net cash acquired with the subsidiary (407)Book value of existing shareholding 2,686Fair value gain on existing 45% shareholding (4) 2,017Total consideration 9,519(1)The fair value of other assets includes receivables of $202 million.(2)Contingent liabilities of $185 million relating to legal claims in various jurisdictions.(3)Non-controlling interests have been measured at their proportionate share of De Beers’ identifiable net assets.(4)Recognised as a non-operating remeasurement, see note 5.Goodwill recognised arises principally from the significant synergies associated with the Group having control of De Beers, the value associated with theDe Beers’ workforce and the requirement to recognise a deferred tax liability calculated as the difference between the tax effect of the fair value of the assetsacquired and their tax bases. No goodwill is expected to be deductible for tax purposes. Intangible assets acquired relate to brand names, customerrelationships and contracts.From the acquisition date, De Beers has contributed $2,353 million of revenue and $159 million of underlying earnings to the Group. If the acquisition hadcompleted on 1 January <strong>2012</strong>, De Beers would have contributed revenue of $6,074 million for <strong>2012</strong> (an increase of $3,721 million) and underlying earningsof $399 million (an increase of $87 million).The Group’s attributable share of De Beers’ earnings from the acquisition date after special items and remeasurements (including special items andremeasurements charges of $319 million (after tax) relating to the reversal of fair value uplifts of inventory and depreciation and amortisation on fair valueuplifts of the Group’s pre-existing 45% shareholding) amounted to a $160 million loss. If the acquisition of De Beers had been completed on 1 January <strong>2012</strong>,the Group’s attributable share of De Beers’ earnings (including special items and remeasurements charges of $485 million (after tax) relating to the reversalof fair value uplifts of inventory and depreciation and amortisation on fair value uplifts of the Group’s pre-existing 45% shareholding) would have amounted toa $80 million loss (increasing the Group’s loss attributable to equity shareholders by $76 million to $1,569 million).OtherOn 20 July <strong>2012</strong> <strong>Anglo</strong> <strong>American</strong> plc increased its shareholding in Kumba Iron Ore Limited by 4.5% through the exercise of options acquired in 2011 and <strong>2012</strong>.This increased the Group’s shareholding from 65.2% to 69.7%, for a total cost of $948 million.The Group made no material acquisitions in 2011.182 <strong>Anglo</strong> <strong>American</strong> plc <strong>Annual</strong> <strong>Report</strong> <strong>2012</strong>
33. DISPOSALS OF SUBSIDIARIES AND JOINT VENTURESUS$ million <strong>2012</strong> 2011Net assets disposedProperty, plant and equipment 208 167Other non-current assets 65 79Current assets 347 461Current liabilities (187) (55)Non-current liabilities (273) (108)Net assets 160 544Non-controlling interests (5) (42)Net assets disposed 155 502Cumulative translation (gain)/loss recycled from reserves (6) 45Other charges 2 –Net (loss)/gain on disposals (1) (21) 337Net sales proceeds 130 884Net cash and cash equivalents disposed (38) (358)Accrued transaction costs and similar items 8 3Net cash inflow from disposals (2) 100 529(1)Included in non-operating special items, see note 5.(2)Net cash inflow in the year ended 31 December <strong>2012</strong> was nil in respect of disposals in 2011 (2011: $4 million in respect of disposals in 2010). Total net cash inflow from disposals in <strong>2012</strong> was$100 million (2011: $533 million). Of this, a net cash inflow of $100 million (2011: $514 million) related to disposals of subsidiaries and nil (2011: $19 million) related to the sale of interests injoint ventures.Disposal in <strong>2012</strong>On 24 April <strong>2012</strong> the Group announced the sale of Scaw South Africa and related companies to an investment consortium led by the Industrial DevelopmentCorporation of South Africa (IDC) and <strong>Anglo</strong> <strong>American</strong>’s partners in Scaw South Africa, being Izingwe Holdings (Pty) Limited, Shanduka Resources (Pty)Limited and the Southern Palace Group of Companies (Pty) Limited, for a total consideration of $440 million on a cash and debt free basis. Following thisannouncement, Scaw South Africa was transferred to assets held for sale.The completion of the sale took place on 23 November <strong>2012</strong> for a combined net cash inflow of $100 million.Disposals in 2011Disposals of subsidiaries during 2011 mainly related to the disposal of Lisheen and a 74% interest in Black Mountain (the Group’s remaining zinc operations)and disposals of Tarmac businesses (China, Turkey and Romania) in the Other Mining and Industrial segment.34. ASSETS AND LIABILITIES HELD FOR SALEThe following assets and liabilities were classified as held for sale at 31 December <strong>2012</strong>. The Group expects to complete the sale of these businesses within12 months of the reporting date. There were no assets or liabilities classified as held for sale at 31 December 2011.US$ millionAmapáTarmacQuarryMaterials Total (1)Intangible assets 1 418 419Property, plant and equipment 171 1,655 1,826Other non-current assets (2) 4 11 15Total non-current assets 176 2,084 2,260Inventories 103 111 214Trade and other receivables 157 292 449Cash and cash equivalents 26 201 227Total current assets 286 604 890Total assets classified as held for sale 462 2,688 3,150Trade and other payables (149) (406) (555)Short term borrowings (11) (3) (14)Provisions for liabilities and charges (3) (24) (27)Total current liabilities (163) (433) (596)Deferred tax liabilities – (150) (150)Provisions for liabilities and charges (59) (97) (156)Other non-current liabilities (2) – (17) (17)Total non-current liabilities (59) (264) (323)Total liabilities associated with assets classified as held for sale (222) (697) (919)Net assets 240 1,991 2,231<strong>2012</strong>Financial statements(1)The Group’s investments in Amapá and Tarmac Quarry Materials are included in the Other Mining and Industrial segment.(2)Other non-current assets relate to loans and receivables and investments in associates. Other non-current liabilities relate to government grants received.A loss on transfer to assets held for sale of $404 million for Amapá and $135 million for Tarmac Quarry Materials have been recognised in non-operatingspecial items, see note 5.<strong>Anglo</strong> <strong>American</strong> plc <strong>Annual</strong> <strong>Report</strong> <strong>2012</strong> 183
FINANCIAL STATEMENTS NOTES TO THE FINANCIAL STATEMENTS35. CONTINGENT LIABILITIESThe Group is subject to various claims which arise in the ordinary course of business. Additionally, and as set out in the 2007 demerger agreement,<strong>Anglo</strong> <strong>American</strong> and the Mondi Group have agreed to indemnify each other, subject to certain limitations, against certain liabilities. <strong>Anglo</strong> <strong>American</strong> has alsoprovided Mitsubishi Corporation LLC with indemnities against certain liabilities as part of the sale of a 24.5% interest in AA Sur. Having taken appropriatelegal advice, the Group believes that a material liability arising from the indemnities provided is unlikely.The Group is required to provide guarantees in several jurisdictions in respect of environmental restoration and decommissioning obligations. The Group hasprovided for the estimated cost of these activities.No contingent liabilities were secured on the assets of the Group at 31 December <strong>2012</strong> or 31 December 2011.OtherKumba Iron Ore (Kumba)Sishen Supply Agreement ArbitrationA dispute arose between Sishen Iron Ore Company Proprietary Limited (SIOC) and ArcelorMittal South Africa Limited (AMSA) in February 2010, in relationto SIOC’s contention that the contract mining agreement concluded between them in 2001 had become inoperative as a result of the fact that AMSA had failedto convert its old order mining rights. This dispute has been referred to arbitration. On 9 December 2011 SIOC and AMSA agreed to delay the arbitrationproceedings in relation to the Sishen Supply Agreement until the final resolution of the mining rights dispute. This arbitration is only expected to commence inthe fourth quarter of 2013, with possible resolution only expected in the third quarter of 2014 at the earliest.An Interim Pricing Agreement (IPA 2) between SIOC and AMSA was in place until 31 July <strong>2012</strong> and was extended to 31 December <strong>2012</strong>.In December <strong>2012</strong> a further interim agreement was concluded, after negotiations which were facilitated by the Department of Trade and Industry (DTI).The further interim agreement will govern the sale of iron ore from the Sishen mine to AMSA for the period 1 January 2013 to 31 December 2013, or untilthe conclusion of the legal processes in relation to the 2001 Sishen Supply Agreement (whichever is the sooner), at a weighted average price of $65 per tonne.Of the total 4.8 Mt, about 1.5 Mt is anticipated to be railed to Saldanha Steel and the rest to AMSA’s inland operations.21.4% undivided share of the Sishen mine mineral rightsOn 3 February <strong>2012</strong> both the Department of Mineral Resources (DMR) and Imperial Crown Trading 289 Proprietary Limited (ICT) submitted applications forleave to appeal against the High Court judgment. SIOC applied for leave to present a conditional cross-appeal, in order to protect its rights. The Supreme Courtof Appeal (SCA) hearing will be held on 19 February 2013, and the SCA judgment is expected to be received early in the second half of 2013.The High Court order did not affect the interim supply agreement between AMSA and SIOC. SIOC will continue to take the necessary steps to protect itsshareholders’ interests in this regard.<strong>Anglo</strong> <strong>American</strong> South Africa Limited (AASA)AASA, a wholly owned subsidiary of the Company, is a defendant in 24 separate lawsuits in South Africa each one on behalf of a former mineworker (or hisdependents or survivors) who allegedly contracted silicosis working for gold mining companies in which AASA was a shareholder and to which AASA providedvarious technical and administrative services. In addition, AASA is a defendant in one lawsuit filed in the High Court in London, England on behalf of 19 formermineworkers or their dependents, a second lawsuit filed there on behalf of 1,106 named former mineworkers or their dependents and also as a “representativeclaim” on behalf of all black underground miners in “<strong>Anglo</strong> gold mines” who have been certified as suffering from silicosis and related diseases, a third lawsuitfiled there on behalf of 630 named former mineworkers or their dependents and a fourth lawsuit filed there on behalf of 1,232 former mineworkers or theirdependents. AASA is also named as one of 30 defendants in a class certification application filed in South Africa purportedly on behalf of 17,000 claimants.The aggregate amount of claims in the 24 South African lawsuits is less than $5 million. No specific amount of damages has been specified in the claims filed inEngland or the class certification application filed in South Africa.If the individual claims are determined adversely to AASA there are a substantial number of additional former mineworkers (or their dependents or survivors)who may seek to bring similar claims or whose claims could become part of the representative claim filed in England or the class action claim in South Africa.The arbitration hearing for 11 of the individual South African claims is expected to begin in October 2013.AASA is contesting the jurisdiction of the English courts to hear the claims filed against it in that jurisdiction and will oppose the application for classcertification in South Africa.PlatinumAt 31 December <strong>2012</strong> Platinum has certain unresolved tax matters that are currently under dispute with the South African Revenue Service (SARS). Platinummanagement has consulted with external tax and legal advisers, who support the positions taken. Nonetheless, Platinum management are actively discussingthe issue with SARS with a view to seeking resolution and believe that the accounting for these matters is appropriate in the results for the year ended31 December <strong>2012</strong>.184 <strong>Anglo</strong> <strong>American</strong> plc <strong>Annual</strong> <strong>Report</strong> <strong>2012</strong>
36. COMMITMENTSAt 31 December the Group had the following outstanding capital commitments:US$ million <strong>2012</strong> 2011Contracted but not provided 2,792 2,131In addition, <strong>Anglo</strong> <strong>American</strong> Marketing Limited had outstanding commitments under contracts relating to shipping services of $1,033 million. In 2011 thesecommitments of $1,186 million were met by Kumba Iron Ore Limited.At 31 December the Group had the following commitments under non-cancellable operating leases:US$ million <strong>2012</strong> 2011Expiry dateWithin one year 154 161Greater than one year, less than two years 122 112Greater than two years, less than five years 200 185Greater than five years 277 347753 805Operating leases relate principally to land and buildings, vehicles and shipping vessels.37. RELATED PARTY TRANSACTIONSThe Group has a related party relationship with its subsidiaries, joint ventures and associates, see note 38.The Company and its subsidiaries, in the ordinary course of business, enter into various sales, purchase and service transactions with joint ventures andassociates and others in which the Group has a material interest. These transactions are under terms that are no less favourable to the Group than thosearranged with third parties. These transactions are not considered to be significant, other than purchases from De Beers’ joint ventures which amountedto $1,049 million in the period from 16 August <strong>2012</strong> (the date the Group obtained control of De Beers, see note 32) to 31 December <strong>2012</strong>.The Group had the following amounts receivable from joint ventures and associates:Joint venturesAssociatesUS$ million <strong>2012</strong> 2011 <strong>2012</strong> 2011Loans receivable (1) 261 263 305 572Dividends received – – 286 344(1)These loans are included in ‘Financial asset investments’.At 31 December <strong>2012</strong> the directors of the Company and their immediate relatives controlled 0.1% (2011: 0.1%) of the voting shares of the Company.Remuneration and benefits received by directors are disclosed in the Remuneration report. Remuneration and benefits of key management personnelincluding directors are disclosed in note 8.Information relating to pension fund arrangements is disclosed in note 28.Financial statementsOther related party transactions in relation to De BeersThe Group has in prior years entered into various transactions with DB Investments SA and De Beers SA (together ‘De Beers’) which were considered to berelated party transactions for the purposes of the United Kingdom Listing Authority’s Listing Rules as a result of the interest in De Beers held by CHL HoldingsLimited (CHL) and certain of its subsidiaries in which Mr N. F. Oppenheimer, a director of the Company at the time of these transactions, had a relevant interestfor the purpose of the rules.The related party transactions entered into and which continued to be relevant in the year ended 31 December <strong>2012</strong> are detailed below.On 4 November 2011 <strong>Anglo</strong> <strong>American</strong> announced it had entered into an agreement with CHL and Centhold International Limited (‘CHL Sellers’), togetherrepresenting the Oppenheimer family interests in De Beers, to acquire their 40% interest in De Beers for a total cash consideration of $5.1 billion, subject toadjustment and conditions as provided for in the agreement (the ‘Transaction’).In view of the fact that the CHL Sellers were ultimately controlled through intermediary companies by trusts (the ‘Seller Trusts’) of which Mr N. F. Oppenheimeris a potential discretionary beneficiary and Mr N. F. Oppenheimer had been a director of <strong>Anglo</strong> <strong>American</strong> within the 12 months preceding agreement of theTransaction, the Transaction was categorised as a related party transaction requiring the approval of <strong>Anglo</strong> <strong>American</strong> shareholders (other than Mr N. F.Oppenheimer and his associates). This approval was obtained at a general meeting of the Company held on 6 January <strong>2012</strong>. Further information in relation tothe Transaction was set out in the circular posted to the Company’s shareholders in December 2011.The Government of the Republic of Botswana elected not to exercise its pre-emption rights to participate in the Transaction on a proportionate basis andaccordingly <strong>Anglo</strong> <strong>American</strong>’s interest in De Beers increased to 85% on completion of the Transaction on 16 August <strong>2012</strong>, following the obtaining of certainspecified regulatory and government approvals to which the Transaction was subject. <strong>Anglo</strong> <strong>American</strong> paid a total cash consideration of $5.2 billion,comprising the adjusted purchase price under the Transaction.At 31 December <strong>2012</strong> the amount of outstanding loans owed to the Group by De Beers was $599 million (2011: $301 million), which includes loans acquiredfrom the CHL Sellers at the closing of the Transaction of $277 million.<strong>Anglo</strong> <strong>American</strong> plc <strong>Annual</strong> <strong>Report</strong> <strong>2012</strong> 185
FINANCIAL STATEMENTS NOTES TO THE FINANCIAL STATEMENTS38. GROUP COMPANIESThe principal subsidiaries, joint ventures, associates and proportionately consolidated joint arrangements of the Group and the Group percentage of equitycapital, joint arrangements and joint venture interests are set out below. All these interests are held indirectly by the parent company and are consolidatedwithin these financial statements. As permitted by section 410 of the Companies Act 2006, the Group has restricted the information provided to its principalsubsidiaries in order to avoid a statement of excessive length.Percentage of equity owned (1)Subsidiary undertakings Country of incorporation Business <strong>2012</strong> 2011Iron Ore and ManganeseKumba Iron Ore Limited (see note 32) South Africa Iron ore 69.7% 65.2%<strong>Anglo</strong> Ferrous Brazil SA Brazil Iron ore 100% 100%<strong>Anglo</strong> <strong>American</strong> Minério de Ferro Brasil SA (2) Brazil Iron ore project 100% 100%Metallurgical Coal<strong>Anglo</strong> <strong>American</strong> Metallurgical Coal Holdings Limited Australia Coal 100% 100%Peace River Coal Inc. Canada Coal 100% 100%Thermal Coal<strong>Anglo</strong> Coal (3) South Africa Coal 100% 100%Copper<strong>Anglo</strong> <strong>American</strong> Sur SA Chile Copper 50.1% 75.5%<strong>Anglo</strong> <strong>American</strong> Norte SA (4) Chile Copper 100% 100%Minera Quellaveco SA Peru Copper project 81.9% 81.9%Nickel<strong>Anglo</strong> <strong>American</strong> Brasil Limitada (Barro Alto) Brazil Nickel project 100% 100%<strong>Anglo</strong> <strong>American</strong> Brasil Limitada (Codemin) Brazil Nickel 100% 100%Minera Loma de Níquel, CA Venezuela Nickel 91.4% 91.4%Platinum<strong>Anglo</strong> <strong>American</strong> Platinum Limited South Africa Platinum 79.9% 79.8%DiamondsDe Beers Société Anonyme Luxembourg Diamonds 85% 45%Other Mining and Industrial<strong>Anglo</strong> <strong>American</strong> Fosfatos Brasil Limitada (5) Brazil Fertilisers and acid 100% 100%<strong>Anglo</strong> <strong>American</strong> Nióbio Brasil Limitada (6) Brazil Niobium 100% 100%<strong>Anglo</strong> Ferrous Amapá Mineração Limitada (7) Brazil Iron ore system 70% 70%Tarmac Group Limited UK Construction materials 100% 100%Tarmac Building Products Limited UK Construction materials 100% 100%Scaw South Africa Proprietary Limited (8) South Africa Steel, engineering worksand grinding media – 74%See page 187 for footnotes.186 <strong>Anglo</strong> <strong>American</strong> plc <strong>Annual</strong> <strong>Report</strong> <strong>2012</strong>
38. GROUP COMPANIES continuedPercentage of equity owned (9)Joint ventures Country of incorporation Business <strong>2012</strong> 2011LLX Minas-Rio Logística Comercial Exportadora SA Brazil Port 49% 49%Compañía Minera Doña Inés de Collahuasi SCM Chile Copper 44% 44%Debswana (10) Botswana Diamonds 50% –Namdeb Holdings Namibia Diamonds 50% –AI Futtain Tarmac Quarry Products Limited Dubai Construction materials 49% 49%Midland Quarry Products Limited UK Construction materials 50% 50%Tarmac Oman Limited Hong Kong Construction materials 50% 50%Midmac Tarmac Qatar LLC Qatar Construction materials 50% 50%Percentage of equity owned (9)Associates Country of incorporation Business <strong>2012</strong> 2011Samancor Holdings Proprietary Limited (11) South Africa Manganese 40% 40%Groote Eylandt Mining Company Pty Limited (GEMCO) (11) Australia Manganese 40% 40%Tasmanian Electro Metallurgical Company Pty Limited (TEMCO) (11) Australia Manganese 40% 40%Jellinbah Group Pty Limited (12) Australia Coal 33.3% 33.3%Cerrejón Zona Norte SA Colombia Coal 33.3% 33.3%Carbones del Cerrejón LLC Anguilla Coal 33.3% 33.3%Percentage ownedProportionately consolidated jointly controlled operations (13) Location Business <strong>2012</strong> 2011Drayton Australia Coal 88.2% 88.2%Moranbah North Australia Coal 88% 88%German Creek (14) Australia Coal 70% 70%Foxleigh Australia Coal 70% 70%Dawson Australia Coal 51% 51%(1)The proportion of voting rights of subsidiaries held by the Group is the same as the proportion of equity owned.(2)<strong>Anglo</strong> Ferrous Minas-Rio Mineração SA changed its name to <strong>Anglo</strong> <strong>American</strong> Minério de Ferro Brasil SA in <strong>2012</strong>.(3)A division of <strong>Anglo</strong> Operations Limited, a wholly owned subsidiary.(4)Non-controlling interest of 0.018%.(5)Copebrás Limitada changed its name to <strong>Anglo</strong> <strong>American</strong> Fosfatos Brasil Limitada in <strong>2012</strong>.(6)Mineração Catalão de Goiás Limitada changed its name to <strong>Anglo</strong> <strong>American</strong> Nióbio Brasil Limitada in <strong>2012</strong>.(7)<strong>Anglo</strong> Ferrous Amapá Mineração Limitada has been reclassified from Iron Ore and Manganese to Other Mining and Industrial to align with internal management reporting.(8)On 23 November <strong>2012</strong> the Group disposed of Scaw South Africa and related companies, see note 33.(9)All equity interests shown are ordinary shares.(10)Consolidated on a 19.2% proportionate basis, reflecting economic interest.(11)These entities have a 30 June year end.(12)The Group’s effective interest in the Jellinbah operation is 23.3%.(13)The wholly owned subsidiary <strong>Anglo</strong> <strong>American</strong> Metallurgical Coal Holdings Limited holds the proportionately consolidated jointly controlled operations.(14)The German Creek operation includes both Capcoal Open Cut and Underground operations.Financial statementsChanges in ownership interests in subsidiariesIn July <strong>2012</strong> the Group increased its shareholding in Kumba Iron Ore Limited by 4.5% through the exercise of options acquired in 2011 and <strong>2012</strong>, therebyincreasing its shareholding from 65.2% to 69.7%.In August <strong>2012</strong> the Group sold a 25.4% interest in <strong>Anglo</strong> <strong>American</strong> Sur to a Corporación Nacional del Cobre de Chile (Codelco) and Mitsui & Co., Ltd. jointventure company controlled by Codelco, for proceeds of $1.9 billion. As disclosed in note 11d, capital gains tax of $290 million relating to the profit on sale hasbeen charged directly to equity.In August <strong>2012</strong> the Group acquired an additional 40% of the share capital of De Beers Société Anonyme, see note 32.39. EVENTS OCCURRING AFTER END OF YEARPlatinumOn 15 January 2013 the Group announced the outcome of its review of the <strong>Anglo</strong> <strong>American</strong> Platinum business to create a sustainable, competitive andprofitable platinum business for the long term benefit of all stakeholders. The key proposals from the review were to place the Khuseleka and Khomananimines on care and maintenance, reconfigure the Rustenburg operations into three operating mines, close the Union Mine North declines and place otherprocessing assets on long term care and maintenance. <strong>Anglo</strong> <strong>American</strong> Platinum is engaging with the South African government, organised labour and otherstakeholders and would pursue the consultation process in terms of the requirements of South African law prior to implementing these proposals.As a result, if the Group is not expected to receive future economic benefits from these mines, property, plant and equipment, a post-tax impairment of up to$0.6 billion could be recognised as an operating special item in the income statement in 2013.The gross cash costs associated with the implementation of the Portfolio Review and overhead review, which is expected to be approximately $0.3 billion(after tax: $0.2 billion), would be expensed as incurred as an operating special item in the income statement during the course of 2013.OtherOn 7 January 2013 the Group announced the completion of the 50:50 joint venture with Lafarge, which combined their cement, aggregates, ready-mix concrete,asphalt and asphalt surfacing, maintenance services, and waste services businesses in the United Kingdom. The joint venture will be known as Lafarge Tarmac.On 4 January 2013 the Group announced the sale of its 70% interest in the Amapá iron ore system in Brazil to Zamin Ferrous Ltd. The transaction is subject tostate regulatory approval.With the exception of the above and the proposed final dividend for <strong>2012</strong>, see note 12, there have been no material reportable events since 31 December <strong>2012</strong>.<strong>Anglo</strong> <strong>American</strong> plc <strong>Annual</strong> <strong>Report</strong> <strong>2012</strong> 187
FINANCIAL STATEMENTS NOTES TO THE FINANCIAL STATEMENTS40. FINANCIAL STATEMENTS OF THE PARENT COMPANYa) Balance sheet of the Company, <strong>Anglo</strong> <strong>American</strong> plc, as at 31 December <strong>2012</strong>US$ million Note <strong>2012</strong> 2011Fixed assetsFixed asset investments 40c 12,361 13,046Current assetsAmounts due from subsidiaries 14,950 13,496Prepayments and other debtors 4 4Cash at bank and in hand 41 2314,995 13,523Creditors due within one yearAmounts owed to group undertakings (448) (395)Other creditors (4) (12)(452) (407)Net current assets 14,543 13,116Total assets less current liabilities 26,904 26,162Liabilities due after more than one yearConvertible bond 40d – (1,504)Net assets 26,904 24,658Capital and reservesCalled-up share capital 40b 772 738Share premium account 40b 4,357 2,714Capital redemption reserve 40b 115 115Other reserves 40b 1,955 1,955Share-based payment reserve 40b 1 1Convertible debt reserve 40b – 355Profit and loss account 40b 19,704 18,780Total shareholders’ funds (equity) 26,904 24,658The financial statements of <strong>Anglo</strong> <strong>American</strong> plc, registered number 03564138, were approved by the Board of directors on 14 February 2013 and signed on itsbehalf by:Cynthia CarrollChief ExecutiveRené MédoriFinance Director188 <strong>Anglo</strong> <strong>American</strong> plc <strong>Annual</strong> <strong>Report</strong> <strong>2012</strong>
40. FINANCIAL STATEMENTS OF THE PARENT COMPANY continuedb) Reconciliation of movements in equity shareholders’ fundsCalled-upshare capitalSharepremiumaccountCapitalredemptionreserveOtherreserves (1)Share-basedpaymentreserveConvertibledebt reserveProfitand lossaccount (2)US$ millionTotalBalance at 1 January 2011 738 2,713 115 1,955 6 355 12,650 18,532Profit for the financial year – – – – – – 6,520 6,520Dividends paid (3) – – – – – – (561) (561)Issue of treasury shares under employee shareschemes – – – – – – 18 18Share-based payments – – – – 1 – – 1Capital contribution to Group undertakings – – – – – – 147 147Shares issued on conversion of bond – 1 – – – – – 1Transfer between share-based payment reserveand profit and loss account – – – – (6) – 6 –Balance at 1 January <strong>2012</strong> 738 2,714 115 1,955 1 355 18,780 24,658Profit for the financial year – – – – – – 1,152 1,152Dividends paid (3) – – – – – – (599) (599)Issue of treasury shares under employee shareschemes – – – – – – 24 24Share-based payments – – – – 1 – – 1Capital contribution to Group undertakings – – – – – – 161 161Shares issued on conversion of bond 34 1,643 – – – (355) 185 1,507Transfer between share-based payment reserveand profit and loss account – – – – (1) – 1 –Balance at 31 December <strong>2012</strong> 772 4,357 115 1,955 1 – 19,704 26,904(1)At 31 December <strong>2012</strong> other reserves of $1,955 million (2011: $1,955 million) were not distributable under the Companies Act 2006.(2)At 31 December <strong>2012</strong> $2,685 million (2011: $2,685 million) of the Company profit and loss account of $19,704 million (2011: $18,780 million) was not distributable under the Companies Act 2006.(3)Dividends paid relate only to shareholders on the United Kingdom principal register excluding dividends waived by Greenwood Nominees Limited as nominees for Butterfield Trust (Guernsey)Limited, the trustee for the <strong>Anglo</strong> <strong>American</strong> employee share scheme. Dividends paid to shareholders on the Johannesburg branch register are distributed by a South African subsidiary inaccordance with the terms of the Dividend Access Share Provisions of <strong>Anglo</strong> <strong>American</strong> plc’s Articles of Association. The directors are proposing a final dividend in respect of the year ended31 December <strong>2012</strong> of 53 US cents per share, see note 12.The audit fee in respect of the parent company was $7,792 (2011: $7,156). Fees payable to Deloitte for non-audit services to the Company are not requiredto be disclosed because they are included within the consolidated disclosure in note 3.c) Fixed asset investmentsInvestment in subsidiariesUS$ million <strong>2012</strong> 2011CostAt 1 January 13,374 13,232Capital contributions (1) 147 140Additions 2,776 2Capital reduction (823) –Transfer to subsidiary (3,096) –At 31 December 12,378 13,374Provisions for impairmentAt 1 January (328) (328)Impairment charge (9) –Transfer to subsidiary 320 –At 31 December (17) (328)Net book value 12,361 13,046Financial statements(1)This amount is net of $14 million (2011: $7 million) of intra-group recharges.During <strong>2012</strong> <strong>Anglo</strong> Coal Holdings Limited undertook a capital reduction and repayment of share premium to <strong>Anglo</strong> <strong>American</strong> plc to the value of $823 million.This resulted in a $9 million impairment of the remaining investment in <strong>Anglo</strong> Coal Holdings Limited.During <strong>2012</strong> the Company transferred its holding in <strong>Anglo</strong> <strong>American</strong> Finance (UK) Limited to another subsidiary, <strong>Anglo</strong> <strong>American</strong> Services (UK) Limited,in exchange for shares in <strong>Anglo</strong> <strong>American</strong> Services (UK) Limited. This additional investment in <strong>Anglo</strong> <strong>American</strong> Services (UK) Limited was recognised atthe net carrying value of the Company’s previous investment in <strong>Anglo</strong> <strong>American</strong> Finance (UK) Limited.d) Convertible bondOn 23 March <strong>2012</strong> <strong>Anglo</strong> <strong>American</strong> plc gave notice that it had exercised its right to redeem its $1.7 billion of 4% senior convertible bonds (the Bonds)on 22 May <strong>2012</strong> (the optional redemption date). The Bonds were due to mature on 7 May 2014. On 13 April <strong>2012</strong> following the announcement of therecommended 2011 full year dividend, and in accordance with the terms and conditions of the Bonds, the conversion price was adjusted from £18.36to £18.02.Of the $1,700 million Bonds issued, $1,678 million were converted to equity prior to the optional redemption date, including $1 million converted in 2011,and the remaining $22 million were redeemed by the Group. As a result, 62.5 million ordinary shares were issued and the financial liability of $1,529 million,representing the notional value of the outstanding Bonds of $1,699 million less unamortised discount of $170 million, was derecognised. The balance in theconvertible debt reserve of $355 million, which related to the Bonds, was transferred to share premium ($170 million) and retained earnings ($185 million).<strong>Anglo</strong> <strong>American</strong> plc <strong>Annual</strong> <strong>Report</strong> <strong>2012</strong> 189
FINANCIAL STATEMENTS NOTES TO THE FINANCIAL STATEMENTS40. FINANCIAL STATEMENTS OF THE PARENT COMPANY continuede) Accounting policies: <strong>Anglo</strong> <strong>American</strong> plc, the CompanyThe <strong>Anglo</strong> <strong>American</strong> plc (the Company) balance sheet and related notes have been prepared in accordance with United Kingdom Generally AcceptedAccounting Principles (UK GAAP) and in accordance with UK company law. The financial information has been prepared on a historical cost basis as modifiedby the revaluation of certain financial instruments.A summary of the principal accounting policies is set out below.The preparation of financial statements in accordance with UK GAAP requires the use of estimates and assumptions that affect the reported amounts ofassets and liabilities at the date of the financial statements and the reported amounts of revenues and expenses during the period. Actual results may differfrom those estimated.As permitted by section 408 of the Companies Act 2006, the profit and loss account of the Company is not presented as part of these financial statements.The profit after tax for the year of the Company amounted to $1,152 million (2011: $6,520 million).Significant accounting policiesDeferred taxDeferred tax is provided in full on all timing differences that result in an obligation at the balance sheet date to pay more tax, or a right to pay less tax, at a futuredate, subject to the recoverability of deferred tax assets. Deferred tax assets and liabilities are not discounted.Share-based paymentsThe Company has applied the requirements of FRS 20 Share-based Payment. In accordance with the transitional provisions, FRS 20 has been applied to allgrants of equity instruments after 7 November 2002 that had not vested at 1 January 2005.The Company makes equity settled share-based payments to the directors, which are measured at fair value at the date of grant and expensed on a straightline basis over the vesting period, based on the Company’s estimate of shares that will eventually vest. For those share schemes with market vestingconditions, the fair value is determined using a Monte Carlo model at the grant date. The fair value of share options issued with non-market vesting conditionshas been calculated using a Black Scholes model. For all other share awards, the fair value is determined by reference to the market value of the share at thegrant date. For all share schemes with non-market vesting conditions, the likelihood of vesting has been taken into account when determining the associatedcharge. Vesting assumptions are reviewed during each reporting period to ensure they reflect current expectations.The Company also makes equity settled share-based payments to certain employees of certain subsidiary undertakings. Equity settled share-basedpayments that are made to employees of the Company’s subsidiaries are treated as increases in equity over the vesting period of the award, with acorresponding increase in the Company’s investments in subsidiaries, based on an estimate of the number of shares that will eventually vest.Any payments received from subsidiaries are applied to reduce the related increases in investments in subsidiaries.Accounting for share-based payments is the same as under IFRS 2 and details on the schemes and option pricing models relevant to the charge includedin the Company financial statements are set out in note 29 to the consolidated financial statements of the Group for the year ended 31 December <strong>2012</strong>.InvestmentsInvestments represent equity holdings in subsidiaries and are held at cost less provision for impairment.Convertible debtConvertible bonds are classified as compound instruments, consisting of a liability and an equity component. At the date of issue, the fair value of the liabilitycomponent is estimated using the prevailing market interest rate for similar non-convertible debt and is recognised within borrowings and carried at amortisedcost. The difference between the proceeds of issue of the convertible bond and the fair value assigned to the liability component, representing the embeddedoption to convert the liability into equity of the Company, is included in equity.Issue costs are apportioned between the liability and equity components of the convertible bonds where appropriate based on their relative carrying amountsat the date of issue. The portion relating to the equity component is charged directly against equity.The interest expense on the liability component is calculated by applying the effective interest rate for similar non-convertible debt to the liability componentof the instrument. The difference between this amount and the interest paid is added to the carrying amount of the liability.190 <strong>Anglo</strong> <strong>American</strong> plc <strong>Annual</strong> <strong>Report</strong> <strong>2012</strong>
ORE RESERVES AND MINERAL RESOURCESINTRODUCTIONThe Ore Reserve and Mineral Resource estimates presented in this <strong>Annual</strong><strong>Report</strong> are prepared in accordance with the <strong>Anglo</strong> <strong>American</strong> plc (AA plc)<strong>Report</strong>ing of Exploration Results, Mineral Resources and Ore Reservesstandard. This standard requires that the Australasian Code for <strong>Report</strong>ingof Exploration Results, Mineral Resources and Ore Reserves 2004 edition(the JORC Code) be used as a minimum standard. Some <strong>Anglo</strong> <strong>American</strong>plc subsidiaries have a primary listing in South Africa where publicreporting is carried out in accordance with the South African Code for<strong>Report</strong>ing of Exploration Results, Mineral Resources and Mineral Reserves(the SAMREC Code). The SAMREC Code is similar to the JORC Code andthe Ore Reserve and Mineral Resource terminology appearing in thissection follows the definitions in both the JORC (2004) and SAMREC(2007 Edition as amended July 2009) Codes.The information on Ore Reserves and Mineral Resources was preparedby or under the supervision of Competent Persons as defined in theJORC or SAMREC Codes. All Competent Persons have sufficientexperience relevant to the style of mineralisation and type of depositunder consideration and to the activity which they are undertaking. Allthe Competent Persons consent to the inclusion in this report of theinformation in the form and context in which it appears. The names of theCompetent Persons are lodged with the <strong>Anglo</strong> <strong>American</strong> plc CompanySecretary and are available on request.<strong>Anglo</strong> <strong>American</strong> Group companies are subject to a comprehensiveprogramme of reviews aimed at providing assurance in respect of OreReserve and Mineral Resource estimates. The reviews are conducted bysuitably qualified Competent Persons from within the <strong>Anglo</strong> <strong>American</strong>Group, or by independent consultants. The frequency and depth of thereviews is a function of the perceived risks and/or uncertainties associatedwith a particular Ore Reserve and Mineral Resource, the overall valuethereof and time that has lapsed since an independent third party reviewhas been conducted. Those operations/projects subject to independentthird party reviews during the year are indicated in footnotes to the tables.The JORC and SAMREC Codes require the use of reasonable economicassumptions. These include long-range commodity price forecasts whichare prepared by in-house specialists largely using estimates of futuresupply and demand and long term economic outlooks. Ore Reserves aredynamic and are more likely to be affected by fluctuations in the pricesof commodities, uncertainties in production costs, processing costs andother mining, legal, environmental, social and governmental factors whichmay impact the financial condition and prospects of the Group. MineralResource estimates also change and tend to be influenced mostly by newinformation pertaining to the understanding of the deposit and secondlyby the conversion to Ore Reserves.To accommodate the various factors that are important in the developmentof a classified Mineral Resource estimate, a scorecard approach can beused. Mineral Resource classification defines the confidence associatedwith different parts of the Mineral Resource. The confidence that isassigned refers collectively to the reliability of the Grade and Tonnageestimates. This reliability includes consideration for the fidelity of the basedata, the geological continuity predicated by the level of understanding ofthe geology, the likely precision of the estimated grades and understandingof grade variability, as well as various other factors that may influence theconfidence that can be placed on the Mineral Resource. Platinum, Nickeland Kumba Iron Ore have developed and applied their own scorecardapproaches to the classification of Mineral Resources.The estimates of Ore Reserves and Mineral Resources are stated asat 31 December <strong>2012</strong>. Unless otherwise stated, Mineral Resources areadditional to those resources which have been modified to produce theOre Reserves and are reported on a dry tonnes basis. The figures in thetables have been rounded and, if used to derive totals and averages,minor differences with stated results could occur. Ore Reserves in thecontext of this <strong>Annual</strong> <strong>Report</strong> have the same meaning as ‘Mineral Reserves’as defined by the SAMREC Code and the CIM (Canadian Institute ofMining and Metallurgy) Definition Standards on Mineral Resourcesand Mineral Reserves.It is accepted that mine design and planning may include a portion ofInferred Mineral Resources. Inferred Mineral Resources in the Life of MinePlan (LOM Plan) are described as ‘Inferred (in LOM Plan)’ separately fromthe remaining Inferred Mineral Resources described as ‘Inferred (ex. LOMPlan)’, as required. These resources are declared without application of anymodifying factors.The direct legal ownership that <strong>Anglo</strong> <strong>American</strong> holds in each operationand project is presented as the Attributable Percentage beside the nameof each entity. Operations and projects which fall below the internalthreshold for reporting (25% attributable interest) are excluded from theOre Reserves and Mineral Resources estimates. Operations and projectswhich were disposed of or for which mining concessions expired during<strong>2012</strong> and hence not reported in <strong>2012</strong> are: Loma de Níquel.In South Africa, the Minerals and Petroleum Resources Development Act,Number 28 of 2002 (MPRDA) was implemented on 1 May 2004, andeffectively transferred custodianship of the previously privately heldmineral rights to the State. Mining companies were given up to two yearsto apply for prospecting permit conversions and five years to apply formining licence conversions for existing operations.A Prospecting Right is a new order right issued in terms of the MPRDAthat is valid for up to five years, with the possibility of a further extensionof three years, that can be obtained either by the conversion of existingOld Order Prospecting Rights or through new applications. An ExplorationRight is identical to a Prospecting Right, but is commodity specific inrespect of petroleum and gas and is valid for up to three years which canbe renewed for a maximum of three periods not exceeding two years each.A Mining Right is a new order right issued in terms of the MPRDA valid forup to 30 years obtained either by the conversion of an existing Old OrderMining Right, or as a new order right pursuant to the exercise of theexclusive right of the holder of a new order Prospecting Right, or pursuantto an application for a new Mining Right. A Production Right is identical toa Mining Right, but is commodity specific in respect of petroleum and gas.In preparing the Ore Reserve and Mineral Resource statement forSouth African assets, <strong>Anglo</strong> <strong>American</strong> plc has adopted the followingreporting principles in respect of Prospecting Rights and Mining Rights:• Where applications for new order Mining Rights and Prospecting Rightshave been submitted and these are still being processed by the relevantregulatory authorities, the relevant Ore Reserves and Mineral Resourceshave been included in the statement.• Where applications for new order Prospecting Rights have beeninitially refused by the regulatory authorities, but are the subject ofongoing legal process and discussions with the relevant authoritiesand where <strong>Anglo</strong> <strong>American</strong> plc has reasonable expectations that theProspecting Rights will be granted in due course, the relevant MineralResources have been included in the statement (any associatedcomments appear in the footnotes).Ore Reserves and Mineral Resources<strong>Anglo</strong> <strong>American</strong> plc <strong>Annual</strong> <strong>Report</strong> <strong>2012</strong> 191
ORE RESERVES AND MINERAL RESOURCESESTIMATED ORE RESERVES (1) (PROVED + PROBABLE)as at 31 December <strong>2012</strong>Detailed Proved and Probable figures appear on the referenced pagesKUMBA IRON ORE(See page 196 for details)Attributable%MineLifeMiningMethodTotal SaleableTonnesGradeKolomela 51.5 24 OP 209 Mt 64.4 %FeSishen 51.5 17 OP 686 Mt 65.2 %FeThabazimbi 51.5 6 OP 7 Mt 62.9 %FeIRON ORE BRAZIL(See page 197 for details)Attributable%MineLifeMiningMethodTotal SaleableTonnes (2)GradeSerra do Sapo Friable Itabirite and Hematite 100 27 OP 685 Mt 67.5 %FeSAMANCOR MANGANESE(See page 199 for details)Attributable%MineLifeMiningMethodTotal ROMTonnesGradeGEMCO (3) 40.0 14 OP 97.4 Mt 45.0 %MnMamatwan (4) 29.6 20 OP 72.8 Mt 37.1 %MnWessels 29.6 45 UG 68.8 Mt 43.0 %MnMETALLURGICAL COAL(See page 200 for details)Attributable%MineLifeMiningMethodTotal SaleableTonnes (5)Saleable QualityCallide Thermal – Domestic 100 24 OC 239.2 Mt 4,350 kcal/kgCapcoal (OC) Metallurgical – Coking 76.8 23 OC 26.7 Mt 7.0 CSNMetallurgical – Other 68.7 Mt 6,980 kcal/kgThermal – Export 3.7 Mt 7,050 kcal/kgCapcoal (UG) Metallurgical – Coking 70.0 11 UG 39.7 Mt 9.0 CSNDawson Metallurgical – Coking 51.0 35 OC 93.8 Mt 7.5 CSNThermal – Export 221.1 Mt 5,380 kcal/kgDrayton Thermal – Export 88.2 2 OC 9.2 Mt 6,630 kcal/kgFoxleigh Metallurgical – Other 70.0 3 OC 12.1 Mt 6,810 kcal/kgMoranbah North Metallurgical – Coking 88.0 17 UG 97.2 Mt 8.0 CSNTrend Metallurgical – Coking 100 10 OC 14.0 Mt 7.0 CSNTHERMAL COAL(See page 204 for details)Thermal – Export 0.2 Mt 5,070 kcal/kgAttributable%MineLifeMiningMethodTotal SaleableTonnes (5)Saleable QualityCerrejón Thermal – Export 33.3 19 OC 743.1 Mt 6,170 kcal/kgGoedehoop Thermal – Export 100 8 UG & OC 38.3 Mt 6,200 kcal/kgGreenside Thermal – Export 100 11 UG 27.5 Mt 6,190 kcal/kgIsibonelo Synfuel 100 15 OC 70.5 Mt 4,520 kcal/kgKleinkopje Thermal – Export 100 11 OC 17.4 Mt 6,190 kcal/kgThermal – Domestic 19.6 Mt 4,580 kcal/kgKriel Thermal – Domestic 73.0 13 UG & OC 104.1 Mt 4,580 kcal/kgLandau Thermal – Export 100 6 OC 20.2 Mt 6,210 kcal/kgThermal – Domestic 5.9 Mt 4,170 kcal/kgMafube Thermal – Export 50.0 14 OC 30.0 Mt 6,260 kcal/kgThermal – Domestic 23.6 Mt 5,010 kcal/kgNew Denmark Thermal – Domestic 100 26 UG 112.0 Mt 5,000 kcal/kgNew Vaal Thermal – Domestic 100 19 OC 323.8 Mt 3,560 kcal/kgZibulo Thermal – Export 73.0 18 UG & OC 56.0 Mt 6,100 kcal/kgCOPPER(See page 208 for details)Thermal – Domestic 32.4 Mt 4,900 kcal/kgAttributable%MineLifeMiningMethodTotal ContainedCopper Tonnes GradeCollahuasi Heap Leach 44.0 70 OP 274 kt 44.1 Mt 0.62 %TCuFlotation – direct feed 20,402 kt 2,074.2 Mt 0.98 %TCuFlotation – stockpile 5,219 kt 1,069.2 Mt 0.49 %TCuEl Soldado Flotation 50.1 23 OP 1,371 kt 170.3 Mt 0.80 %TCuHeap Leach 14 kt 3.0 Mt 0.45 %TCuLos Bronces Flotation 50.1 36 OP 9,240 kt 1,509.3 Mt 0.61 %TCuDump Leach 1,891 kt 607.6 Mt 0.31 %TCuMantos Blancos Flotation 100 8 OP 286 kt 35.6 Mt 0.80 %ICuVat and Heap Leach 62 kt 15.4 Mt 0.41 %ASCuDump Leach 84 kt 36.8 Mt 0.23 %ASCuMantoverde Heap Leach 100 5 OP 229 kt 42.3 Mt 0.54 %ASCuDump Leach 112 kt 44.2 Mt 0.25 %ASCu192 <strong>Anglo</strong> <strong>American</strong> plc <strong>Annual</strong> <strong>Report</strong> <strong>2012</strong>
ORE RESERVES AND MINERAL RESOURCESNICKEL(See page 213 for details)Attributable%MineLifeMiningMethodTotal ContainedNickel Tonnes GradeBarro Alto 100 17 OP 754 kt 46.8 Mt 1.61 %NiNiquelândia 100 22 OP 66 kt 4.9 Mt 1.34 %NiPLATINUM (6)(See page 214 for details)Attributable%MineLifeMiningMethodTotal ContainedPGE Tonnes Grade (4E)Main Sulphide Zone 79.9 n/a UG 6.5 Moz (4E) 53.7 Mt 3.76 g/tMerensky Reef UG 12.5 Moz (4E) 82.3 Mt 4.71 g/tPlatreef OP 89.1 Moz (4E) 1,008.9 Mt 2.75 g/tUG2 Reef UG 69.2 Moz (4E) 518.4 Mt 4.15 g/tDIAMONDS (7)(See pages 217–221 for details)AttributableMining% LOM (8) MethodSaleable CaratsDBCi – Snap Lake 85.0 18 UG 2.0 M¢DBCi – Victor 85.0 6 OP 2.3 M¢DBCM – Venetia (OP) 62.9 9 OP 32.8 M¢DBCM – Venetia (UG) 62.9 27 UG 70.0 M¢Debswana – Damtshaa 42.5 17 OP 4.1 M¢Debswana – Jwaneng 42.5 20 OP 88.3 M¢Debswana – Letlhakane 42.5 4 OP 0.8 M¢Debswana – Orapa 42.5 21 OP 85.7 M¢Namdeb – Elizabeth Bay 42.5 7 OC 231 k¢Namdeb – Mining Area 1 42.5 7 OC 74 k¢Namdeb – Orange River 42.5 7 OC 359 k¢Namdeb – Atlantic 1 42.5 15 MM 4,935 k¢PHOSPHATE PRODUCTS(See page 222 for details)Attributable%MineLifeMiningMethodTotal ROMTonnesGradeOuvidor 100 40 OP 234.0 Mt 13.4 %P 2 O 5NIOBIUM(See page 223 for details)Attributable%MineLifeMiningMethodTotal ContainedProduct Tonnes GradeBoa Vista Oxide 100 4 OP 40 kt 3.9 Mt 1.03 %Nb 2 O 5Phosphate Tailings 14 kt 2.0 Mt 0.73 %Nb 2 O 5Mine Life = The extraction period in years for scheduled Ore Reserves comprising Proved and Probable Reserves only.LOM = Life of Mine (years) is based on scheduled Probable Reserves including Indicated and some Inferred Resources considered for life of mine planning.Mining method: OP = Open Pit, UG = Underground, OC = Open Cut, MM = Marine Mining.(1)Estimated Total Ore Reserves are the sum of Proved and Probable Ore Reserves (on an exclusive basis, i.e. Mineral Resources are reported as additional to Ore Reserves). Please refer to the detailedBusiness Units/Commodities Ore Reserve estimates tables for the individual Proved and Probable estimates. The Ore Reserve estimates were compiled in accordance with the AustralasianCode for <strong>Report</strong>ing of Exploration Results, Mineral Resources and Ore Reserves (The JORC Code, 2004) as a minimum standard. Ore Reserve estimates for operations in South Africa were compiledin accordance with The South African Code for the <strong>Report</strong>ing of Exploration Results, Mineral Resources and Mineral Reserves, (The SAMREC Code, 2007 Edition as amended July 2009).The figures reported represent 100% of the Ore Reserves, the percentage attributable to <strong>Anglo</strong> <strong>American</strong> plc is stated separately. Rounding of figures may cause computational discrepancies.(2)Tonnes are reported on a wet basis. Assays are on a dry basis.(3)GEMCO Manganese grades are given as per washed ore samples and should be read together with their respective yields.(4)Mamatwan tonnages stated as wet metric tonnes.(5)Total Saleable Tonnes represents the product tonnes produced quoted as metric tonnes on a Product moisture basis. The coal quality for Coal Reserves is quoted as either Calorific Value (CV) usingkilo-calories per kilogram (kcal/kg) units on a Gross As Received (GAR) basis or Crucible Swell Number (CSN). CV is rounded to the nearest 10 kcal/kg and CSN to the nearest 0.5 index. Coal qualityparameters for the Coal Reserves for Metallurgical – Coking, Metallurgical – Other and Thermal – Export collieries meet the contractual specifications for Coking Coal, PCI, metallurgical coal, steamcoal and domestic coal. Coal quality parameters for the Coal Reserves for Thermal – Domestic and Synfuels collieries meet the specifications of the individual supply contracts.Metallurgical – Coking: High-, medium- or low-volatile semi-soft, soft or hard coking coal primarily for blending and use in the steel industry.Metallurgical – Other: Semi-soft, soft, hard, semi-hard or anthracite coal, other than Coking Coal, such as pulverized coal injection (PCI) or other general metallurgical coal for the export or domesticmarket with a wider range of properties than Coking Coal.Thermal – Export: Low- to high-volatile thermal coal primarily for export in the use of power generation; quality measured by calorific value (CV).Thermal – Domestic: Low- to high-volatile thermal coal primarily for domestic consumption for power generation.Synfuel: Coal specifically for the domestic production of synthetic fuel and chemicals.(6)Details of the individual operations appear in the <strong>Anglo</strong> <strong>American</strong> Platinum <strong>Annual</strong> <strong>Report</strong>.The figures reported represent 100% of the Ore Reserves attributable to <strong>Anglo</strong> <strong>American</strong> Platinum unless otherwise noted.4E is the sum of Platinum, Palladium, Rhodium and Gold in grammes per tonne (g/t).(7)DBCi = De Beers Canada, DBCM = De Beers Consolidates Mines, Debswana = Debswana Diamond Company, Namdeb = Namdeb Holdingsk¢ = thousand carats. M¢ = million carats.<strong>Report</strong>ed Diamond Reserves are based on a Bottom Cut Off (BCO) which refers to the bottom screen size aperture and varies between 1.00mm and 3.00mm (nominal square mesh).(8)LOM is quoted as Diamonds are reported on an inclusive basis.Ore Reserves and Mineral Resources<strong>Anglo</strong> <strong>American</strong> plc <strong>Annual</strong> <strong>Report</strong> <strong>2012</strong> 193
ORE RESERVES AND MINERAL RESOURCESESTIMATED MINERAL RESOURCES (1) (MEASURED + INDICATED)as at 31 December <strong>2012</strong>Detailed Measured, Indicated and Inferred figures appear on the referenced pagesKUMBA IRON ORE(See page 196 for details)Attributable%MiningMethodGradeKolomela 51.5 OP 60.3 Mt 65.0 %FeSishen 51.5 OP 452.4 Mt 60.2 %FeThabazimbi 51.5 OP 10.7 Mt 62.5 %FeIRON ORE BRAZIL(See page 197 for details)Attributable%MiningMethodIn-situTonnesIn-situTonnes (2)GradeItapanhoacanga Friable Itabirite and Hematite 100 – 154.5 Mt 41.1 %FeCompact Itabirite – 96.8 Mt 34.3 %FeSerra do Sapo Friable Itabirite and Hematite 100 OP 385.4 Mt 32.9 %FeCompact Itabirite – 2,811.2 Mt 31.1 %FeSerro Friable Itabirite and Hematite 100 – 9.5 Mt 63.6 %FeOMI (Non-core)(See page 198 for details)Attributable%MiningMethodIn-situTonnes (2)GradeAmapá Canga 70.0 OP 8.0 Mt 48.7 %FeSAMANCOR MANGANESE(See page 199 for details)Colluvium OP 61.6 Mt 38.8 %FeFriable Itabirite and Hematite OP 137.7 Mt 41.1 %FeAttributable%MiningMethodGradeGEMCO (3) 40.0 OP 107.1 Mt 46.7 %MnMamatwan (4) 29.6 OP 116.7 Mt 35.0 %MnWessels 29.6 UG 137.8 Mt 43.8 %MnMETALLURGICAL COAL(See page 201 for details)Attributable%MiningMethodIn-situTonnesIn-situTonnes (5)Coal QualityCallide 100 OC 525.7 Mt 4,870 kcal/kgCapcoal (OC) 76.8 OC 41.7 Mt 7,080 kcal/kgCapcoal (UG) 70.0 UG 144.3 Mt 6,680 kcal/kgDawson 51.0 OC 311.1 Mt 6,660 kcal/kgDrayton 88.2 OC 11.8 Mt 6,550 kcal/kgFoxleigh 70.0 OC 33.3 Mt 7,110 kcal/kgMoranbah North 88.0 UG 76.9 Mt 6,640 kcal/kgTrend 100 OC 21.2 Mt 6,500 kcal/kgTHERMAL COAL(See page 206 for details)Attributable%MiningMethodIn-situTonnes (5)Coal QualityCerrejón 33.3 OC 1,063.6 Mt 6,440 kcal/kgGoedehoop 100 UG&OC 158.8 Mt 5,490 kcal/kgGreenside 100 UG 19.6 Mt 5,590 kcal/kgIsibonelo 100 OC 16.3 Mt 5,250 kcal/kgKleinkopje 100 OC 30.4 Mt 5,040 kcal/kgKriel 73.0 UG&OC 18.8 Mt 5,060 kcal/kgLandau 100 OC 94.8 Mt 4,960 kcal/kgMafube 50.0 OC 69.7 Mt 5,150 kcal/kgZibulo 73.0 UG&OC 349.0 Mt 4,920 kcal/kgCOPPER(See pages 210–211 for details)Attributable%MiningMethodContainedCopper Tonnes GradeCollahuasi Heap Leach 44.0 OP 3 kt 0.5 Mt 0.70 %TCuFlotation – direct feed 10,856 kt 1,153.6 Mt 0.94 %TCuFlotation – stockpile 1,263 kt 272.1 Mt 0.46 %TCuEl Soldado Flotation 50.1 OP 248 kt 32.4 Mt 0.77 %TCuHeap Leach 0 kt 0.0 Mt 0.66 %TCuLos Bronces Flotation 50.1 OP 3,972 kt 982.4 Mt 0.40 %TCuMantos Blancos Flotation 100 OP 734 kt 95.0 Mt 0.77 %ICuVat and Heap Leach 67 kt 14.6 Mt 0.46 %ASCuDump Leach 15 kt 8.8 Mt 0.17 %ASCuMantoverde Heap Leach 100 OP 57 kt 11.8 Mt 0.48 %ASCu194 <strong>Anglo</strong> <strong>American</strong> plc <strong>Annual</strong> <strong>Report</strong> <strong>2012</strong>
ORE RESERVES AND MINERAL RESOURCESNICKEL(See page 213 for details)Attributable%MiningMethodContainedNickel Tonnes GradeBarro Alto Direct Feed 100 OP 193 kt 14.0 Mt 1.38 %NiStockpile 85 kt 7.1 Mt 1.19 %NiNiquelândia 100 OP 70 kt 5.7 Mt 1.24 %NiPLATINUM (6)(See page 215 for details)Attributable%MiningMethodContainedPGE Tonnes Grade (4E)Main Sulphide Zone 79.9 UG 15.4 Moz (4E) 113.6 Mt 4.21 g/tMerensky Reef UG 85.7 Moz (4E) 479.9 Mt 5.55 g/tPlatreef OP 62.8 Moz (4E) 891.8 Mt 2.19 g/tUG2 Reef UG 186.8 Moz (4E) 1,131.6 Mt 5.13 g/tDIAMONDS (7)(See pages 217–221 for details)Attributable%MiningMethod Carats Tonnes/Area GradeDBCi – Snap Lake 85.0 UG 4.7 M¢ 2.5 Mt 189.27 cphtDBCi – Victor 85.0 OP 2.5 M¢ 12.9 Mt 19.34 cphtDBCM – Namaqualand 62.9 OC 2.1 M¢ 19.3 Mt 10.87 cphtDBCM – Venetia (OP) 62.9 OP 35.4 M¢ 34.2 Mt 103.46 cphtDBCM – Venetia (UG) 62.9 UG 95.5 M¢ 109.9 Mt 86.93 cphtDebswana – Damtshaa 42.5 OP 6.3 M¢ 29.3 Mt 21.46 cphtDebswana – Jwaneng 42.5 OP 84.3 M¢ 70.1 Mt 120.35 cphtDebswana – Letlhakane 42.5 OP 7.8 M¢ 27.4 Mt 28.62 cphtDebswana – Orapa 42.5 OP 119.1 M¢ 167.3 Mt 71.20 cphtNamdeb – Douglas Bay 42.5 OC 111 k¢ 1,502 kt 7.39 cphtNamdeb – Elizabeth Bay 42.5 OC 548 k¢ 4,718 kt 11.62 cphtNamdeb – Mining Area 1 42.5 OC 178 k¢ 17,597 kt 1.01 cphtNamdeb – Orange River 42.5 OC 544 k¢ 109,725 kt 0.50 cphtNamdeb – Atlantic 1 42.5 MM 10,773 k¢ 114,190 k m 2 0.09 cpm 2Namdeb – Midwater 42.5 MM 330 k¢ 1,339 k m 2 0.25 cpm 2PHOSPHATE PRODUCTS(See page 222 for details)Attributable%MiningMethod Tonnes GradeOuvidor 100 OP 64.1 Mt 11.9 %P 2 O 5NIOBIUM(See page 223 for details)Attributable%MiningMethodContainedProduct Tonnes GradeBoa Vista Oxide 100 OP 42 kt 3.4 Mt 1.22 %Nb 2 O 5Mining method: OP = Open Pit, UG = Underground, OC = Open Cut, MM = Marine Mining.(1)Estimated Measured plus Indicated Resources are the sum of the Measured and Indicated Mineral Resources (on an exclusive basis, i.e. Mineral Resources are reported as additional toOre Reserves). Please refer to the detailed Business Units/Commodities Mineral Resource estimates tables for the individual Measured, Indicated and Inferred estimates. The Mineral Resourceestimates were compiled in accordance with the Australasian Code for <strong>Report</strong>ing of Exploration Results, Mineral Resources and Ore Reserves (The JORC Code, 2004) as a minimum standard.The Mineral Resource estimates for operations in South Africa were compiled in accordance with The South African Code for the <strong>Report</strong>ing of Exploration Results, Mineral Resources and MineralReserves, (The SAMREC Code, 2007 Edition as amended July 2009).The figures reported represent 100% of the Mineral Resources, the percentage attributable to <strong>Anglo</strong> <strong>American</strong> plc is stated separately. Rounding of figures may cause computational discrepancies.(2)Tonnes are reported on a wet basis. Assays are on a dry basis.(3)GEMCO Manganese grades are given as per washed ore samples and should be read together with their respective yields.(4)Mamatwan tonnages stated as wet metric tonnes.(5)Coal Resources are quoted on a Mineable Tonnes In-Situ (MTIS) basis in million tonnes which are in addition to those resources which have been modified to produce the reported Coal Reserves. CoalResources are on an in-situ moisture basis. The coal quality for the Coal Resources is quoted on an in-situ heat content as Calorific Value (CV) using kilo-calories per kilogram (kcal/kg) units ona Gross As Received (GAR) basis. CV is rounded to the nearest 10 kcal/kg.(6)Details of the individual operations appear in the <strong>Anglo</strong> <strong>American</strong> Platinum <strong>Annual</strong> <strong>Report</strong>. Merensky Reef and UG2 Reef Mineral Resources are estimated over a practical minimum mining widthsuitable for the deposit known as the ‘Resource Cut’. The minimum mining width over which Mineral Resources are declared is 110cm. The ‘Resource Cut’ width takes cognisance of the mining methodand geotechnical aspects in the hanging wall or footwall of the reef. The figures reported represent 100% of the Ore Reserves attributable to <strong>Anglo</strong> <strong>American</strong> Platinum unless otherwise noted.4E is the sum of Platinum, Palladium, Rhodium and Gold in grammes per tonne (g/t).(7)DBCi = De Beers Canada, DBCM = De Beers Consolidates Mines, Debswana = Debswana Diamond Company, Namdeb = Namdeb Holdingsk¢ = thousand carats. M¢ = million carats. k m² = thousand square metres. Grade is quoted as carats per hundred metric tonnes (cpht) or as carats per square meter (cpm²).<strong>Report</strong>ed Diamond Resources are based on a Bottom Cut Off (BCO) which refers to the bottom screen size aperture and varies between 1.00mm and 3.00mm (nominal square mesh).Diamond Resources are quoted as inclusive of those used to calculate Diamond Reserves and must not be added to the Diamond Reserves.Ore Reserves and Mineral Resources<strong>Anglo</strong> <strong>American</strong> plc <strong>Annual</strong> <strong>Report</strong> <strong>2012</strong> 195
ORE RESERVES AND MINERAL RESOURCESIRON OREestimates as at 31 December <strong>2012</strong>KUMBA IRON OREThe Ore Reserve and Mineral Resource estimates were compiled in accordance with The South African Code for the <strong>Report</strong>ing of Exploration Results, MineralResources and Mineral Reserves (The SAMREC Code, 2007 Edition as amended July 2009). The figures reported represent 100% of the Ore Reserves andMineral Resources, the percentage attributable to <strong>Anglo</strong> <strong>American</strong> plc is stated separately. <strong>Anglo</strong> <strong>American</strong> plc’s interest in Kumba Iron Ore Limited is 69.7%.Rounding of figures may cause computational discrepancies.Kumba Iron Ore – OperationsTonnes Grade Saleable ProductMineORE RESERVESAttributable % Life Classification <strong>2012</strong> 2011 <strong>2012</strong> 2011 <strong>2012</strong> 2011Kolomela (OP) (1) 51.5 24 Mt Mt %Fe %Fe Mt %Fe Mt %FeHematite Proved 107.6 109.7 64.8 64.9 107 64.8 110 65.0Probable 102.0 93.7 64.0 64.3 102 64.0 94 64.4Total 209.5 203.4 64.4 64.6 209 64.4 203 64.7Sishen (OP) (2) 51.5 17 %Fe %FeHematite Proved 642.9 525.8 59.4 58.9 485 65.3 393 65.0Probable 276.0 458.1 58.8 59.3 201 65.0 351 65.1Total 918.9 983.9 59.2 59.1 686 65.2 744 65.0Thabazimbi (OP) (3) 51.5 6 %Fe %FeHematite Proved 0.4 2.7 61.1 61.4 0 62.9 2 63.2Probable 9.0 7.7 60.6 60.4 7 62.9 6 63.0Total 9.5 10.4 60.6 60.7 7 62.9 8 63.1Kumba Iron Ore – OperationsTonnesGradeMINERAL RESOURCES Attributable % Classification <strong>2012</strong> 2011 <strong>2012</strong> 2011Kolomela (OP) (4) 51.5 Mt Mt %Fe %FeHematite Measured 43.3 46.6 64.9 65.0Indicated 17.0 16.1 65.2 65.1Measured and Indicated 60.3 62.7 65.0 65.0Inferred (in LOM Plan) 50.5 45.9 64.2 64.3Inferred (ex. LOM Plan) 55.7 53.7 62.8 62.7Total Inferred 106.2 99.6 63.5 63.4Sishen (OP) (5) 51.5 %Fe %FeHematite Measured 315.1 111.1 61.0 61.3Indicated 137.3 274.8 58.4 61.6Measured and Indicated 452.4 385.9 60.2 61.5Inferred (in LOM Plan) 24.7 173.4 56.0 49.1Inferred (ex. LOM Plan) 67.7 217.2 55.0 53.8Total Inferred 92.5 390.6 55.3 51.7Thabazimbi (OP) (6) 51.5 %Fe %FeHematite Measured 0.2 1.1 62.5 61.1Indicated 10.4 7.2 62.5 62.0Measured and Indicated 10.7 8.3 62.5 61.9Inferred (in LOM Plan) 2.8 3.0 60.7 61.8Inferred (ex. LOM Plan) 8.2 3.9 62.8 61.8Total Inferred 11.1 6.9 62.3 61.8MINERAL RESOURCES ARE REPORTED AS ADDITIONAL TO ORE RESERVES.Kumba Iron Ore – ProjectsTonnesGradeMINERAL RESOURCES Attributable % Classification <strong>2012</strong> 2011 <strong>2012</strong> 2011Zandrivierspoort (7) 25.8 Mt Mt %Fe %FeMagnetite and Hematite Measured 132.9 128.5 35.0 34.9Indicated 177.9 182.3 34.5 34.5Measured and Indicated 310.8 310.8 34.7 34.7Inferred 64.5 64.5 34.2 34.2Mining method: OP = Open Pit. Mine Life = The extraction period in years for scheduled Ore Reserves comprising Proved and Probable Reserves only.The tonnage is quoted as dry metric tonnes and abbreviated as Mt for million tonnes.The Mineral Resources are constrained by a resource pit shell, which defines the spatial limits of eventual economic extraction.Due to the uncertainty that may be attached to some Inferred Mineral Resources, it cannot be assumed that all or part of an Inferred Mineral Resource will necessarily be upgraded to an Indicated orMeasured Resource after continued exploration.The Phoenix Project is not reported in <strong>2012</strong>; the previously declared Mineral Resource are being re-evaluated to consider different beneficiation options and will have to be re-submitted for projectapproval.(1)Kolomela – Ore Reserves: Ore Reserves are reported above a cut-off of 42.0 %Fe including dilution. The effect of production is offset by the increase resulting from a life-of-mine plan update, whichincluded a pit optimisation with updated economic assumptions.(2)Sishen – Ore Reserves: Ore Reserves are reported above a cut-off of 40.0 %Fe including dilution. The decrease is primarily due to production and a lower conversion rate of Mineral Resources toOre Reserves.(3)Thabazimbi – Ore Reserves: Ore Reserves are reported above a cut-off of 54.6 %Fe including dilution. The decrease is primarily due to production and some Ore Reserves being re-allocated toInferred Mineral Resources.(4)Kolomela – Mineral Resources: Mineral Resources are reported above a cut-off of 50.0 %Fe. The increase is due to changes in the resource shell as a result of pit a optimisation conducted based onupdated economic assumptions.(5)Sishen – Mineral Resources: Mineral Resources are reported above a cut-off of 40.0 %Fe. The overall decrease is a result of a geological model update, revised estimation methods combined withnew borehole information which resulted in a decrease of primarily BIF material.Stockpile Resource estimates (Measured: 52.2 Mt at 58.1 %Fe; Indicated: 11.9 Mt at 57.7 %Fe; Inferred: 3.2 Mt at 56.7 %Fe) are excluded from the table.(6)Thabazimbi – Mineral Resources: Mineral Resources are reported above a cut-off of 55.0 %Fe. The increase is due to changes in the resource shell as a result of updated economic assumptions.(7)Zandrivierspoort: The Zandrivierspoort Project Mineral Resources are reported above a cut-off of 23.0 %Fe. A minor update to the resource classification was undertaken in <strong>2012</strong>.Audits related to the generation of the Ore Reserve and Mineral Resource estimates were carried out by independent consultants during <strong>2012</strong> at Kolomela Mine.Assumption with respect to Mineral TenureSishen:In December 2011 judgment was delivered by the High Court regarding the status of the mining rights at the Sishen mine. The High Court held that, upon the conversion ofSIOC’s old order Mining Right relating to the Sishen mine properties in 2008, SIOC became the exclusive holder of a converted mining right for iron ore and quartzite in respectof the Sishen mine properties. The High Court held further that as a consequence, any decision taken by the Department: Mineral Resources (DMR) after such conversion in2008 to accept or grant any further rights to iron ore at the Sishen mine properties was void. Finally, the High Court reviewed and set aside the decision of the DMR to grant aprospecting right to ICT relating to iron ore as to a 21.4% share in respect of the Sishen mine properties. Both the DMR and Imperial Crown Trading have lodged an appealagainst the ruling by the High Court, which appeal is enrolled for hearing by the Supreme Court of Appeal on 19 February 2013 .196 <strong>Anglo</strong> <strong>American</strong> plc <strong>Annual</strong> <strong>Report</strong> <strong>2012</strong>
ORE RESERVES AND MINERAL RESOURCESIRON OREestimates as at 31 December <strong>2012</strong>IRON ORE BRAZILThe Ore Reserves and Mineral Resource estimates were compiled in accordance with the Australasian Code for <strong>Report</strong>ing of Exploration Results, MineralResources and Ore Reserves (The JORC Code, 2004) as a minimum standard. The figures reported represent 100% of the Ore Reserves and MineralResources, the percentage attributable to <strong>Anglo</strong> <strong>American</strong> plc is stated separately. Rounding of figures may cause computational discrepancies.The Minas-Rio project is located in the state of Minas Gerais, Brazil and will include open pit mines and a beneficiation plant producing high-grade pellet feedwhich will be transported, through a slurry pipeline, over 500km to the Port of Açu in the state of Rio de Janeiro. The project will largely be based on the twomain deposits of Serra do Sapo and Itapanhoacanga. Two ore types, Friable and Compact Itabirite, have been identified at Serra do Sapo and Itapanhoacanga.Only the friable material is being considered for Phase 1 of the project. The planned annual capacity of Phase 1 is 26.5 Mtpa of iron ore pellet feed (wet tonnes).Iron Ore Brazil – ProjectsTonnes Grade Saleable ProductMineORE RESERVESAttributable % Life Classification <strong>2012</strong> 2011 <strong>2012</strong> 2011 <strong>2012</strong> 2011Serra do Sapo (OP) (1) 100 27 Mt Mt %Fe %Fe Mt %Fe Mt %FeFriable Itabirite and Hematite Proved – – – – – – – –Probable 1,452.8 – 38.8 – 685 67.5 – –Total 1,452.8 – 38.8 – 685 67.5 – –Iron Ore Brazil – ProjectsTonnesGradeMINERAL RESOURCES Attributable % Classification <strong>2012</strong> 2011 <strong>2012</strong> 2011Itapanhoacanga (1)(2) 100 Mt Mt %Fe %FeFriable Itabirite and Hematite Measured 32.3 25.0 40.6 42.5Indicated 122.3 219.2 41.3 41.6Measured and Indicated 154.5 244.2 41.1 41.7Inferred 119.1 74.7 40.9 41.7Compact Itabirite Measured 23.2 10.9 33.6 33.2Indicated 73.6 95.8 34.5 33.8Measured and Indicated 96.8 106.7 34.3 33.7Inferred 57.2 43.9 34.5 33.2Serra do Sapo (OP) (1)(3) 100 %Fe %FeFriable Itabirite and Hematite Measured 148.7 561.3 31.6 35.3Indicated 236.7 1,278.5 33.7 38.5Measured and Indicated 385.4 1,839.8 32.9 37.5Inferred (in LOM Plan) 108.5 – 38.3 –Inferred (ex. LOM Plan) 58.7 165.1 32.9 36.3Total Inferred 167.1 165.1 36.4 36.3Compact Itabirite Measured 559.9 565.0 31.0 31.0Indicated 2,251.3 2,253.9 31.1 31.1Measured and Indicated 2,811.2 2,818.9 31.1 31.1Inferred 476.8 477.3 31.1 31.1Serro (4) 100 %Fe %FeFriable Itabirite and Hematite Measured – – – –Indicated 9.5 9.5 63.6 63.6Measured and Indicated 9.5 9.5 63.6 63.6Inferred 74.2 74.2 35.3 35.3Compact Itabirite Measured – – – –Indicated – – – –Measured and Indicated – – – –Inferred 308.2 308.2 31.6 31.6MINERAL RESOURCES ARE REPORTED AS ADDITIONAL TO ORE RESERVES.Mining method: OP = Open Pit. Mine Life = The extraction period in years for scheduled Ore Reserves comprising Proved and Probable Reserves only.Due to the uncertainty that may be attached to some Inferred Mineral Resources, it cannot be assumed that all or part of an Inferred Mineral Resource will necessarily be upgraded to an Indicated orMeasured Resource after continued exploration.(1)Minas-Rio Project: The cut-off grade used is 25% Fe. Assays are on a dry basis. Tonnages are reported on a wet basis with an average moisture content of 4.2 wt% for Friable ore. Friable Itabirite andHematite includes Friable Itabirite, Semi-Compact Itabirite, High Alumina Friable Itabirite, Soft Hematite and Canga.The Minas-Rio Project comprises the following sub-areas: Itapanhoacanga and Serra do Sapo. Execution of this project remains subject to the normal regulatory processes of the Brazilian authorities.(2)Itapanhoacanga: Friable Itabirite and Hematite includes Friable Itabirite, Semi-Compact Itabirite, Soft Hematite and Hard Hematite. The decrease is as a result of the exclusion of the Quartz-X mineralarea (Licence No. 832.666\2001) which is partially off-set by an increase due to new information obtained during the year.(3)Serra do Sapo: Friable Itabirite and Hematite includes Friable Itabirite, Semi-Compact Itabirite, High Alumina Friable Itabirite, Soft Hematite and Canga. The Mineral Resources decrease is primarilydue to conversion of Mineral Resources to Ore Reserves.(4)Serro: The cut-off grade used is 25% Fe. Friable Itabirite and Hematite includes Friable Itabirite, Semi-Compact Itabirite and Hard Hematite (9.5 Mt @ 63.6% Fe). Tonnages are reported on a wet basiswith an average moisture content of 4.7 wt%.Audits related to the generation of the Ore Reserve and Mineral Resource estimates were carried out by independent consultants during <strong>2012</strong> at Serra do Sapo.Ore Reserves and Mineral Resources<strong>Anglo</strong> <strong>American</strong> plc <strong>Annual</strong> <strong>Report</strong> <strong>2012</strong> 197
ORE RESERVES AND MINERAL RESOURCESIRON OREestimates as at 31 December <strong>2012</strong>OTHER MINING AND INDUSTRIALThe Mineral Resource estimates were compiled in accordance with the Australasian Code for <strong>Report</strong>ing of Exploration Results, Mineral Resources and OreReserves (The JORC Code, 2004) as a minimum standard. The figures reported represent 100% of the Mineral Resources, the percentage attributable to<strong>Anglo</strong> <strong>American</strong> plc is stated separately. Rounding of figures may cause computational discrepancies.OMI (Non-core) – Operations Tonnes GradeMINERAL RESOURCES Attributable % Classification <strong>2012</strong> 2011 <strong>2012</strong> 2011Amapá (OP) (1)(2) 70.0 Mt Mt %Fe %FeCanga Measured – 2.6 – 54.2Indicated 8.0 10.5 48.7 48.5Measured and Indicated 8.0 13.1 48.7 49.6Inferred 6.3 1.3 46.1 41.5Colluvium Measured 10.0 12.0 39.2 40.4Indicated 51.6 56.0 38.7 38.3Measured and Indicated 61.6 68.0 38.8 38.7Inferred 14.2 18.6 35.1 34.7Friable Itabirite and Hematite Measured 34.0 33.5 39.8 40.5Indicated 103.8 112.0 41.5 41.7Measured and Indicated 137.7 145.5 41.1 41.4Inferred 16.1 26.0 43.7 40.1Mining method: OP = Open Pit.Due to the uncertainty that may be attached to some Inferred Mineral Resources, it cannot be assumed that all or part of an Inferred Mineral Resource will necessarily be upgraded to an Indicated orMeasured Resource after continued exploration.(1)Amapá – Mineral Resources: The cut-off grade used is 25% Fe. Assays are on a dry basis. Tonnages are reported on a wet basis with an average moisture content of 11 wt% for Canga, 10 wt% forColluvium and 9 wt% for Friable Itabirite and Hematite ore. The decrease is as a result of depletion and new information along with a revised geological modelling methodology.(2)Amapá: Friable Itabirite and Hematite includes Friable Itabirite, Altered Friable Itabirite and Friable Hematite. The Mineral Resources comprise the Mário Cruz, Mário Cruz Leste, Martelo, Taboca,Taboca Leste, Vila do Meio, Vila do Meio Leste and Dragão areas.198 <strong>Anglo</strong> <strong>American</strong> plc <strong>Annual</strong> <strong>Report</strong> <strong>2012</strong>
ORE RESERVES AND MINERAL RESOURCESMANGANESEestimates as at 31 December <strong>2012</strong>SAMANCOR MANGANESEThe Ore Reserve and Mineral Resource estimates were compiled in accordance with the Australasian Code for <strong>Report</strong>ing of Exploration Results, MineralResources and Ore Reserves (The JORC Code, 2004) and The South African Code for the <strong>Report</strong>ing of Exploration Results, Mineral Resources and MineralReserves (The SAMREC Code, 2007 Edition as amended July 2009) as applicable. The figures reported represent 100% of the Ore Reserves and MineralResources (source: BHP Billiton), the percentage attributable to <strong>Anglo</strong> <strong>American</strong> plc is stated separately. Rounding of figures may cause computationaldiscrepancies.Samancor Manganese – OperationsMineTonnes Grade YieldORE RESERVES Attributable % Life Classification <strong>2012</strong> 2011 <strong>2012</strong> 2011 <strong>2012</strong> 2011GEMCO (OP) (1) 40.0 14 Mt Mt %Mn %Mn % %Proved 72.5 79.4 45.0 46.5 55.1 54.8Probable 24.9 25.9 45.0 45.6 55.1 54.2Total 97.4 105.3 45.0 46.3 55.1 54.7Hotazel Manganese Mines 29.6 %Mn %MnMamatwan (OP) (2) 20 Proved 41.4 43.9 37.2 37.3Probable 31.4 30.5 37.1 37.1Total 72.8 74.4 37.1 37.2Wessels (UG) (3) 45 Proved 3.9 4.1 44.8 44.0Probable 64.9 67.7 42.9 43.0Total 68.8 71.8 43.0 43.1Samancor Manganese – Operations Tonnes Grade YieldMINERAL RESOURCES Attributable % Classification <strong>2012</strong> 2011 <strong>2012</strong> 2011 <strong>2012</strong> 2011GEMCO (OP) (4) 40.0 Mt Mt %Mn %Mn % %Measured 78.9 87.0 46.9 47.1 47.5 47.4Indicated 28.2 28.7 46.0 46.0 47.4 47.6Measured and Indicated 107.1 115.8 46.7 46.8 47.5 47.4Inferred 49.4 49.4 43.9 43.9 47.8 47.8Hotazel Manganese Mines 29.6 %Mn %MnMamatwan (OP) (5) Measured 62.0 64.8 35.5 35.7Indicated 54.7 54.7 34.5 34.5Measured and Indicated 116.7 119.5 35.0 35.2Inferred 4.3 4.2 34.5 34.4Wessels (UG) (6) Measured 11.4 13.8 45.7 46.0Indicated 126.4 129.5 43.6 44.2Measured and Indicated 137.8 143.3 43.8 44.4Inferred – – – –MINERAL RESOURCES INCLUDE ORE RESERVESSamancor Gabon – Projects Tonnes Grade YieldMINERAL RESOURCES Attributable % Classification <strong>2012</strong> 2011 <strong>2012</strong> 2011 <strong>2012</strong> 2011Franceville Project – Beniomi (7) 40.0 Mt Mt %Mn %Mn % %Plaquette Ore Measured 11.0 11.0 36.1 36.1 72.0 72.0Indicated 6.6 6.6 36.1 36.1 74.4 74.4Measured and Indicated 17.5 17.5 36.1 36.1 72.9 72.9Inferred 2.9 2.9 36.1 36.1 71.8 71.8Transition Ore Measured 4.1 4.1 24.3 24.3 73.1 73.1Indicated 2.4 2.4 24.5 24.5 75.1 75.1Measured and Indicated 6.5 6.5 24.4 24.4 73.8 73.8Inferred 5.0 5.0 24.2 24.2 68.4 68.4Franceville Project – Bordeaux (7) 40.0 %Mn %MnPlaquette Ore Measured 4.6 4.6 36.4 36.4 72.0 72.0Indicated 0.8 0.8 36.1 36.1 67.8 67.8Measured and Indicated 5.4 5.4 36.4 36.4 71.4 71.4Inferred 0.8 0.8 36.8 36.8 69.5 69.5Transition Ore Measured 2.3 2.3 24.7 24.7 74.0 74.0Indicated 0.5 0.5 24.1 24.1 70.3 70.3Measured and Indicated 2.8 2.8 24.6 24.6 73.3 73.3Inferred 1.8 1.8 25.1 25.1 67.1 67.1Mining method: OP = Open Pit, UG = Underground. Mine Life = The extraction period in years for scheduled Ore Reserves comprising Proved and Probable Reserves only.Mamatwan tonnages stated as wet metric tonnes. Wessels and GEMCO tonnages stated as dry metric tonnes.Due to the uncertainty that may be attached to some Inferred Mineral Resources, it cannot be assumed that all or part of an Inferred Mineral Resource will necessarily be upgraded to an Indicated orMeasured Resource after continued exploration.(1)GEMCO – Ore Reserves: Manganese grades are given as per washed ore samples and should be read together with their respective yields. The change is due to depletion from mining.(2)Mamatwan – Ore Reserves: The change is due to depletion from mining.(3)Wessels – Ore Reserves: The decrease is mainly due to the re-delineation of the suboutcrop positions of the orebodies, based on new borehole information(4)GEMCO – Mineral Resources: The change is due to depletion from mining.(5)Mamatwan – Mineral Resources: A cut-off grade of 35% Mn is used to declare Mineral Resources within the M, C and N Zones at Mamatwan. Mineral Resources have also been declared from theX Zone, using a cut-off of 35% Mn, however, the Top Cut Resources comprising a total of 43.1 Mt are declared above a cut-off of 28% Mn. The change is due to depletion from mining and re-runningthe geological model.(6)Wessels – Mineral Resources: The decrease is mainly due to the re-delineation of the suboutcrop positions of the orebodies, based on new borehole information.(7)Beniomi and Bordeaux: Mn grades are for +0.15mm screen size fraction and should be read together with their respective tonnage yields. The Gabon Mining Concession and Mining Conventionremain subject to ongoing negotiation. No Ore Reserves are yet reportable.Ore Reserves and Mineral Resources<strong>Anglo</strong> <strong>American</strong> plc <strong>Annual</strong> <strong>Report</strong> <strong>2012</strong> 199
ORE RESERVES AND MINERAL RESOURCESCOALestimates as at 31 December <strong>2012</strong>METALLURGICAL COALThe Coal Reserve and Coal Resource estimates were compiled in accordance with the Australasian Code for <strong>Report</strong>ing of Exploration Results,Mineral Resources and Ore Reserves (The JORC Code, 2004) as a minimum standard. The figures reported represent 100% of the Coal Reserves andCoal Resources, the percentage attributable to <strong>Anglo</strong> <strong>American</strong> plc is stated separately. Rounding of figures may cause computational discrepancies.<strong>Anglo</strong> <strong>American</strong> Metallurgical Coal comprises export metallurgical and thermal coal operations located in Australia and Canada.Metallurgical Coal – Australia OperationsROM Tonnes (3) Yield (4) Saleable Tonnes (3) Saleable QualityMineCOAL RESERVES (1) (2)Attributable % Life Classification <strong>2012</strong> 2011 <strong>2012</strong> 2011 <strong>2012</strong> 2011 <strong>2012</strong> 2011Callide (OC) 100 24 Mt Mt ROM % ROM % Mt Mt kcal/kg kcal/kgThermal – Domestic Proved 192.2 199.9 97.9 98.0 188.2 195.8 4,380 4,380Probable 52.0 52.0 98.0 98.0 51.0 51.0 4,250 4,250Total 244.2 251.9 97.9 98.0 239.2 246.8 4,350 4,350Capcoal (OC) 76.8 23 CSN CSNMetallurgical – Coking Proved 69.9 77.1 19.8 20.4 14.4 16.3 7.0 7.0Probable 72.5 72.5 16.4 16.4 12.3 12.3 6.5 6.5Total 142.4 149.5 18.0 18.5 26.7 28.6 7.0 7.0kcal/kg kcal/kgMetallurgical – Other Proved 46.3 46.3 33.6 37.0 6,970 6,970Probable 46.5 46.5 35.0 35.0 6,990 6,990Total 46.4 46.4 68.7 72.1 6,980 6,980kcal/kg kcal/kgThermal – Export Proved 2.7 2.8 2.0 2.3 7,070 7,060Probable 2.3 2.3 1.7 1.7 7,030 7,030Total 2.5 2.6 3.7 4.0 7,050 7,050Capcoal (UG) 70.0 11 CSN CSNMetallurgical – Coking Proved 36.0 40.6 75.1 73.7 28.5 31.6 9.0 9.0Probable 14.7 14.7 72.0 72.0 11.2 11.2 9.0 9.0Total 50.7 55.3 74.2 73.2 39.7 42.7 9.0 9.0Dawson (OC) 51.0 35 CSN CSNMetallurgical – Coking Proved 180.7 15.0 24.0 19.9 44.7 3.1 7.5 7.5Probable 227.2 149.0 21.0 16.0 49.1 24.5 7.5 7.5Total 407.9 163.9 22.4 16.4 93.8 27.5 7.5 7.5kcal/kg kcal/kgThermal – Export Proved 51.6 65.2 95.8 10.0 5,440 6,500Probable 53.6 59.4 125.3 90.9 5,340 6,500Total 52.7 59.9 221.1 101.0 5,380 6,500Drayton (OC) 88.2 2 kcal/kg kcal/kgThermal – Export Proved 7.9 3.2 76.0 75.3 6.0 2.4 6,650 6,260Probable 4.2 19.7 76.0 75.6 3.2 14.9 6,600 6,260Total 12.0 22.9 76.0 75.6 9.2 17.3 6,630 6,260Foxleigh (OC) 70.0 3 kcal/kg kcal/kgMetallurgical – Other Proved 1.9 4.1 83.0 79.3 1.7 3.5 6,870 6,940Probable 12.6 13.7 77.7 77.2 10.4 11.3 6,800 6,810Total 14.5 17.8 78.4 77.7 12.1 14.8 6,810 6,840Moranbah North (UG) 88.0 17 CSN CSNMetallurgical – Coking Proved 109.5 114.8 76.6 76.4 88.5 92.6 8.0 8.0Probable 11.3 11.3 72.7 72.7 8.7 8.7 8.0 8.0Total 120.8 126.1 76.2 76.1 97.2 101.3 8.0 8.0Australia Metallurgical – Coking 70.6 Mt Mt Plant % Plant % Mt Mt CSN CSNProved 598.0 454.6 58.4 68.2 176.0 143.5 8.0 8.0Probable 394.4 332.8 32.9 35.8 81.3 56.6 7.5 7.5Total 992.5 787.4 50.3 59.0 257.3 200.1 8.0 8.0Australia Metallurgical – Other 75.8 kcal/kg kcal/kgProved 48.1 49.1 35.3 40.5 6,970 6,970Probable 53.7 54.0 45.5 46.3 6,940 6,940Total 51.2 51.7 80.8 86.8 6,950 6,960Australia Thermal – Export 52.9 kcal/kg kcal/kgProved 52.0 57.3 103.8 14.7 5,540 6,550Probable 53.5 60.7 130.2 107.5 5,390 6,480Total 52.9 60.3 233.9 122.2 5,460 6,480Australia Thermal – Domestic 100 kcal/kg kcal/kgProved 97.9 98.0 188.2 195.8 4,380 4,380Probable 98.0 98.0 51.0 51.0 4,250 4,250Total 97.9 98.0 239.2 246.8 4,350 4,350Metallurgical Coal – Canada OperationsROM Tonnes (3) Yield (4) Saleable Tonnes (3) Saleable QualityMineCOAL RESERVES (1) (2)Attributable % Life Classification <strong>2012</strong> 2011 <strong>2012</strong> 2011 <strong>2012</strong> 2011 <strong>2012</strong> 2011Trend (OC) 100 10 Mt Mt ROM % ROM % Mt Mt CSN CSNMetallurgical – Coking Proved 17.9 20.3 66.3 65.0 12.4 13.9 7.0 7.0Probable 2.3 2.3 61.7 61.7 1.5 1.5 7.0 7.0Total 20.2 22.6 65.8 64.7 14.0 15.4 7.0 7.0kcal/kg kcal/kgThermal – Export Proved 0.7 0.7 0.1 0.1 5,070 5,070Probable 0.8 1.1 0.0 0.0 5,070 5,070Total 0.7 0.7 0.2 0.2 5,070 5,070Mining method: OC = Open Cut, UG = Underground. Mine Life = The extraction period in years for scheduled Ore Reserves comprising Proved and Probable Reserves only.For the multi-product operations, the ROM tonnes apply to each product.The Saleable tonnes cannot be calculated directly from the ROM reserve tonnes using the air dried yields as presented since the difference in moisture content is not taken into account.Attributable percentages for country totals are weighted by Saleable tonnes and should not be directly applied to the ROM tonnes.Footnotes appear at the end of the section.Metallurgical – Coking refers to a high-, medium- or low-volatile semi-soft, soft or hard coking coal primarily for blending and use in the steel industry; quality measured as Crucible Swell Number (CSN).Metallurgical – Other refers to semi-soft, soft, hard, semi-hard or anthracite coal, other than Coking Coal, such as pulverized coal injection (PCI) or other general metallurgical coal for the export ordomestic market with a wider range of properties than Coking Coal; quality measured by calorific value (CV).Thermal – Export refers to low- to high-volatile thermal coal primarily for export in the use of power generation; quality measured by calorific value (CV).Thermal – Domestic refers to low- to high-volatile thermal coal primarily for domestic consumption for power generation; quality measured by calorific value (CV).200 <strong>Anglo</strong> <strong>American</strong> plc <strong>Annual</strong> <strong>Report</strong> <strong>2012</strong>(5)(5)
ORE RESERVES AND MINERAL RESOURCESCOALestimates as at 31 December <strong>2012</strong>Metallurgical Coal – Operations ROM Tonnes (3) Yield (4) Saleable Tonnes (3) Saleable QualityTOTAL COAL RESERVES (1) (2)Attributable % Classification <strong>2012</strong> 2011 <strong>2012</strong> 2011 <strong>2012</strong> 2011 <strong>2012</strong> 2011Metallurgical – Coking 72.1 Mt Mt Plant % Plant % Mt Mt CSN CSNProved 615.9 474.9 58.9 68.0 188.5 157.4 8.0 8.0Probable 396.8 335.1 33.4 36.5 82.8 58.1 7.5 7.5Total 1,012.7 810.0 51.1 59.5 271.3 215.5 8.0 8.0Metallurgical – Other 75.8 kcal/kg kcal/kgProved 48.1 49.1 35.3 40.5 6,970 6,970Probable 53.7 54.0 45.5 46.3 6,940 6,950Total 51.2 51.7 80.8 86.8 6,950 6,960Thermal – Export 52.9 kcal/kg kcal/kgProved 52.0 56.7 103.9 14.8 5,540 6,530Probable 53.5 60.7 130.2 107.6 5,390 6,470Total 52.8 60.2 234.1 122.4 5,460 6,480Thermal – Domestic 100 kcal/kg kcal/kgProved 97.9 98.0 188.2 195.8 4,380 4,380Probable 98.0 98.0 51.0 51.0 4,250 4,250Total 97.9 98.0 239.2 246.8 4,350 4,350(5)Metallurgical Coal – Australia Operations Tonnes Coal QualityCOAL RESOURCES (6) (2)Attributable % Classification <strong>2012</strong> 2011 <strong>2012</strong> 2011Callide (OC) 100 MTIS MTIS kcal/kg kcal/kgMeasured 260.7 260.7 4,940 4,940Indicated 265.1 265.1 4,810 4,810Measured and Indicated 525.7 525.7 4,870 4,870(8)Inferred (in LOM Plan) 15.3 15.3 4,240 4,240Capcoal (OC) 76.8 Measured 13.8 13.8 7,080 7,080Indicated 27.9 27.9 7,080 7,080Measured and Indicated 41.7 41.7 7,080 7,080(8)Inferred (in LOM Plan) 36.6 36.6 6,710 6,710Capcoal (UG) 70.0 Measured 76.3 76.3 6,730 6,730Indicated 68.0 68.0 6,620 6,620Measured and Indicated 144.3 144.3 6,680 6,680(8)Inferred (in LOM Plan) 0.3 0.3 6,630 6,630Dawson (OC) 51.0 Measured 134.2 163.1 6,630 6,670Indicated 177.0 278.6 6,680 6,660Measured and Indicated 311.1 441.7 6,660 6,660(8)Inferred (in LOM Plan) 97.1 103.5 6,750 6,870Drayton (OC) 88.2 Measured 3.7 2.4 6,490 6,870Indicated 8.0 12.3 6,580 6,850Measured and Indicated 11.8 14.7 6,550 6,850(8)Inferred (in LOM Plan) 0.0 0.4 5,820 6,050Foxleigh (OC) 70.0 Measured 17.3 17.3 7,130 7,130Indicated 16.1 16.1 7,090 7,090Measured and Indicated 33.3 33.3 7,110 7,110(8)Inferred (in LOM Plan) 7.0 7.0 6,830 6,830Moranbah North (UG) 88.0 Measured 55.7 55.7 6,670 6,670Indicated 21.3 21.3 6,570 6,570Measured and Indicated 76.9 76.9 6,640 6,640(8)Inferred (in LOM Plan) 0.1 0.1 6,980 6,980Australia – Mine Leases 80.3 Measured 561.6 589.2 5,890 5,940Indicated 583.3 689.2 5,850 5,970Measured and Indicated 1,144.9 1,278.4 5,870 5,960(8)Inferred (in LOM Plan) 156.4 163.3 6,500 6,580COAL RESOURCES ARE REPORTED AS ADDITIONAL TO COAL RESERVES.(6) (6) (7) (7)Metallurgical Coal – Canada Operations Tonnes Coal QualityCOAL RESOURCES (6) (2)Attributable % Classification <strong>2012</strong> 2011 <strong>2012</strong> 2011Trend (OC) 100 MTIS MTIS kcal/kg kcal/kgMeasured 15.9 15.9 6,500 6,500Indicated 5.3 5.3 6,500 6,500Measured and Indicated 21.2 21.2 6,500 6,500(8)Inferred (in LOM Plan) 1.4 1.4 6,500 6,500COAL RESOURCES ARE REPORTED AS ADDITIONAL TO COAL RESERVES.(6) (6) (7) (7)Ore Reserves and Mineral ResourcesMetallurgical Coal – Operations Tonnes Coal QualityCOAL RESOURCES (6) (2)Attributable % Classification <strong>2012</strong> 2011 <strong>2012</strong> 2011TOTAL 80.6 MTIS MTIS kcal/kg kcal/kgMeasured 577.5 605.1 5,910 5,950Indicated 588.6 694.5 5,850 5,980Measured and Indicated 1,166.1 1,299.6 5,880 5,960(8)Inferred (in LOM Plan) 157.8 164.7 6,500 6,580COAL RESOURCES ARE REPORTED AS ADDITIONAL TO COAL RESERVES.Footnotes appear at the end of the section.(6) (6) (7) (7)<strong>Anglo</strong> <strong>American</strong> plc <strong>Annual</strong> <strong>Report</strong> <strong>2012</strong> 201
ORE RESERVES AND MINERAL RESOURCESCOALestimates as at 31 December <strong>2012</strong>Metallurgical Coal – Australia ProjectsROM Tonnes Yield Saleable Tonnes Saleable QualityMineCOAL RESERVES (1) (2)Attributable % Life Classification <strong>2012</strong> 2011 <strong>2012</strong> 2011 <strong>2012</strong> 2011 <strong>2012</strong> 2011Grosvenor 100 21 Mt Mt ROM % ROM % Mt Mt CSN CSNMetallurgical – Coking Proved 76.1 76.1 66.2 66.2 53.2 53.2 8.5 8.5Probable 62.6 62.6 65.2 65.2 43.1 43.1 8.0 8.0Total 138.7 138.7 65.7 65.7 96.3 96.3 8.5 8.5(3) (4) (3) (5)Metallurgical Coal – Australia Projects Tonnes Coal QualityCOAL RESOURCES (6)(8) (2)Attributable % Classification <strong>2012</strong> 2011 <strong>2012</strong> 2011Dartbrook 83.3 MTIS MTIS kcal/kg kcal/kgMeasured 386.1 386.1 5,720 5,720Indicated 24.8 24.8 5,460 5,460Measured and Indicated 410.9 410.9 5,700 5,700Drayton South 88.2 Measured 492.1 405.7 6,240 6,580Indicated 189.0 173.4 6,260 6,540Measured and Indicated 681.1 579.2 6,250 6,570Grosvenor 100 Measured 145.1 145.1 6,420 6,420Indicated 72.5 72.5 6,550 6,550Measured and Indicated 217.6 217.6 6,460 6,460(8)Inferred (in LOM Plan) 9.5 9.5 6,330 6,330Moranbah South 50.0 Measured 349.6 191.5 6,180 6,050Indicated 302.3 307.1 6,410 6,350Measured and Indicated 651.8 498.6 6,290 6,230Theodore 51.0 Measured – – – –Indicated 258.5 258.5 6,260 6,260Measured and Indicated 258.5 258.5 6,260 6,260Australia – Projects 72.9 Measured 1,372.9 1,128.4 6,100 6,180Indicated 847.0 836.3 6,310 6,350Measured and Indicated 2,219.9 1,964.7 6,180 6,250(8)Inferred (in LOM Plan) 9.5 9.5 6,330 6,330COAL RESOURCES ARE REPORTED AS ADDITIONAL TO COAL RESERVES.(6) (6) (7) (7)Metallurgical Coal – Canada Projects Tonnes Coal QualityCOAL RESOURCES (6)(8) (2)Attributable % Classification <strong>2012</strong> 2011 <strong>2012</strong> 2011Belcourt Saxon 50.0 MTIS MTIS kcal/kg kcal/kgMeasured 166.7 166.7 6,500 6,500Indicated 4.3 4.3 6,500 6,500Measured and Indicated 171.0 171.0 6,500 6,500Roman Mountain 100 Measured 30.6 20.0 6,290 6,640Indicated 6.4 6.8 6,300 6,660Measured and Indicated 37.0 26.7 6,290 6,650Canada – Projects 58.9 Measured 197.3 186.7 6,470 6,510Indicated 10.7 11.0 6,380 6,600Measured and Indicated 208.0 197.7 6,460 6,520Footnotes appear at the end of the section.(6) (6) (7) (7)202 <strong>Anglo</strong> <strong>American</strong> plc <strong>Annual</strong> <strong>Report</strong> <strong>2012</strong>
ORE RESERVES AND MINERAL RESOURCESCOALestimates as at 31 December <strong>2012</strong>(1)Coal Reserves are quoted on a Run Of Mine (ROM) reserve tonnes basis, which represents the tonnes delivered to the plant. Saleable reserve tonnes represents the product tonnes produced.Coal Reserves (ROM and Saleable) are on the applicable moisture basis.(2)Attributable (%) refers to <strong>2012</strong> only. For the 2011 <strong>Report</strong>ed and Attributable figures, please refer to the 2011 <strong>Annual</strong> <strong>Report</strong>.(3)ROM tonnes quoted on an As Delivered moisture basis, and Saleable tonnes on a Product moisture basis.(4)Yield – ROM % represents the ratio of Saleable reserve tonnes to ROM reserve tonnes and is quoted on a constant moisture basis or on an air dried to air dried basis whereas Plant % is based on the‘Feed to Plant’ tonnes. The product yields (ROM %) for Proved, Probable and Total are calculated by dividing the individual Saleable reserves by the total ROM reserves per classification.(5)The coal quality for the Coal Reserves is quoted as either Calorific Value (CV) using kilo-calories per kilogram (kcal/kg) units on a Gross As Received (GAR) basis or Crucible Swell Number (CSN).Coal quality parameters for the Coal Reserves for Coking, Other Metallurgical and Export Thermal collieries meet the contractual specifications for coking coal, PCI, metallurgical coal, steam coal anddomestic coal. Coal quality parameters for the Coal Reserves for Domestic Power and Domestic Synfuels collieries meet the specifications of the individual supply contracts.CV is rounded to the nearest 10 kcal/kg and CSN to the nearest 0.5 index.(6)Coal Resources are quoted on a Mineable Tonnes In-Situ (MTIS) basis in million tonnes, which are in addition to those resources that have been modified to produce the reported Coal Reserves.Coal Resources are on an in-situ moisture basis.(7)The coal quality for the Coal Resources is quoted on an in-situ heat content as Calorific Value (CV) using kilo-calories per kilogram (kcal/kg) units on a Gross As Received (GAR) basis.CV is rounded to the nearest 10 kcal/kg.(8)Inferred (in LOM Plan) refers to Inferred Coal Resources that are included in the life of mine extraction schedule of the respective collieries and are not reported as Coal Reserves. Inferred CoalResources outside the Life of Mine Plan but within the mine lease area are not reported due to the uncertainty attached to such resources in that it cannot be assumed that all or part of the InferredResource will necessarily be upgraded to Indicated or Measured categories through continued exploration, such Inferred Resources do not necessarily meet the requirements of reasonable prospectsfor eventual economic extraction, particularly in respect of future mining and processing economics.Jellinbah is not reported as <strong>Anglo</strong> <strong>American</strong>’s shareholding is below the internal threshold for reporting.Estimates for the following operations were updated by depletion and new geological models and revised Life of Mine Plans are scheduled for 2013:Callide, Capcoal OC, Capcoal UG, Foxleigh, Moranbah North and Trend.Summary of material changes (±10%) in estimates at reporting levelDawson:Coal Reserves – The increase is primarily due to the conversion of resources to reserves as a result of additional exploration drilling, a revised mine plan with an extendedgeographical area and extraction schedule as well as revised economic parameters .Coal Resources – The decrease is a result of the exploration programme and the subsequent resource model update. The increased resource confidence enabled additionalresources to be converted to reserves. The extended geographical area resulted in replacement of Inferred due to the additional drilling.Drayton:Coal Reserves – Estimates from first principles using a revised mine plan results in a material decrease in reserves due to revised economic assumptions and additionalexploration data.Coal Resources – The material decrease is due to conversion of Coal Reserves and revised economic assumptions.Drayton South: Coal Resources – The increase is primarily due to model refinement (combination of plies into working sections for underground and open cut seams) as well as additionalexploration drilling and changes in geotechnical, environmental and resource utilisation considerations.Moranbah South: Coal Resources – The increase is due to additional exploration drilling and changed resource classification methodology to be consistent with Moranbah North and Grosvenorareas .Roman Mountain: Coal Resources – The increase is due to reinterpretation of the geological model and model refinement.Assumption with respect to Mineral TenureCallide:A Mining Lease Application has been lodged for the southern and eastern part of the Boundary Hill area and Metallurgical Coal has reasonable expectation that it will be granted.Foxleigh:Mining Lease Applications have been submitted for part of the Plains and Eagles Nest areas, and Metallurgical Coal has reasonable expectation that they will be granted.Audits related to the generation of the Coal Resource estimates were carried out by independent consultants during <strong>2012</strong> at the following operations and projects:Capcoal OC, Capcoal UG, Dawson and Foxleigh.Ore Reserves and Mineral Resources<strong>Anglo</strong> <strong>American</strong> plc <strong>Annual</strong> <strong>Report</strong> <strong>2012</strong> 203
ORE RESERVES AND MINERAL RESOURCESCOALestimates as at 31 December <strong>2012</strong>THERMAL COALThe Coal Reserve and Coal Resource estimates were compiled in accordance with The South African Code for the <strong>Report</strong>ing of Exploration Results, MineralResources and Mineral Reserves, (The SAMREC Code, 2007 Edition as amended July 2009) and the Australasian Code for <strong>Report</strong>ing of Exploration Results,Mineral Resources and Ore Reserves (The JORC Code, 2004) as applicable. The figures reported represent 100% of the Coal Reserves and Coal Resources,the percentage attributable to <strong>Anglo</strong> <strong>American</strong> plc is stated separately. Rounding of figures may cause computational discrepancies. <strong>Anglo</strong> <strong>American</strong> ThermalCoal comprises the dominantly export and domestic thermal coal operations, located in Colombia and South Africa.Thermal Coal – Colombia Operations MineROM Tonnes Yield Saleable Tonnes Saleable QualityCOAL RESERVES (1) (2)Attributable % Life Classification <strong>2012</strong> 2011 <strong>2012</strong> 2011 <strong>2012</strong> 2011 <strong>2012</strong> 2011Cerrejón (OC) 33.3 19 Mt Mt ROM % ROM % Mt Mt kcal/kg kcal/kgThermal – Export Proved 675.0 718.8 96.7 96.8 652.7 695.5 6,180 6,300Probable 93.2 86.0 97.0 96.8 90.4 83.2 6,110 6,240Total 768.2 804.8 96.7 96.8 743.1 778.7 6,170 6,290(3) (4) (3) (5)Thermal Coal – South Africa Operations MineROM Tonnes Yield Saleable Tonnes Saleable QualityCOAL RESERVES (1) (2)Attributable % Life Classification <strong>2012</strong> 2011 <strong>2012</strong> 2011 <strong>2012</strong> 2011 <strong>2012</strong> 2011Goedehoop (UG&OC) 100 8 Mt Mt ROM % ROM % Mt Mt kcal/kg kcal/kgThermal – Export Proved 30.0 37.4 54.9 53.0 16.8 20.2 6,190 6,230Probable 40.9 48.6 51.6 51.7 21.5 25.6 6,200 6,210Total 70.9 86.0 53.0 52.3 38.3 45.9 6,200 6,220Greenside (UG) 100 11 kcal/kg kcal/kgThermal – Export Proved 21.3 25.8 57.4 58.1 12.7 15.5 6,200 6,200Probable 26.4 21.9 54.0 53.9 14.8 12.3 6,190 6,190Total 47.7 47.8 55.5 56.2 27.5 27.8 6,190 6,200Isibonelo (OC) 100 15 kcal/kg kcal/kgSynfuel Proved 70.5 69.9 100 100 70.5 69.9 4,520 4,590Probable – – – – – – – –Total 70.5 69.9 100 100 70.5 69.9 4,520 4,590Kleinkopje (OC) 100 11 kcal/kg kcal/kgThermal – Export Proved 50.8 64.5 33.2 35.9 17.4 23.7 6,190 6,170Probable – 12.0 – 45.9 – 5.6 – 6,180Total 50.8 76.4 33.2 37.5 17.4 29.3 6,190 6,170kcal/kg kcal/kgThermal – Domestic Proved 38.5 33.8 19.6 21.8 4,580 4,550Probable – – – – – –Total 38.5 28.5 19.6 21.8 4,580 4,550Kriel (UG&OC) 73.0 13 kcal/kg kcal/kgThermal – Domestic Proved 40.3 46.0 100 100 40.3 46.0 4,830 4,790Probable 63.8 67.5 100 100 63.8 67.5 4,430 4,430Total 104.1 113.5 100 100 104.1 113.5 4,580 4,580Landau (OC) 100 6 kcal/kg kcal/kgThermal – Export Proved 29.6 36.4 48.4 48.5 14.5 17.8 6,210 6,240Probable 12.1 24.4 46.0 48.5 5.7 11.9 6,210 6,230Total 41.7 60.7 47.7 48.5 20.2 29.8 6,210 6,240kcal/kg kcal/kgThermal – Domestic Proved 12.3 8.8 3.7 3.2 4,040 4,550Probable 18.5 7.3 2.3 1.8 4,370 3,970Total 14.1 8.2 5.9 5.0 4,170 4,340Mafube (OC) 50.0 14 kcal/kg kcal/kgThermal – Export Proved 12.1 24.8 47.5 46.5 5.8 11.6 6,270 6,220Probable 70.7 66.6 33.9 33.1 24.2 22.2 6,260 6,210Total 82.8 91.3 35.9 36.7 30.0 33.8 6,260 6,210kcal/kg kcal/kgThermal – Domestic Proved 19.7 27.1 2.4 6.8 5,360 5,460Probable 29.1 37.3 21.2 25.0 4,970 5,010Total 27.7 34.5 23.6 31.8 5,010 5,110New Denmark (UG) 100 26 kcal/kg kcal/kgThermal – Domestic Proved 30.8 30.2 100 100 30.8 30.2 4,950 4,880Probable 81.2 80.9 100 100 81.2 80.9 5,020 5,120Total 112.0 111.1 100 100 112.0 111.1 5,000 5,050New Vaal (OC) 100 19 kcal/kg kcal/kgThermal – Domestic Proved 348.1 371.8 89.6 93.4 323.8 359.8 3,560 3,490Probable – – – – – – – –Total 348.1 371.8 89.6 93.4 323.8 359.8 3,560 3,490Zibulo (UG&OC) 73.0 18 kcal/kg kcal/kgThermal – Export Proved 91.3 86.1 49.4 49.4 45.6 43.0 6,100 6,090Probable 23.5 28.6 43.9 46.1 10.4 13.3 6,110 6,070Total 114.9 114.7 48.3 48.6 56.0 56.3 6,100 6,090kcal/kg kcal/kgThermal – Domestic Proved 26.6 29.8 25.1 26.4 4,930 4,820Probable 30.4 30.4 7.3 8.9 4,780 4,640Total 27.4 29.9 32.4 35.4 4,900 4,770Footnotes appear at the end of the section.(3) (4) (3) (5)204 <strong>Anglo</strong> <strong>American</strong> plc <strong>Annual</strong> <strong>Report</strong> <strong>2012</strong>
ORE RESERVES AND MINERAL RESOURCESCOALestimates as at 31 December <strong>2012</strong>Thermal Coal – South Africa OperationscontinuedCOAL RESERVES (1) Attributable %MineLifeROM Tonnes Yield Saleable Tonnes Saleable Quality(3) (4) (3) (5)Classification<strong>2012</strong> 2011 <strong>2012</strong> 2011 <strong>2012</strong> 2011 <strong>2012</strong> 2011(2)South Africa Thermal – Export 84.1 Mt Mt Plant % Plant % Mt Mt kcal/kg kcal/kgProved 724.9 792.9 52.9 48.2 112.8 131.8 6,160 6,170Probable 318.7 350.5 45.6 45.9 76.5 90.9 6,210 6,190Total 1,043.6 1,143.3 49.9 47.0 189.3 222.7 6,180 6,180South Africa Thermal – Domestic 92.2 kcal/kg kcal/kgProved 87.7 86.9 445.7 494.2 3,910 3,850Probable 88.2 87.2 175.7 184.1 4,780 4,820Total 87.8 86.8 621.4 678.4 4,150 4,110South Africa Synfuel 100 kcal/kg kcal/kgProved 100 100 70.5 69.9 4,520 4,590Probable – – – – – –Total 100 100 70.5 69.9 4,520 4,590Thermal Coal – Operations ROM Tonnes Yield Saleable Tonnes Saleable QualityTOTAL COAL RESERVES (1) (2)Attributable % Classification <strong>2012</strong> 2011 <strong>2012</strong> 2011 <strong>2012</strong> 2011 <strong>2012</strong> 2011Thermal – Export 43.6 Mt Mt Plant % Plant % Mt Mt kcal/kg kcal/kgProved 1,399.9 1,511.7 90.2 89.1 765.5 827.3 6,180 6,280Probable 411.9 436.5 73.4 70.2 166.9 174.2 6,160 6,210Total 1,811.8 1,948.2 87.2 85.7 932.4 1,001.4 6,170 6,270Thermal – Domestic 92.2 kcal/kg kcal/kgProved 87.7 86.9 445.7 494.2 3,910 3,850Probable 88.2 87.2 175.7 184.1 4,780 4,820Total 87.8 86.8 621.4 678.4 4,150 4,110Synfuel 100 kcal/kg kcal/kgProved 100 100 70.5 69.9 4,520 4,590Probable – – – – – –Total 100 100 70.5 69.9 4,520 4,590(3) (4) (3) (5)Mining method: OC = Open Cut, UG = Underground. Mine Life = The extraction period in years for scheduled Ore Reserves comprising Proved and Probable Reserves only.For the multi-product operations, the ROM tonnage figures apply to each product.The Saleable tonnes cannot be calculated directly from the ROM reserve tonnes using the air dried yields as presented since the difference in moisture content is not taken into account.Attributable percentages for country totals are weighted by Saleable tonnes and should not be directly applied to the ROM tonnes.Footnotes appear at the end of the section.Thermal – Export refers to low- to high-volatile thermal coal primarily for export in the use of power generation; quality measured by calorific value (CV).Thermal – Domestic refers to low- to high-volatile thermal coal primarily for domestic consumption for power generation; quality measured by calorific value (CV).Synfuel refers to a coal specifically for the domestic production of synthetic fuel and chemicals; quality measured by calorific value (CV).Ore Reserves and Mineral Resources<strong>Anglo</strong> <strong>American</strong> plc <strong>Annual</strong> <strong>Report</strong> <strong>2012</strong> 205
ORE RESERVES AND MINERAL RESOURCESCOALestimates as at 31 December <strong>2012</strong>Thermal Coal – Colombia Operations Tonnes Coal QualityCOAL RESOURCES (6) (2)Attributable % Classification <strong>2012</strong> 2011 <strong>2012</strong> 2011Cerrejón (OC) 33.3 MTIS MTIS kcal/kg kcal/kgMeasured 903.6 907.2 6,450 6,460Indicated 160.0 173.9 6,360 6,370Measured and Indicated 1,063.6 1,081.1 6,440 6,450(8)Inferred (in LOM Plan) 73.8 69.2 6,720 6,750COAL RESOURCES ARE REPORTED AS ADDITIONAL TO COAL RESERVES.(6) (6) (7) (7)Thermal Coal – South Africa Operations Tonnes Coal QualityCOAL RESOURCES (6) (2)Attributable % Classification <strong>2012</strong> 2011 <strong>2012</strong> 2011Goedehoop (UG&OC) 100 MTIS MTIS kcal/kg kcal/kgMeasured 83.1 79.8 5,510 5,470Indicated 75.7 75.6 5,470 5,480Measured and Indicated 158.8 155.4 5,490 5,470(8)Inferred (in LOM Plan) 1.6 – 5,740 –Greenside (UG) 100 Measured 18.2 11.4 5,590 5,700Indicated 1.4 2.8 5,610 5,430Measured and Indicated 19.6 14.2 5,590 5,650(8)Inferred (in LOM Plan) 8.3 – 5,790 –Isibonelo (OC) 100 Measured – – – –Indicated 16.3 20.9 5,250 5,210Measured and Indicated 16.3 20.9 5,250 5,210(8)Inferred (in LOM Plan) – – – –Kleinkopje (OC) 100 Measured 30.4 28.5 5,040 4,970Indicated – – – –Measured and Indicated 30.4 28.5 5,040 4,970(8)Inferred (in LOM Plan) – – – –Kriel (UG&OC) 73.0 Measured 8.7 9.0 5,290 5,290Indicated 10.2 10.2 4,860 4,860Measured and Indicated 18.8 19.3 5,060 5,060(8)Inferred (in LOM Plan) – – – –Landau (OC) 100 Measured 52.0 26.5 5,190 4,810Indicated 42.8 34.3 4,680 5,180Measured and Indicated 94.8 60.8 4,960 5,020(8)Inferred (in LOM Plan) – – – –Mafube (OC) 50.0 Measured 56.5 2.5 5,300 5,090Indicated 13.2 7.4 4,530 5,250Measured and Indicated 69.7 9.9 5,150 5,210(8)Inferred (in LOM Plan) 7.3 17.0 5,150 5,170New Denmark (UG) 100 Measured – – – –Indicated – – – –Measured and Indicated – – – –(8)Inferred (in LOM Plan) 16.2 17.0 5,270 5,310New Vaal (OC) 100 Measured – – – –Indicated – – – –Measured and Indicated – – – –(8)Inferred (in LOM Plan) – – – –Zibulo (UG&OC) 73.0 Measured 147.3 136.3 4,960 4,950Indicated 201.7 184.2 4,900 4,880Measured and Indicated 349.0 320.6 4,920 4,910(8)Inferred (in LOM Plan) 20.4 29.3 5,460 5,470South Africa – Mine Leases 82.3 Measured 396.2 294.0 5,200 5,120Indicated 361.2 335.4 5,000 5,080Measured and Indicated 757.4 629.4 5,100 5,100(8)Inferred (in LOM Plan) 53.9 63.3 5,420 5,350COAL RESOURCES ARE REPORTED AS ADDITIONAL TO COAL RESERVES.(6) (6) (7) (7)Thermal Coal – OperationsTonnes Coal QualityCOAL RESOURCES (6) (2)Attributable % Classification <strong>2012</strong> 2011 <strong>2012</strong> 2011Total 53.7 MTIS MTIS kcal/kg kcal/kgMeasured 1,299.7 1,201.2 6,070 6,130Indicated 521.2 509.3 5,410 5,520Measured and Indicated 1,821.0 1,710.6 5,880 5,950(8)Inferred (in LOM Plan) 127.7 132.4 6,170 6,080COAL RESOURCES ARE REPORTED AS ADDITIONAL TO COAL RESERVES.Footnotes appear at the end of the section.(6) (6) (7) (7)206 <strong>Anglo</strong> <strong>American</strong> plc <strong>Annual</strong> <strong>Report</strong> <strong>2012</strong>
ORE RESERVES AND MINERAL RESOURCESCOALestimates as at 31 December <strong>2012</strong>Thermal Coal – South Africa Projects Tonnes Coal QualityCOAL RESOURCES (6)(8) (2)Attributable % Classification <strong>2012</strong> 2011 <strong>2012</strong> 2011Elders 73.0 MTIS MTIS kcal/kg kcal/kgMeasured 224.3 218.1 5,140 5,110Indicated 107.6 107.9 5,410 5,400Measured and Indicated 331.8 326.0 5,230 5,210Kriel Block F 100 Measured 36.1 – 5,270 –Indicated 27.3 62.8 5,410 5,310Measured and Indicated 63.4 62.8 5,330 5,310Kriel East 73.0 Measured 100.1 81.5 4,940 4,940Indicated 31.4 36.0 4,890 4,950Measured and Indicated 131.5 117.5 4,930 4,940New Largo 73.0 Measured 429.5 484.9 4,290 4,300Indicated 178.5 159.3 3,970 3,920Measured and Indicated 608.0 644.3 4,190 4,210Nooitgedacht 100 Measured 36.4 35.8 5,360 5,310Indicated 10.6 10.6 5,450 5,450Measured and Indicated 46.9 46.4 5,380 5,340South Rand 73.0 Measured 78.6 78.6 4,850 4,850Indicated 168.1 168.1 4,770 4,770Measured and Indicated 246.7 246.7 4,800 4,800Vaal Basin 100 Measured 375.2 208.2 4,330 3,980Indicated 220.4 362.5 4,210 4,140Measured and Indicated 595.6 570.7 4,290 4,080South Africa – Projects 82.4 Measured 1,280.2 1,107.1 4,590 4,520Indicated 743.8 907.2 4,540 4,500Measured and Indicated 2,024.0 2,014.3 4,570 4,510Attributable percentages for country totals are weighted by Measured and Indicated MTIS.(6) (6) (7) (7)(1)Coal Reserves are quoted on a Run Of Mine (ROM) reserve tonnes basis, which represents the tonnes delivered to the plant. Saleable reserve tonnes represents the product tonnes produced.Coal Reserves (ROM and Saleable) are on the applicable moisture basis.(2)Attributable (%) refers to <strong>2012</strong> only. For the 2011 <strong>Report</strong>ed and Attributable figures, please refer to the 2011 <strong>Annual</strong> <strong>Report</strong>.(3)ROM tonnes quoted on an As Delivered moisture basis, and Saleable tonnes on a Product moisture basis.(4)Yield – ROM % represents the ratio of Saleable reserve tonnes to ROM reserve tonnes and is quoted on a constant moisture basis or on an air dried to air dried basis whereas Plant % is based on the‘Feed to Plant’ tonnes. The product yields (ROM %) for Proved, Probable and Total are calculated by dividing the individual Saleable reserves by the total ROM reserves per classification.(5)The coal quality for the Coal Reserves is quoted as either Calorific Value (CV) using kilo-calories per kilogram (kcal/kg) units on a Gross As Received (GAR) basis.Coal quality parameters for the Coal Reserves for Coking, Other Metallurgical and Export Thermal collieries meet the contractual specifications for coking coal, PCI, metallurgical coal, steam coal anddomestic coal. Coal quality parameters for the Coal Reserves for Domestic Power and Domestic Synfuels collieries meet the specifications of the individual supply contracts in the short-term andstudies are underway to ensure long term compliance.CV is rounded to the nearest 10 kcal/kg.(6)Coal Resources are quoted on a Mineable Tonnes In-Situ (MTIS) basis in million tonnes, which are in addition to those resources that have been modified to produce the reported Coal Reserves.Coal Resources are on an in-situ moisture basis.(7)The coal quality for the Coal Resources is quoted on an in-situ heat content as Calorific Value (CV) using kilo-calories per kilogram (kcal/kg) units on a Gross As Received (GAR) basis.CV is rounded to the nearest 10 kcal/kg.(8)Inferred (in LOM Plan) refers to Inferred Coal Resources that are included in the life of mine extraction schedule of the respective collieries and are not reported as Coal Reserves. Inferred CoalResources outside the Life of Mine Plan but within the mine lease area are not reported due to the uncertainty attached to such resources in that it cannot be assumed that all or part of the InferredResource will necessarily be upgraded to Indicated or Measured categories through continued exploration, such Inferred Resources do not necessarily meet the requirements of reasonable prospectsfor eventual economic extraction, particularly in respect of future mining and processing economics.Summary of material changes (±10%) in estimates at reporting levelGreenside: Coal Resources – Increase due to the inclusion of boreholes from Landau in the geological model resulted in seam thickness changes. The AATC standard software package was alsoimplemented. Increase in Inferred in Mine Plan resulting from the conversion of the Clydesdale Pan from Inferred in Mine Lease to Mine Plan after the environmental approval wasgranted.Isibonelo:Coal Resources – Decrease due to the transfer and conversion of underground resources to opencast reserves.Kleinkopje: Coal Reserves – Decrease due to the transfer between Kleinkopje and Greenside following a mining boundary rationalisation exercise.Coal Resources – Increase due to seam thickness adjustments resulting from additional drilling and interpretation, adjustments to 5 seam remnants, and reclassification in Pit 2Alayout following the reconfiguration exercise.Landau:Coal Reserves – Decrease due to the downgrade of Schoonie West S2S to resource as the Pre-Feasibility study is not yet approved.Coal Resources – Increase due to transfer of Greenside Resources into the Landau Lifex Project as well as an increase to the resource footprint as a result of Pre-Feasibilityoption analyses.Mafube:Coal Resources – Increase results from additional drilling, the upgrade of S4 due to the viability of a lower quality product, re-classification of the Pan 2 area in Springboklaagtepending the granting of the environmental approvals and removal of the Rooipan area.Nooitgedacht: Coal Resources – Increase due to planned shaft closure and the re-allocation of the reserves to resources.Coal Resources for 2 + 4 Seam and 5 Seam have been combined and reported under South Africa Coal Projects.Kriel East:Coal Resources – Increase resulting from additional drilling information.Vaal Basin: Coal Resources – Increase resulting from additional drilling information offset by a decrease resulting from downgrade of all resources within the Wetland area.Assumption with respect to Mineral TenureCerrejón:Reserves are estimated for the area defined by the current approved Mining Right, which expires in 2033. In order to exploit the Coal Resources, a renewal will be applied for at theappropriate time, <strong>Anglo</strong> <strong>American</strong> Thermal Coal has reasonable expectation that such renewal will not be withheld.Mafube:Application for conversion to a Mining Right has been submitted in November 2011; in addition the environmental permitting applications have been submitted in <strong>2012</strong> as perlegislative requirements. There is a reasonable expectation that such conversion will not be withheld.New Largo: The New Largo Mining Right Application was submitted in April 2011. The relevant South African Departments responsible for approvals, as well as key stakeholders, have beenactively engaged with regards to the Colliery’s potential impacts on wetlands. There is a reasonable expectation that such conversion will not be withheld.Royalty PaymentSouth Africa:Royalty payments commenced in February 2010 in accordance with the Royalties Act (No. 28 of 2008) and have been taken into consideration in economic assessment ofthe reserves.Audits related to the generation of the Coal Reserve and Coal Resource estimates were carried out by independent consultants during <strong>2012</strong> at the following operations and projects:Goedehoop, Greenside, Isibonelo, Kleinkopje, Mafube, Elders and Vaal Basin.Ore Reserves and Mineral Resources<strong>Anglo</strong> <strong>American</strong> plc <strong>Annual</strong> <strong>Report</strong> <strong>2012</strong> 207
ORE RESERVES AND MINERAL RESOURCESCOPPERestimates as at 31 December <strong>2012</strong>COPPERThe Ore Reserve and Mineral Resource estimates were compiled in accordance with the Australasian Code for <strong>Report</strong>ing of Exploration Results, MineralResources and Ore Reserves (The JORC Code, 2004) as a minimum standard. The figures reported represent 100% of the Ore Reserves and MineralResources, the percentage attributable to <strong>Anglo</strong> <strong>American</strong> plc is stated separately. Rounding of figures may cause computational discrepancies.Copper – OperationsMineTonnes Grade Contained MetalORE RESERVES (1)Attributable % Life Classification <strong>2012</strong> 2011 <strong>2012</strong> 2011 <strong>2012</strong> 2011Collahuasi (OP) (2) 44.0 70 Mt Mt %TCu %TCu kt ktOxide and Mixed Proved 31.0 0.0 0.58 0.60 181 0Heap Leach Copper Probable 13.0 35.4 0.71 0.63 93 224Total 44.1 35.4 0.62 0.63 274 224%TCu%TCuSulphide Proved 419.1 285.0 1.00 1.07 4,200 3,042Flotation – direct feed Copper Probable 1,655.1 1,640.3 0.98 0.93 16,202 15,177Total 2,074.2 1,925.3 0.98 0.95 20,402 18,219%Mo%MoProved 0.024 – 98 –Molybdenum Probable 0.024 – 398 –Total 0.024 – 496 –%TCu%TCuLow Grade Sulphide Proved – – – – – –Flotation – stockpile Copper Probable 1,069.2 935.2 0.49 0.49 5,219 4,596Total 1,069.2 935.2 0.49 0.49 5,219 4,596%Mo%MoProved – – – –Molybdenum Probable 0.010 – 105 –Total 0.010 – 105 –El Soldado (OP) 50.1 23 %TCu %TCuSulphide Proved 125.7 95.4 0.81 0.96 1,018 915Flotation (3) Probable 44.6 67.3 0.79 0.79 352 533Total 170.3 162.7 0.80 0.89 1,371 1,448Oxide Proved – – – – – –Heap Leach Probable 3.0 3.5 0.45 0.46 14 16Total 3.0 3.5 0.45 0.46 14 16Los Bronces (OP) 50.1 36 %TCu %TCuSulphide Proved 729.9 899.6 0.70 0.69 5,109 6,208Flotation Copper Probable 779.4 598.8 0.53 0.51 4,131 3,054Total 1,509.3 1,498.4 0.61 0.62 9,240 9,261%Mo%MoProved 0.016 – 117 –Molybdenum Probable 0.013 – 101 –Total 0.014 – 218 –%TCu%TCuSulphide Proved 428.6 486.6 0.32 0.35 1,371 1,703Dump Leach (4) Copper Probable 179.0 197.1 0.29 0.27 519 532Total 607.6 683.7 0.31 0.33 1,891 2,235%Mo%MoProved 0.007 – 30 –Molybdenum Probable 0.006 – 11 –Total 0.007 – 41 –Mantos Blancos (OP) 100 8 %ICu %ICuSulphide Proved 14.1 26.3 0.82 0.83 115 218Flotation (5) Probable 21.6 19.7 0.79 0.80 170 157Total 35.6 46.0 0.80 0.82 286 376%ASCu%ASCuOxide Proved 2.7 8.3 0.55 0.54 15 45Vat and Heap Leach (6) Probable 12.7 16.3 0.38 0.33 47 54Total 15.4 24.7 0.41 0.40 62 99%ASCu%ASCuOxide Proved – 2.1 – 0.18 – 4Dump Leach (7) Probable 36.8 49.6 0.23 0.23 84 115Total 36.8 51.7 0.23 0.23 84 119Mantoverde (OP) 100 5 %ASCu %ASCuOxide Proved 22.2 33.3 0.56 0.59 124 196Heap Leach (8) Probable 20.2 9.5 0.52 0.55 105 52Total 42.3 42.7 0.54 0.58 229 248%ASCu%ASCuOxide Proved 18.4 27.2 0.23 0.24 42 65Dump Leach (9) Probable 25.7 18.2 0.27 0.28 70 51Total 44.2 45.4 0.25 0.26 112 116Mining method: OP = Open Pit. Mine Life = The extraction period in years for scheduled Ore Reserves comprising Proved and Probable Reserves only.TCu = total copper, ICu = insoluble copper (total copper less acid soluble copper), ASCu = acid soluble copper.208 <strong>Anglo</strong> <strong>American</strong> plc <strong>Annual</strong> <strong>Report</strong> <strong>2012</strong>
ORE RESERVES AND MINERAL RESOURCESCOPPERestimates as at 31 December <strong>2012</strong>(1)Copper Reserves: A variable cut-off from 0.20% up to 0.50% (CuT, ICu or ASCu) is applied as cut-offs to determine Ore Reserves on operations.(2)Collahuasi: The increases in Ore Reserves is due to the completion of a drilling campaign at Rosario Oeste enabling conversion of additional Mineral Resources to Ore Reserves. Ujina also hasadditional Ore Reserves due to a change in economic assumptions (increase in long term metal price) and an updated geological model.(3)El Soldado – Sulphide (Flotation): The decrease in Ore Reserves is due to production and a change in the block modelling methodology to take into account a change in the mine design (benchheight) offset by increases due to a change in economic assumptions (increase in long term metal price) and new drilling information.(4)Los Bronces – Sulphide (Dump Leach): The decrease in Ore Reserves is due to a combination of production, changes to the mine plan, a new classification methodology (which resulted inre-allocation of probable reserves to inferred resources) offset by an increase due to a change in economic assumptions (increase in long term metal price).(5)Mantos Blancos – Sulphide (Flotation): The decrease in Ore Reserves is primarily due to an updated mine planning schedule offset by a small increase due to new information from within the pit.(6)Mantos Blancos – Oxide (Vat and Heap Leach): The decrease in Ore Reserves is primarily due to transfer of material to the Dump Leaching process along with production.(7)Mantos Blancos – Oxide (Dump Leach): The decrease in Ore Reserves is primarily due to production along with transfer of material to the Vat Leach Process which is offset by Vat Leach Tailingswhich will now be put through the Dump Leach Process.(8)Mantoverde – Oxide (Heap Leach): The decrease in Ore Reserves is due to production offset by conversion of Mineral Resources to Ore Reserves enabled by new drilling information.(9)Mantoverde – Oxide (Dump Leach): The decrease in Ore Reserves is due to production offset by an increase of Dump Material within the Montecristo, Quisco and Pto 62 areas as a result ofcontinued drilling.Audits related to the generation of the Ore Reserve and Mineral Resource estimates were carried out by independent consultants during <strong>2012</strong> at the following operations:El Soldado, Los Bronces, Mantos Blanco and Mantoverde.Ore Reserves and Mineral Resources<strong>Anglo</strong> <strong>American</strong> plc <strong>Annual</strong> <strong>Report</strong> <strong>2012</strong> 209
ORE RESERVES AND MINERAL RESOURCESCOPPERestimates as at 31 December <strong>2012</strong>Copper – OperationsTonnes Grade Contained MetalMINERAL RESOURCES (1) Attributable % Classification <strong>2012</strong> 2011 <strong>2012</strong> 2011 <strong>2012</strong> 2011Collahuasi (OP) 44.0 Mt Mt %TCu %TCu kt ktOxide and Mixed Measured – – – – – –Heap Leach Indicated 0.5 15.1 0.70 0.60 3 90Copper Measured and Indicated 0.5 15.1 0.70 0.60 3 90Inferred (in LOM Plan) 2.8 3.9 0.37 0.62 11 24Inferred (ex. LOM Plan) 8.5 0.3 0.62 0.61 53 2Total Inferred 11.3 4.2 0.56 0.62 63 26%TCu%TCuSulphide (2) Measured 4.6 1.2 0.75 0.78 35 9Flotation – direct feed Indicated 1,148.9 628.9 0.94 0.91 10,821 5,694Copper Measured and Indicated 1,153.6 630.1 0.94 0.91 10,856 5,704Inferred (in LOM Plan) 486.1 660.6 1.03 0.99 5,017 6,532Inferred (ex. LOM Plan) 2,654.9 1,944.6 0.92 0.91 24,441 17,676Total Inferred 3,141.0 2,605.3 0.94 0.93 29,458 24,208%Mo%MoMeasured 0.005 – 0 –Indicated 0.047 – 368 –Molybdenum Measured and Indicated 0.047 – 368 –Inferred (in LOM Plan) 0.016 – 76 –Inferred (ex. LOM Plan) 0.022 – 584 –Total Inferred 0.021 – 660 –%TCu%TCuLow Grade Sulphide (2) Measured 6.2 1.2 0.48 0.44 30 5Flotation – stockpile Indicated 265.9 152.5 0.46 0.46 1,233 698Copper Measured and Indicated 272.1 153.7 0.46 0.46 1,263 704Inferred (in LOM Plan) 361.6 579.0 0.45 0.44 1,616 2,564Inferred (ex. LOM Plan) 945.4 736.8 0.47 0.46 4,419 3,414Total Inferred 1,307.0 1,315.8 0.46 0.45 6,036 5,978%Mo%MoMeasured 0.012 – 1 –Indicated 0.021 – 25 –Molybdenum Measured and Indicated 0.021 – 26 –Inferred (in LOM Plan) 0.004 – 14 –Inferred (ex. LOM Plan) 0.005 – 44 –Total Inferred 0.005 – 58 –El Soldado (OP) 50.1 %TCu %TCuSulphide Measured 24.7 21.9 0.78 0.82 193 180Flotation (3) Indicated 7.7 18.8 0.72 0.72 55 135Measured and Indicated 32.4 40.7 0.77 0.77 248 315Inferred (in LOM Plan) 7.7 20.9 0.58 0.81 45 169Inferred (ex. LOM Plan) 6.4 12.7 0.53 0.71 34 90Total Inferred 14.1 33.6 0.56 0.77 79 260Oxide Measured 0.0 0.1 0.68 0.75 0 1Heap Leach Indicated 0.0 0.1 0.62 0.69 0 1Measured and Indicated 0.0 0.2 0.66 0.71 0 1Inferred (in LOM Plan) – – – – – –Inferred (ex. LOM Plan) 0.0 0.1 0.57 0.69 0 0Total Inferred 0.0 0.1 0.57 0.69 0 0Los Bronces (OP) 50.1 %TCu %TCuSulphide Measured 84.8 211.1 0.45 0.45 382 950Flotation (4) Indicated 897.6 922.9 0.40 0.43 3,590 3,968Copper Measured and Indicated 982.4 1,133.9 0.40 0.43 3,972 4,918Inferred (in LOM Plan) 212.0 83.7 0.48 0.58 1,018 485Inferred (ex. LOM Plan) 3,311.1 3,115.6 0.36 0.39 11,920 12,151Total Inferred 3,523.1 3,199.3 0.37 0.39 12,938 12,636%Mo%MoMeasured 0.005 – 4 –Indicated 0.009 – 81 –Molybdenum Measured and Indicated 0.009 – 85 –Inferred (in LOM Plan) 0.013 – 28 –Inferred (ex. LOM Plan) 0.008 – 265 –Total Inferred 0.008 – 293 –%TCu%TCuSulphide Measured – – – – – –Dump Leach (5) Indicated – – – – – –Copper Measured and Indicated – – – – – –Inferred (in LOM Plan) 173.2 114.4 0.28 0.26 485 298Inferred (ex. LOM Plan) – – – – – –Total Inferred 173.2 114.4 0.28 0.26 485 298%Mo%MoMeasured – – – –Indicated – – – –Molybdenum Measured and Indicated – – – –Inferred (in LOM Plan) 0.006 – 10 –Inferred (ex. LOM Plan) – – – –Total Inferred 0.006 – 10 –210 <strong>Anglo</strong> <strong>American</strong> plc <strong>Annual</strong> <strong>Report</strong> <strong>2012</strong>
ORE RESERVES AND MINERAL RESOURCESCOPPERestimates as at 31 December <strong>2012</strong>Copper – Operations continued Tonnes Grade Contained MetalMINERAL RESOURCES (1) Attributable % Classification <strong>2012</strong> 2011 <strong>2012</strong> 2011 <strong>2012</strong> 2011Mantos Blancos (OP) 100 Mt Mt %ICu %ICu kt ktSulphide Measured 30.2 47.8 0.95 0.75 286 359Flotation (6) Indicated 64.8 68.1 0.69 0.56 447 379Measured and Indicated 95.0 116.0 0.77 0.64 734 738Inferred (in LOM Plan) 9.4 2.7 0.46 0.57 43 16Inferred (ex. LOM Plan) 23.8 27.8 0.66 0.55 157 153Total Inferred 33.2 30.5 0.60 0.55 201 168%ASCu%ASCuOxide Measured 3.5 14.1 0.50 0.47 17 66Vat and Heap Leach (7) Indicated 11.1 10.5 0.45 0.43 50 45Measured and Indicated 14.6 24.5 0.46 0.45 67 111Inferred (in LOM Plan) 17.6 1.9 0.26 0.53 46 10Inferred (ex. LOM Plan) 7.4 3.3 0.46 0.47 34 16Total Inferred 25.0 5.2 0.32 0.49 80 26%ASCu%ASCuOxide Measured 0.4 – 0.18 – 1 –Dump Leach (8) Indicated 8.4 8.3 0.17 0.20 14 17Measured and Indicated 8.8 8.3 0.17 0.20 15 17Inferred (in LOM Plan) 91.4 65.8 0.23 0.23 210 154Inferred (ex. LOM Plan) 4.3 – 0.17 – 7 –Total Inferred 95.7 65.8 0.23 0.23 218 154Mantoverde (OP) 100 %ASCu %ASCuOxide Measured 5.1 21.1 0.42 0.36 22 76Heap Leach (9) Indicated 6.7 13.1 0.53 0.42 35 55Measured and Indicated 11.8 34.2 0.48 0.38 57 131Inferred (in LOM Plan) 3.3 0.6 0.69 0.53 23 3Inferred (ex. LOM Plan) 0.1 0.9 0.30 0.29 0 3Total Inferred 3.4 1.5 0.68 0.38 23 6%ASCu%ASCuOxide Measured – – – – – –Dump Leach Indicated – – – – – –Measured and Indicated – – – – – –Inferred (in LOM Plan) 0.6 0.9 0.24 0.22 1 2Inferred (ex. LOM Plan) – – – – – –Total Inferred 0.6 0.9 0.24 0.22 1 2MINERAL RESOURCES ARE REPORTED AS ADDITIONAL TO ORE RESERVES.(1)Copper Resources: A test of reasonable eventual economic extraction is applied through consideration of an optimised pit shell. Materials outside the optimised shell that have potential of eventualeconomic extraction via underground means are not included in the Mineral Resource statement. Mineral Resources are quoted above a 0.2% TCu cut-off.(2)Collahuasi – Sulphide and Low Grade Sulphide (Flotation): The increase in Mineral Resources is primarily due to Economic Assumptions (increase in long term metal price) and new drillinginformation which identified and delineated new resources.(3)El Soldado – Sulphide (Flotation): The decrease in Mineral Resources is primarily due to conversion of Mineral Resources to Ore Reserves (increase in long term metal price) and greater dilutioneffect as a result of a change in bench height and ore/waste contact modelling methodology.(4)Los Bronces – Sulphide (Flotation): The decrease in Measured and Indicated Mineral Resources is due to a change in the estimation methodology and new classification. The overall increase inMineral Resources is due to a change in economic assumptions (increase in long term metal price).(5)Los Bronces – Sulphide (Dump Leach): The Mineral Resources increase due to the re-allocation of Probable Reserves to Inferred Resources, which is offset by a decrease due to changes in thecut-off grade strategy applied to material sent to the flotation plant.(6)Mantos Blancos – Sulphide (Flotation): The increase in Mineral Resources is due to new drilling information which identified and delineated new resources offset by a refinement in the estimationmethodology.(7)Mantos Blancos – Oxide (Vat and Heap Leach): The increase in Mineral Resources is due to increased feed from the Mercedes Dump offset by a change in the estimation methodology.(8)Mantos Blancos – Oxide (Dump Leach): The Mineral Resources increase due to additional material from Phase II of Mercedes Dump and Botadero B zones.(9)Mantoverde – Oxide (Heap Leach): The decrease in Mineral Resources is due to conversion to Ore Reserves enabled by new drilling information.Ore Reserves and Mineral Resources<strong>Anglo</strong> <strong>American</strong> plc <strong>Annual</strong> <strong>Report</strong> <strong>2012</strong> 211
ORE RESERVES AND MINERAL RESOURCESCOPPERestimates as at 31 December <strong>2012</strong>Copper – ProjectsTonnes Grade Contained MetalMineORE RESERVESAttributable % Life Classification <strong>2012</strong> 2011 <strong>2012</strong> 2011 <strong>2012</strong> 2011Quellaveco (OP) (1) 81.9 28 Mt Mt %TCu %TCu kt ktSulphide Proved 701.8 701.8 0.65 0.65 4,562 4,562Flotation Copper Probable 214.6 214.6 0.63 0.63 1,352 1,352Total 916.4 916.4 0.65 0.65 5,914 5,914%Mo%MoProved 0.019 – 133 –Molybdenum Probable 0.021 – 45 –Total 0.019 – 178 –Copper – ProjectsTonnes Grade Contained MetalMINERAL RESOURCES Attributable % Classification <strong>2012</strong> 2011 <strong>2012</strong> 2011 <strong>2012</strong> 2011Quellaveco (OP) (1) 81.9 Mt Mt %TCu %TCu kt ktSulphide Measured 284.2 196.8 0.35 0.40 990 787Flotation Indicated 807.9 627.0 0.41 0.45 3,290 2,822Copper Measured and Indicated 1,092.0 823.8 0.39 0.44 4,280 3,609Inferred (in LOM Plan) 6.9 8.1 0.79 0.72 54 58Inferred (ex. LOM Plan) 877.9 174.9 0.33 0.44 2,893 770Total Inferred 884.8 183.0 0.33 0.45 2,947 828%Mo%MoMeasured 0.015 – 43 –Indicated 0.015 – 121 –Molybdenum Measured and Indicated 0.015 – 164 –Inferred (in LOM Plan) – – – –Inferred (ex. LOM Plan) 0.015 – 132 –Total Inferred 0.015 – 132 –Mantoverde Sulphide Project (2) 100 %TCu %TCuSulphide Measured 106.6 109.8 0.68 0.67 725 736Flotation Indicated 41.5 34.2 0.66 0.63 274 216Measured and Indicated 148.1 144.0 0.67 0.66 999 951Inferred 78.0 44.3 0.68 0.65 530 288Pebble (OP/UG) (3)(4)(5) 50.0 %TCu %TCu507.9 507.9 0.34 0.34 1,715 1,715Sulphide Measured (4)Indicated (5) 4,761.0 4,761.0 0.46 0.46 21,739 21,739Measured and Indicated 5,268.8 5,268.8 0.45 0.45 23,454 23,454Inferred (6) 2,709.5 2,709.5 0.32 0.32 8,587 8,587Los Sulfatos (6) 50.1 %TCu %TCuSulphide Inferred 1,200 1,200 1.46 1.46 17,520 17,520San Enrique Monolito (7) 50.1 %TCu %TCuSulphide Inferred 900 900 0.81 0.81 7,290 7,290West Wall (8) 50.0 %TCu %TCuSulphide Inferred 750 750 0.54 0.54 4,050 4,050MINERAL RESOURCES ARE REPORTED AS ADDITIONAL TO ORE RESERVES.Mining method: OP = Open Pit, UG = Underground. Mine Life = The extraction period in years for scheduled Ore Reserves comprising Proved and Probable Reserves only.Due to the uncertainty that may be attached to some Inferred Mineral Resources, it cannot be assumed that all or part of an Inferred Mineral Resource will necessarily be upgraded to an Indicated orMeasured Resource after continued exploration.(1)Quellaveco: Mineral Resources are quoted above a 0.2 %TCu cut-off. The increase in the Mineral Resources is due to a change in economic assumptions (increase in long term metal price), a changein the cut-off grade strategy and the addition of low-grade stockpile material.(2)Mantoverde Sulphide Project: Mineral Resources are quoted above a 0.35 %TCu cut-off. The increase in Mineral Resources is primarily due to new drilling information.There is a possibility to consider Oxides together with the Sulphides. Oxide Mineral Resource estimates are as follows:Measured 53.2 Mt at 0.40 %ASCu; Indicated 4.0 Mt at 0.39 %ASCu; Inferred 10.1 Mt at 0.40 %ASCu.(3)Pebble: The Mineral Resources are based on drilling to May 2009 and a block model finalised in December 2009. <strong>Report</strong>ed Mineral Resources fall within a volume defined by resource price estimatesand are based on a cut-off grade of 0.40% CuEq. Calculation of copper equivalent (CuEq) is based on long term metal prices and takes into consideration the recovery of Copper, Gold andMolybdenum. At a cut-off of 0.60% CuEq the estimate of Measured Resources is 278 Mt at 0.40% Cu, 0.42 g/t Au, 0.020% Mo while the estimate of Indicated Resources is 3,319 Mt at 0.55% Cu,0.42 g/t Au, 0.030% Mo.(4)Pebble co-product estimated grades:Measured – Gold 0.36g/t, Molybdenum 0.018%, CuEq average grade 0.66%Indicated – Gold 0.37g/t, Molybdenum 0.027%, CuEq average grade 0.85%.Inferred – Gold 0.31g/t, Molybdenum 0.026%, CuEq average grade 0.67%.(5)Pebble: The property comprises 2,042 located Alaska State mineral claims which total 209,996 acres (84,982 hectares) and which are currently valid.(6)Los Sulfatos: The reported resources include mineralisation inside a 1% nominal copper grade cut-off envelope down to the current drillhole depths of 1,000 metres below surface. The test forreasonable prospects of eventual economic extraction is based on an underground operation.(7)San Enrique Monolito: The test for reasonable prospects of eventual economic extraction is based on an underground operation.(8)West Wall: The test for reasonable prospects of eventual economic extraction is based on an open pit operation to a depth of 600m below surface.Audits related to the generation of the Ore Reserve and Mineral Resource estimates were carried out by independent consultants during <strong>2012</strong> at the following projects:Quellaveco and Mantoverde Sulphide Project.212 <strong>Anglo</strong> <strong>American</strong> plc <strong>Annual</strong> <strong>Report</strong> <strong>2012</strong>
ORE RESERVES AND MINERAL RESOURCESNICKELestimates as at 31 December <strong>2012</strong>NICKELThe Ore Reserve and Mineral Resource estimates were compiled in accordance with the Australasian Code for <strong>Report</strong>ing of Exploration Results, MineralResources and Ore Reserves (The JORC Code, 2004) as a minimum standard. The figures reported represent 100% of the Ore Reserves and MineralResources, the percentage attributable to <strong>Anglo</strong> <strong>American</strong> plc is stated separately. Rounding of figures may cause computational discrepancies.Nickel – OperationsTonnes Grade Contained MetalMineORE RESERVESAttributable % Life Classification <strong>2012</strong> 2011 <strong>2012</strong> 2011 <strong>2012</strong> 2011Barro Alto (OP) (1) 100 17 Mt Mt %Ni %Ni kt ktSaprolite Proved 23.4 21.2 1.71 1.66 401 352Probable 23.4 31.0 1.51 1.55 353 481Total 46.8 52.2 1.61 1.60 754 833Niquelândia (OP) (2) 100 22 %Ni %NiSaprolite Proved 3.9 3.7 1.35 1.35 52 50Probable 1.0 0.9 1.32 1.33 14 12Total 4.9 4.6 1.34 1.35 66 63Nickel – OperationsTonnes Grade Contained MetalMINERAL RESOURCES Attributable % Classification <strong>2012</strong> 2011 <strong>2012</strong> 2011 <strong>2012</strong> 2011Barro Alto (OP) 100 Mt Mt %Ni %Ni kt ktSaprolite Measured 9.0 5.5 1.43 1.47 129 80Direct Feed (3) Indicated 5.0 1.7 1.30 1.17 65 20Measured and Indicated 14.0 7.2 1.38 1.40 193 100Inferred (in LOM Plan) 36.6 45.4 1.52 1.51 556 686Inferred (ex. LOM Plan) 13.1 14.8 1.18 1.21 155 179Total Inferred 49.7 60.2 1.43 1.44 710 865Ferruginous Laterite Measured 3.3 2.4 1.28 1.31 42 31Stockpile (4) Indicated 3.8 3.6 1.10 1.09 42 40Measured and Indicated 7.1 6.0 1.19 1.18 85 71Inferred (in LOM Plan) 1.5 – 1.07 – 16 –Inferred (ex. LOM Plan) 0.0 1.5 1.00 1.05 0 16Total Inferred 1.6 1.5 1.07 1.05 17 16Niquelândia (OP) (5) 100 %Ni %NiSaprolite Measured 2.8 2.9 1.25 1.26 35 37Indicated 2.9 3.1 1.23 1.24 35 39Measured and Indicated 5.7 6.0 1.24 1.25 70 75Inferred (in LOM Plan) – – – – – –Inferred (ex. LOM Plan) – – – – – –Total Inferred – – – – – –MINERAL RESOURCES ARE REPORTED AS ADDITIONAL TO ORE RESERVES.Nickel – ProjectsTonnes Grade Contained MetalMINERAL RESOURCES Attributable % Classification <strong>2012</strong> 2011 <strong>2012</strong> 2011 <strong>2012</strong> 2011Jacaré (6) 100 Mt Mt %Ni %Ni kt ktFerruginous Laterite Measured 6.3 6.3 1.15 1.15 72 72Indicated 53.8 53.8 1.21 1.21 653 653Measured and Indicated 60.1 60.1 1.21 1.21 726 726Inferred 125.0 125.0 1.17 1.17 1,468 1,468Saprolite Measured – – – – – –Indicated 39.6 39.6 1.49 1.49 589 589Measured and Indicated 39.6 39.6 1.49 1.49 589 589Inferred 81.9 81.9 1.39 1.39 1,138 1,138Mining method: OP = Open Pit. Mine Life = The extraction period in years for scheduled Ore Reserves comprising Proved and Probable Reserves only.Due to the uncertainty that may be attached to some Inferred Mineral Resources, it cannot be assumed that all or part of an Inferred Mineral Resource will necessarily be upgraded to an Indicated orMeasured Resource after continued exploration.Loma de Níquel is not reported as the mining concessions expired in November <strong>2012</strong> and have not been renewed.(1)Barro Alto – Ore Reserves: The decrease is due to a change in evaluation methodology resulting in re-allocation to Mineral Resources. The decrease is partially offset by increases due to updatedeconomic assumptions and new information enabling conversion of Mineral Resources to Ore Reserves. In 2011 the reported Mine Life considered reserves plus Inferred (in LOM Plan), however, in<strong>2012</strong> correctly considers only the scheduled Ore Reserves.(2)Niquelândia – Ore Reserves: The increase is due to revised economic assumptions which are partially offset by a change in evaluation methodology resulting in re-allocation to Mineral Resources.Niquelândia Mine is adjacent to the Codemin Ferro-Nickel smelter which is fed with ore from Barro Alto which is blended with Niquelândia ore to achieve an appropriate smelter feed chemistry.(3)Barro Alto – Direct Feed: Mineral Resources are quoted above a 0.9 %Ni cut-off, below an iron content of 30 %Fe and between a SiO 2 /(MgO+CaO) ratio of 1.72 to 1.8. The decrease is due todowngrading of Mineral Resources to Mineralised Inventory due to a change in resource classification which is partially offset by the change in evaluation methodology resulting in re-allocation toMineral Resource. A surface stockpile of 5.2 Mt at 1.48 %Ni is included in the Saprolite Mineral Resources.(4)Barro Alto – Stockpile: Material that is scheduled for stockpiling or has already been mined and stockpiled. A surface stockpile of 0.6 Mt at 1.19 %Ni is included in the Ferruginous Laterite MineralResources.(5)Niquelândia – Mineral Resources: Mineral Resources are quoted above a 0.9 %Ni cut-off, below an Iron content of 30% Fe and between a SiO 2 /(MgO+CaO) ratio of 1.72 to 1.8. A change in theeconomic assumptions enabled conversion of Mineral Resources to Ore Reserves which was partially offset by a change in evaluation methodology resulting in re-allocation to Mineral Resources.(6)Jacaré: The Mineral Resources are reported within a pit shell developed for the Concept Study with a cut-off of 1.3 %Ni. A minimum mineralised width of 1m must be present to allow material to becategorised as higher-grade Saprolite Mineral Resource. The Saprolite Resources are a combination of higher-grade resources (>1.3 %Ni) that are expected to feed a pyrometallurgical treatmentfacility and lower-grade resources (1.3 – 0.9 %Ni) that could be used to neutralise the acid in the proposed hydrometallurgical treatment of the Ferruginous Laterite material while still recoveringNickel in the process. The Plano de Aproveitamento Economico (PAE) is under consideration by Brazil’s Departamento Nacional de Produção Mineral (DNPM).Audits related to the generation of the Ore Reserve and Mineral Resource estimates were carried out by independent consultants during <strong>2012</strong> at the following operations:Barro Alto and Niquelândia.Ore Reserves and Mineral Resources<strong>Anglo</strong> <strong>American</strong> plc <strong>Annual</strong> <strong>Report</strong> <strong>2012</strong> 213
ORE RESERVES AND MINERAL RESOURCESPLATINUM GROUP METALSestimates as at 31 December <strong>2012</strong>PLATINUMThe Ore Reserve and Mineral Resource estimates were compiled in compliance with The South African Code for the <strong>Report</strong>ing of Exploration Results,Mineral Resources and Mineral Reserves (The SAMREC Code, 2007 Edition as amended July 2009). Operations and Projects outside South Africa werecompiled in accordance with the Australasian Code for <strong>Report</strong>ing of Exploration Results, Mineral Resources and Ore Reserves (The JORC Code, 2004) as aminimum standard. Details of the individual operations appear in <strong>Anglo</strong> <strong>American</strong> Platinum’s <strong>Annual</strong> <strong>Report</strong>. Merensky Reef and UG2 Reef Mineral Resourcesare reported over an economic and mineable cut appropriate to the specific reef. The figures reported represent 100% of the Mineral Resources and OreReserves attributable to <strong>Anglo</strong> <strong>American</strong> Platinum Limited unless otherwise noted. Rounding of figures may cause computational discrepancies.The Mineral Resource and Ore Reserve tables reflect estimates prior to the strategic announcement in January 2013. Changes associated with the strategicreview will most probably result in a reallocation of reported Ore Reserves to Mineral Resources in the Rustenburg and Union areas and the impact thereof willonly be reflected in the 2013 <strong>Annual</strong> <strong>Report</strong>.<strong>Anglo</strong> <strong>American</strong> plc’s interest in <strong>Anglo</strong> <strong>American</strong> Platinum Limited is 79.9%.Platinum – South Africa Operations Tonnes (1) Grade (2) Contained Metal (3) Contained MetalORE RESERVES Classification <strong>2012</strong> 2011 <strong>2012</strong> 2011 <strong>2012</strong> 2011 <strong>2012</strong> 2011Merensky Reef (4)(5) Mt Mt 4E PGE 4E PGE 4E tonnes 4E tonnes 4E Moz 4E MozProved 59.8 63.9 4.79 5.05 286.5 322.7 9.2 10.4Probable 22.5 49.1 4.49 5.16 100.9 253.4 3.2 8.1Total 82.3 113.0 4.71 5.10 387.4 576.2 12.5 18.5UG2 Reef (4)(6) Proved 389.8 390.7 4.05 4.10 1,578.7 1,600.7 50.8 51.5Probable 128.6 250.0 4.46 4.78 573.6 1,194.1 18.4 38.4Total 518.4 640.7 4.15 4.36 2,152.3 2,794.8 69.2 89.9Platreef (7) Proved 587.5 538.8 2.75 2.84 1,617.3 1,532.3 52.0 49.3Proved primary ore stockpile (8) 26.7 20.0 1.72 1.71 46.0 34.3 1.5 1.1Probable 394.6 166.5 2.81 3.24 1,108.2 539.9 35.6 17.4Total 1,008.9 725.4 2.75 2.90 2,771.5 2,106.6 89.1 67.7All Reefs Proved 1,063.9 1,013.4 3.32 3.44 3,528.5 3,490.1 113.4 112.2Probable 545.7 465.7 3.27 4.27 1,782.7 1,987.4 57.3 63.9Total (9) 1,609.6 1,479.1 3.30 3.70 5,311.2 5,477.5 170.8 176.1Tailings (10) Proved – – – – – – – –Probable 15.9 18.9 1.02 0.86 16.1 16.2 0.5 0.5Total 15.9 18.9 1.02 0.86 16.1 16.2 0.5 0.5Platinum – Zimbabwe Operations Tonnes (1) Grade (2) Contained Metal (3) Contained MetalORE RESERVES Classification <strong>2012</strong> 2011 <strong>2012</strong> 2011 <strong>2012</strong> 2011 <strong>2012</strong> 2011Main Sulphide Zone (11) (12) (13) Mt Mt 4E PGE 4E PGE 4E tonnes 4E tonnes 4E Moz 4E MozProved 13.9 15.0 3.85 3.68 53.4 55.2 1.7 1.8Probable 39.8 23.7 3.73 3.85 148.5 91.2 4.8 2.9Total 53.7 38.7 3.76 3.79 201.9 146.5 6.5 4.7(1)Tonnes: Quoted as dry metric tonnes.(2)Grade: 4E PGE is the sum of Platinum, Palladium, Rhodium and Gold grades in grammes per tonne (g/t). The reported grades are as delivered for treatment.Concentrator recoveries for Merensky Reef range from 84% to 89%, UG2 Reef from 82% to 87%, Platreef from 64% to 74% and Main Sulphide Zone from 70% to 78%.(3)Contained Metal: Contained Metal is presented in metric tonnes and million troy ounces (Moz).(4)Merensky Reef and UG2 Reef: The pay limits built into the basic mining equation are directly linked to the 2013 Business plan prior to the strategic review announcement made in January 2013. Thepay limit is based on Cost 4, which consists of ‘Direct Cash Cost’ (on and off mine), ‘Other Indirect Costs’ and ‘Stay in Business Capital’ (on and off mine). The reserve pay-limit varies across alloperations between 2.0g/t and 5.6g/t (4E PGE). The range is a function of various factors including depth of the ore body, geological complexity, infrastructure and economic parameters.(5)Merensky Reef: The global Ore Reserve tonnage and 4E ounce content decreased, mainly in response to economic assumptions resulting in reallocation of Ore Reserves to Mineral Resources atTumela Mine and Siphumelele 1 Mine. These decreases were partially offset by the increase in Ore Reserves mainly from Khuseleka Mine and Union South Mine where additional Mineral Resourceshave been converted to Ore Reserves. The global Ore Reserve grade decreased following the increase of the minimum resource cut from 90cm to 110cm due to improved rock support measures.(6)UG2 Reef: The global Ore Reserve tonnage and 4E ounce content decreased largely due to economic assumptions and the resulting reallocation of Ore Reserves to Mineral Resources at TumelaMine, Twickenham Mine and Siphumelele 2 Mine. These decreases were partially offset by the increase in Ore Reserves from Union South Mine, Siphumelele 1 Mine, Kroondal Mine, Marikana Mineand Modikwa Mine where Mineral Resources have been converted to Ore Reserves. The global Ore Reserve grade decreased following the increase of the minimum resource cut from 90cm to 110cmdue to an improved rock support measures.(7)Platreef: The Ore Reserves tonnage and 4E ounce content increased as a result of a revised pit design. Geotechnical study will commence in 2013 to validate the optimum pit design and increasedmining depth. For Mogalakwena North, Central and South the 4E pay limit is 1.0 g/t. For Sandsloot and Zwartfontein South the pay limit is 1.7 g/t.(8)Platreef stockpiles: Mined ore retained for future treatment. These are reported separately as Proved Ore Reserves and aggregated into the summation tabulations.(9)Alternative units – All Reefs Total: Tonnage in million short tons (Mton) and associated grade in troy ounces per short ton (oz/ton) for <strong>2012</strong> is:Total – 1,774.3 Mton (2011: 1,630.4 Mton)Total – 0.096 oz/ton (2011: 0.108 oz/ton)(10)Tailings: Operating tailings dams are not evaluated and therefore not reported as part of the Ore Reserves. At Rustenburg mines and at Union mines dormant tailings dams have been evaluated andare separately reported as tailings Ore Reserves.(11)Main Sulphide Zone: The Ore Reserve tonnage and 4E ounce content increased after the conversion of Mineral Resources to Ore Reserves, which followed an increase in resource confidence basedon new drilling information.(12)Main Sulphide Zone: <strong>Anglo</strong> <strong>American</strong> Platinum currently has an effective 100% interest in Unki Mine, subject to the finalisation of the indigenisation agreement.(13)Alternative units – Main Sulphide Zone: Tonnage in million short tons (Mton) and associated grade in troy ounces per short ton (oz/ton) for <strong>2012</strong> is:Total – 59.2 Mton (2011: 42.6 Mton)Total – 0.110 oz/ton (2011: 0.110 oz/ton)(3)(3)214 <strong>Anglo</strong> <strong>American</strong> plc <strong>Annual</strong> <strong>Report</strong> <strong>2012</strong>
ORE RESERVES AND MINERAL RESOURCESPLATINUM GROUP METALSestimates as at 31 December <strong>2012</strong>Platinum – South Africa Operations Tonnes (1) Grade (2) Contained Metal (3) Contained MetalMINERAL RESOURCES Classification <strong>2012</strong> 2011 <strong>2012</strong> 2011 <strong>2012</strong> 2011 <strong>2012</strong> 2011Merensky Reef (4)(5) Mt Mt 4E PGE 4E PGE 4E tonnes 4E tonnes 4E Moz 4E MozMeasured 189.3 162.1 5.63 5.57 1,065.1 903.7 34.2 29.1Indicated 290.6 273.5 5.51 5.54 1,600.1 1,515.4 51.4 48.7Measured and Indicated 479.9 435.6 5.55 5.55 2,665.2 2,419.1 85.7 77.8Inferred (in LOM Plan) 9.8 22.7 6.33 8.05 62.1 182.7 2.0 5.9Inferred (ex. LOM Plan) 563.8 547.1 5.11 5.08 2,879.5 2,778.8 92.6 89.3Total Inferred 573.6 569.8 5.13 5.20 2,941.6 2,961.5 94.6 95.2UG2 Reef (4)(6) Measured 475.2 391.9 5.14 5.33 2,441.0 2,090.5 78.5 67.2Indicated 656.4 547.2 5.13 5.21 3,367.8 2,849.6 108.3 91.6Measured and Indicated 1,131.6 939.1 5.13 5.26 5,808.8 4,940.1 186.8 158.8Inferred (in LOM Plan) 7.3 9.0 5.23 4.97 38.3 44.9 1.2 1.4Inferred (ex. LOM Plan) 604.8 660.1 5.36 5.23 3,239.5 3,449.4 104.2 110.9Total Inferred 612.1 669.1 5.35 5.22 3,277.8 3,494.3 105.4 112.3Platreef (7) Measured 151.2 219.1 2.59 2.38 391.3 522.0 12.6 16.8Indicated 740.7 980.9 2.11 2.20 1,560.9 2,158.3 50.2 69.4Measured and Indicated 891.8 1,199.9 2.19 2.23 1,952.2 2,680.3 62.8 86.2Inferred (in LOM Plan) 25.8 10.0 4.05 4.15 104.5 41.3 3.4 1.3Inferred (ex. LOM Plan) 1,560.5 1,575.5 2.10 2.12 3,284.1 3,344.8 105.6 107.5Total Inferred 1,586.3 1,585.5 2.14 2.14 3,388.6 3,386.0 108.9 108.9All Reefs Measured 815.7 773.1 4.78 4.55 3,897.4 3,516.2 125.3 113.0Indicated 1,687.7 1,801.5 3.87 3.62 6,528.8 6,523.3 209.9 209.7Measured and Indicated (8) 2,503.4 2,574.7 4.16 3.90 10,426.2 10,039.5 335.2 322.8Inferred (in LOM Plan) 43.0 41.7 4.77 6.45 204.9 268.9 6.6 8.6Inferred (ex. LOM Plan) 2,729.1 2,782.7 3.45 3.44 9,403.1 9,572.9 302.3 307.8Total Inferred 2,772.1 2,824.4 3.47 3.48 9,608.0 9,841.8 308.9 316.4Tailings (9) Measured 87.6 87.6 1.08 1.08 94.3 94.3 3.0 3.0Indicated 15.1 17.9 1.13 1.13 17.0 20.2 0.5 0.6Measured and Indicated 102.7 105.5 1.08 1.09 111.3 114.5 3.6 3.7Inferred (in LOM Plan) – – – – – – – –Inferred (ex. LOM Plan) – – – – – – – –Total Inferred – – – – – – – –MINERAL RESOURCES ARE REPORTED AS ADDITIONAL TO ORE RESERVES.(3)Platinum – Zimbabwe Operations Tonnes (1) Grade (2) Contained Metal (3) (3)Contained MetalMINERAL RESOURCES Classification <strong>2012</strong> 2011 <strong>2012</strong> 2011 <strong>2012</strong> 2011 <strong>2012</strong> 2011Main Sulphide Zone (10) (11) (12) Mt Mt 4E PGE 4E PGE 4E tonnes 4E tonnes 4E Moz 4E MozMeasured 9.5 8.7 4.04 4.15 38.5 36.0 1.2 1.2Indicated 104.1 21.2 4.23 4.13 439.7 87.5 14.1 2.8Measured and Indicated 113.6 29.8 4.21 4.14 478.2 123.5 15.4 4.0Inferred (in LOM Plan) 0.3 14.2 3.32 4.19 1.0 59.5 0.0 1.9Inferred (ex. LOM Plan) 72.3 35.5 4.58 4.09 330.8 144.9 10.6 4.7Total Inferred 72.6 49.6 4.57 4.12 331.8 204.4 10.7 6.6MINERAL RESOURCES ARE REPORTED AS ADDITIONAL TO ORE RESERVES.Due to the uncertainty that may be attached to some Inferred Mineral Resources, it cannot be assumed that all or part of an Inferred Mineral Resource will necessarily be upgraded to an Indicated orMeasured Resource after continued exploration.(1)Tonnes: Quoted as dry metric tonnes.(2)Grade: 4E PGE is the sum of Platinum, Palladium, Rhodium and Gold grades in grammes per tonne (g/t).(3)Contained Metal: Contained Metal is presented in metric tonnes and million troy ounces (Moz).(4)Merensky Reef and UG2 Reef: The Mineral Resources are estimated over a practical minimum mining width suitable for the deposit known as the ‘Resource Cut’. The minimum resource cutincreased from 90cm to 110cm due to the introduction of an improved support system. As a result of the increased minimum resource cut the overall Merensky Reef and UG2 Reef tonnage increasedand the overall grade decreased. The ‘Resource Cut’ width takes cognisance of the mining method and geotechnical aspects in the hanging wall or footwall of the reef.(5)Merensky Reef: The Mineral Resource tonnage and 4E ounce content increased in response to the re-allocation of Ore Reserve back to Mineral Resources following economic assumptions atTumela and Siphumelele mines. The increase in the minimum mining cut (change in mine layout) and new information contribute to the increase.(6)UG2 Reef: The Mineral Resource tonnage and 4E ounce content increased due to re-allocation of Ore Reserve to Mineral Resources after application of revised economic assumptions at Tumela,Twickenham and Siphumelele mines. New information at Pandora Mine decreased the geological loss resulting in increased Mineral Resources. A decrease of Mineral Resource occurred at UnionSouth mine where additional Mineral Resources were converted to Ore Reserves.(7)Platreef: A 1.0g/t (4E PGE) cut-off has been used to define Mineral Resources. During <strong>2012</strong> pit design test work confirmed that Mineral Resources reported in 2011 can be mined via open pit.Additional Mineral Resources were converted to Ore Reserves, decreasing the Platreef Resources. No Mineral Resources applicable to underground mining have been included. However, stockpilematerial is included which comprises calc-silicate and oxidised material with a cut-off grade of greater than 3g/t (5.5 Mt / 0.6 Moz).(8)Alternative units – All Reefs Measured and Indicated: Tonnage in million short tons (Mton) and associated grade in troy ounces per short ton (oz/ton) for <strong>2012</strong> is:Measured and Indicated – 2759.5 Mton (2011: 2,838.1 Mton)Measured and Indicated – 0.121 oz/ton (2011: 0.114 oz/ton)(9)Tailings: Operating tailings dams are not evaluated and therefore not reported as part of the Mineral Resources. At Rustenburg and Union mines dormant dams have been evaluated and the tailingforms part of the Mineral Resource statement.(10)Main Sulphide Zone: A new resource evaluation was completed covering Unki South, Helvetia, Paarl, KV and SR projects (contained within the special mining lease held by Southridge Limited). Allprojects are now incorporated in the Mineral Resources. As a consequence the Mineral Resources tonnage and 4E ounce content increased significantly.The bulk of the resources have been evaluated using a 120cm resource cut. Unki East and West have been evaluated on a 180cm resource cut to support trackless mining. The increase in tonnage andcontent is offset by the decrease of Mineral Resource due to additional conversion of Mineral Resources to Ore Reserves at the Unki East Mine. Oxidised material is not considered.(11)Main Sulphide Zone: <strong>Anglo</strong> <strong>American</strong> Platinum currently has an effective 100% interest in Southridge Limited, subject to the finalisation of the indigenisation agreement.(12)Alternative units – Main Sulphide Zone Measured and Indicated: Tonnage in million short tons (Mton) and associated grade in troy ounces per short ton (oz/ton) for <strong>2012</strong> is:Total – 205.3 Mton (2011: 87.6 Mton)Total – 0.127 oz/ton (2011: 0.120 oz/ton)Ore Reserves and Mineral Resources<strong>Anglo</strong> <strong>American</strong> plc <strong>Annual</strong> <strong>Report</strong> <strong>2012</strong> 215
ORE RESERVES AND MINERAL RESOURCESPLATINUM GROUP METALSestimates as at 31 December <strong>2012</strong>Platinum – Other ProjectsTonnes (1) Grade (2) Contained Metal (3) Contained MetalMINERAL RESOURCESClassification <strong>2012</strong> 2011 <strong>2012</strong> 2011 <strong>2012</strong> 2011 <strong>2012</strong> 2011South Africa Mt Mt 3E PGE 3E PGE 3E tonnes 3E tonnes 3E Moz 3E MozBoikgantsho (4) Measured – – – – – – – –Platreef Indicated 37.0 37.0 1.30 1.30 47.9 47.9 1.5 1.5Measured and Indicated 37.0 37.0 1.30 1.30 47.9 47.9 1.5 1.5Inferred 1.8 1.8 1.14 1.14 2.1 2.1 0.1 0.13E PGE3E PGESheba’s Ridge (5) Measured 28.0 28.0 0.88 0.88 24.6 24.6 0.8 0.8Indicated 34.0 34.0 0.85 0.85 29.1 29.1 0.9 0.9Measured and Indicated 62.0 62.0 0.87 0.87 53.6 53.6 1.7 1.7Inferred 149.9 149.9 0.96 0.96 144.5 144.5 4.6 4.6Brazil 3E PGE 3E PGEPedra Branca (6) Inferred 6.6 6.6 2.27 2.27 15.0 15.0 0.5 0.5Due to the uncertainty that may be attached to some Inferred Mineral Resources, it cannot be assumed that all or part of an Inferred Mineral Resource will necessarily be upgraded to an Indicated orMeasured Resource after continued exploration.(1)Tonnes: Quoted as dry metric tonnes.(2)Grade: 3E PGE is the sum of Platinum, Palladium and Gold grades in grammes per tonne (g/t).(3)Contained Metal: Contained Metal is presented in metric tonnes and million troy ounces (Moz).(4)Boikgantsho: <strong>Anglo</strong> <strong>American</strong> Platinum holds an attributable interest of 49% of the Joint Venture between <strong>Anglo</strong> <strong>American</strong> Platinum and Atlatsa Resources. A cut-off grade of 1g/t (3E PGE) isapplied for resource definition.(5)Sheba’s Ridge: <strong>Anglo</strong> <strong>American</strong> Platinum holds an attributable interest of 35% of the Joint Venture between <strong>Anglo</strong> <strong>American</strong> Platinum, Aquarius Platinum and the South African IndustrialDevelopment Corporation (IDC). A cut-off grade of 0.5g/t (3E PGE) is applied for resource definition.(6)Pedra Branca: <strong>Anglo</strong> <strong>American</strong> Platinum holds an attributable interest of 51% of the Joint Venture between <strong>Anglo</strong> <strong>American</strong> Platinum and Solitario Resources & Royalty. A cut-off of 0.7g/t (3E PGE) isapplied for resource definition.The following operations and projects contributed to the combined <strong>2012</strong> Ore Reserve and Mineral Resource estimates stated per reef (excluding Other Projects):Operations: Resource Types % Mine LifeBafokeng Rasimone Platinum Mine (BRPM) MR/UG2 33% 24Bathopele Mine UG2 100% 14Bokoni Platinum Mine MR/UG2 49% 30Dishaba Mine MR/UG2 100% 30Khomanani Mine MR/UG2 100% 15Khuseleka Mine MR/UG2 100% 24Kroondal Platinum Mine UG2 50% 6Marikana Platinum Mine UG2 50% 6Modikwa Platinum Mine MR/UG2 50% 29Mogalakwena Mine PR 100% 30Mototolo Platinum Mine UG2 50% 5*Pandora UG2 42.5% 26Siphumelele 1 Mine MR/UG2 100% 18Siphumelele 2 Mine (School of Mines) MR/UG2 100% 3Thembelani Mine MR/UG2 100% 25Tumela Mine MR/UG2 100% 22Twickenham Platinum Mine MR/UG2 100% 30Union North Mine MR/UG2 85% 18Union South Mine MR/UG2 85% 22Unki Mine MSZ 100% 30Projects: %Der Brochen Project MR/UG2 100%Ga-Phasha PGM Project MR/UG2 49%Magazynskraal Project MR/UG2 20%Other Exploration Projects (portions of Driekop/Rustenburg) MR/UG2 37.5% to 100%Rustenburg – Non-Mine Projects MR/UG2 100%MR = Merensky Reef, UG2 = UG2 Reef, PR = Platreef, MSZ = Main Sulphide Zone;% = <strong>Anglo</strong> <strong>American</strong> Platinum Limited attributable interest;Mine Life = The extraction period in years for scheduled Ore Reserves comprising Proved and Probable Reserves only considering the combined MR and UG2 production where applicable;* Only 5 years of Ore Reserves are declared as per Xstrata policy.Information was provided by the Joint Venture partners for the following operations and projects:Operations – BRPM, Bokoni, Kroondal, Marikana, Modikwa, Mototolo, Pandora (only Ore Reserve information for BRPM and Modikwa)3E Projects – Pedra Branca, Sheba’s Ridge4E Projects – Ga-Phasha, MagazynskraalAudits related to the generation of the Ore Reserve and Mineral Resource estimates were carried out by independent consultants during <strong>2012</strong> at the following operations:Dishaba, Mogalakwena, Tumela, Union North, Union South and Unki.(3)216 <strong>Anglo</strong> <strong>American</strong> plc <strong>Annual</strong> <strong>Report</strong> <strong>2012</strong>
ORE RESERVES AND MINERAL RESOURCESDIAMONDSestimates as at 31 December <strong>2012</strong>DE BEERS CANADAThe Diamond Reserve and Diamond Resource estimates were compiled in accordance with Canadian National Instrument 43-101 – Standards of Disclosurefor Mineral Projects (NI 43-101). The figures reported represent 100% of the Diamond Reserves and Diamond Resources. Diamond Resources are quoted asinclusive of those used to calculate Diamond Reserves and must not be added to the Diamond Reserves. Rounding of figures may cause computationaldiscrepancies.De Beers Canada – OperationsBCOTonnes Grade Saleable CaratsDIAMOND RESERVES Attributable % LOM (mm) Classification <strong>2012</strong> 2011 <strong>2012</strong> 2011 <strong>2012</strong> 2011Snap Lake (UG) (1) 85.0 18 1.14 Mt Mt cpht cpht M¢ M¢Kimberlite Proved – – – – – –Probable 1.6 – 123.07 – 2.0 –Total 1.6 – 123.07 – 2.0 –Victor (OP) 85.0 6 1.50 cpht cphtKimberlite Proved – – – – – –Probable 12.1 – 19.42 – 2.3 –Total 12.1 – 19.42 – 2.3 –De Beers Canada Inc. 85.0 multiple cpht cphtTOTAL Proved – – – – – –Probable 13.7 – 31.68 – 4.3 –Total 13.7 – 31.68 – 4.3 –De Beers Canada – OperationsBCOTonnes Grade CaratsDIAMOND RESOURCES Attributable % (mm) Classification <strong>2012</strong> 2011 <strong>2012</strong> 2011 <strong>2012</strong> 2011Snap Lake (UG) (1) 85.0 1.14 Mt Mt cpht cpht M¢ M¢Kimberlite Measured – – – – – –Indicated 2.5 – 189.27 – 4.7 –Measured and Indicated 2.5 – 189.27 – 4.7 –Inferred 23.1 – 176.54 – 40.9 –Victor (OP) 85.0 1.50 cpht cphtKimberlite Measured – – – – – –Indicated 12.9 – 19.34 – 2.5 –Measured and Indicated 12.9 – 19.34 – 2.5 –Inferred 17.9 – 22.17 – 4.0 –De Beers Canada Inc. 85.0 multiple cpht cphtTOTAL Measured – – – – – –Indicated 15.4 – 46.87 – 7.2 –Measured and Indicated 15.4 – 46.87 – 7.2 –Inferred 41.1 – 109.16 – 44.8 –DIAMOND RESOURCES INCLUDE DIAMOND RESERVESDe Beers Canada – ProjectsBCOTonnes Grade Saleable CaratsDIAMOND RESERVES Attributable % LOM (mm) Classification <strong>2012</strong> 2011 <strong>2012</strong> 2011 <strong>2012</strong> 2011Gahcho Kué (OP) (2) 43.4 11 1.00 Mt Mt cpht cpht M¢ M¢Kimberlite Proved – – – – – –Probable 31.0 – 153.71 – 47.6 –Total 31.0 – 153.71 – 47.6 –De Beers Canada – ProjectsBCOTonnes Grade CaratsDIAMOND RESOURCES Attributable % (mm) Classification <strong>2012</strong> 2011 <strong>2012</strong> 2011 <strong>2012</strong> 2011Gahcho Kué (OP) (2) 43.4 1.00 Mt Mt cpht cpht M¢ M¢Kimberlite Measured – – – – – –Indicated 30.2 – 163.87 – 49.6 –Measured and Indicated 30.2 – 163.87 – 49.6 –Inferred 6.0 – 168.86 – 10.1 –DIAMOND RESOURCES INCLUDE DIAMOND RESERVESMining method: OP = Open Pit, UG = Underground.LOM = Life of Mine (years) is based on scheduled Probable Reserves including Indicated and some Inferred Resources considered for Life of Mine planning.Unless stated otherwise tonnage is quoted as dry metric tonnes. Estimates of Diamond Reserve tonnes reflect the tonnage to be treated.<strong>Report</strong>ed Diamond Reserves/Resources are based on a Bottom Cut Off (BCO) which refers to the bottom screen size aperture and varies between 1.00mm and 3.00mm (nominal square mesh).Grade is quoted as carats per hundred metric tonnes (cpht).Due to the uncertainty that may be attached to some Inferred Mineral Resources, it cannot be assumed that all or part of an Inferred Mineral Resource will necessarily be upgraded to an Indicatedor Measured Resource after continued exploration.(1)Snap Lake: Due to the high costs associated with resource development, Indicated Resources are continuously developed from underground infrastructure ahead of the mining face, resulting in an18 month rolling reserve.(2)Gahcho Kué: The project approval is subject to the successful conclusion of permitting and regulatory approvals. Gahcho Kué is a Joint Venture between De Beers Canada Inc. and MountainProvince Diamonds Inc.Ore Reserves and Mineral ResourcesAudits related to the generation of the Ore Reserve and Mineral Resource estimates were carried out by independent consultants during <strong>2012</strong> at the following operations:Snap Lake and Victor.<strong>Anglo</strong> <strong>American</strong> plc <strong>Annual</strong> <strong>Report</strong> <strong>2012</strong> 217
ORE RESERVES AND MINERAL RESOURCESDIAMONDSestimates as at 31 December <strong>2012</strong>DE BEERS CONSOLIDATED MINESThe Diamond Reserve and Diamond Resource estimates were compiled in accordance with The South African Code for the <strong>Report</strong>ing of Exploration Results,Mineral Resources and Mineral Reserves (The SAMREC Code, 2007 Edition as amended July 2009). The figures reported represent 100% of the DiamondReserves and Diamond Resources. Diamond Resources are quoted as inclusive of those used to calculate Diamond Reserves and must not be added to theDiamond Reserves. Rounding of figures may cause computational discrepancies. De Beers Consolidated Mines is a Joint Venture with Ponahalo Investments(Pty) Ltd.De Beers Consolidated Mines – OperationsBCOTonnes Grade Saleable CaratsDIAMOND RESERVES Attributable % LOM (mm) Classification <strong>2012</strong> 2011 <strong>2012</strong> 2011 <strong>2012</strong> 2011Venetia (OP) 62.9 9 1.00 Mt Mt cpht cpht M¢ M¢Kimberlite Proved – – – – – –Probable 33.6 – 97.50 – 32.8 –Total 33.6 – 97.50 – 32.8 –Venetia (UG) (1) 62.9 27 1.00 cpht cphtKimberlite Proved – – – – – –Probable 91.4 – 76.53 – 70.0 –Total 91.4 – 76.53 – 70.0 –De Beers Consolidated Mines 62.9 1.00 cpht cphtTOTAL Proved – – – – – –Probable 125.0 – 82.17 – 102.7 –Total 125.0 – 82.17 – 102.7 –De Beers Consolidated Mines – OperationsBCOTonnes Grade CaratsDIAMOND RESOURCES Attributable % (mm) Classification <strong>2012</strong> 2011 <strong>2012</strong> 2011 <strong>2012</strong> 2011Kimberley (OC) (2) 62.9 1.15 Mt Mt cpht cpht M¢ M¢Tailings Measured – – – – – –Indicated – – – – – –Measured and Indicated – – – – – –Inferred 38.2 – 12.16 – 4.7 –Namaqualand (OC) ( 3) 62.9 multiple ( 3) cpht cphtBeach and Fluvial Placers Measured – – – – – –Indicated 19.3 – 10.87 – 2.1 –Measured and Indicated 19.3 – 10.87 – 2.1 –Inferred 70.8 – 4.79 – 3.4 –Venetia (OP) (4) 62.9 1.00 cpht cphtKimberlite Measured – – – – – –Indicated 34.2 – 103.46 – 35.4 –Measured and Indicated 34.2 – 103.46 – 35.4 –Inferred 29.6 – 18.12 – 5.4 –Venetia (UG) 62.9 1.00 cpht cphtKimberlite Measured – – – – – –Indicated 109.9 – 86.93 – 95.5 –Measured and Indicated 109.9 – 86.93 – 95.5 –Inferred 70.1 – 88.10 – 61.8 –Voorspoed (OP) (5) 62.9 1.47 cpht cphtKimberlite Measured – – – – – –Indicated – – – – – –Measured and Indicated – – – – – –Inferred 37.9 – 21.58 – 8.2 –De Beers Consolidated Mines 62.9 multiple cpht cphtTOTAL Measured – – – – – –Indicated 163.3 – 81.40 – 133.0 –Measured and Indicated 163.3 – 81.40 – 133.0 –Inferred 246.7 – 33.79 – 83.4 –DIAMOND RESOURCES INCLUDE DIAMOND RESERVESMining method: OP = Open Pit, UG = Underground.LOM = Life of Mine (years) is based on scheduled Probable Reserves including Indicated and some Inferred Resources considered for Life of Mine planning.Unless stated otherwise tonnage is quoted as dry metric tonnes. Estimates of Diamond Reserve tonnes reflect the tonnage to be treated.<strong>Report</strong>ed Diamond Reserves/Resources are based on a Bottom Cut Off (BCO) which refers to the bottom screen size aperture and varies between 1.00mm and 3.00mm (nominal square mesh).Grade is quoted as carats per hundred metric tonnes (cpht).Due to the uncertainty that may be attached to some Inferred Mineral Resources, it cannot be assumed that all or part of an Inferred Mineral Resource will necessarily be upgraded to an Indicatedor Measured Resource after continued exploration.(1)Venetia (UG): The LOM is stated as 27 years which reflects the extent of the current Mining Right at Venetia.(2)Kimberley: Kimberley Mines Central Treatment Plant (CTP) was initially established to treat ore from both tailings resources and underground mines. Subsequent to the conclusion of the saleof the underground operations to Petra Diamonds in May 2010, only tailings resources from various locations are being treated.(3)Namaqualand: Bottom screen cut off details for Indicated and Inferred Resource estimates are as follows:1.00 mm BCO: Indicated: 5.3 Mt, 20.86 cpht, 1.1 M¢; Inferred: 28.7 Mt, 7.56 cpht, 2.2 M¢;1.15 mm BCO: Indicated: 13.9 Mt, 7.04 cpht, 1.0 M¢; Inferred: 41.6 Mt, 2.26 cpht, 0.9 M¢1.47 mm BCO: Indicated: 0.2 Mt, 13.03 cpht, 20 k¢. Inferred: 0.5 Mt, 60.22 cpht, 0.3 M¢.The sale of the Namaqualand Mines to the Trans Hex Group is in progress and expected to conclude in 2013.(4)Venetia (OP): The Old Recovery Tailings Inferred Resource estimate at 1.00mm BCO, consisting of 0.1 Mt, 3844.62 cpht, 2.5 M¢ is excluded from the table.(5)Voorspoed: The Mining License was approved on 10 October 2006 and construction commenced in the same month after the mine being dormant for 9 decades. Mining is entirely based onInferred Resources due to the uncertainty associated with current geoscientific knowledge. Studies are in progress to improve resource confidence and upgrade some Inferred Resources toIndicated Resources.Audits related to the generation of the Ore Reserve and Mineral Resource estimates were carried out by independent consultants during <strong>2012</strong> at the following operations:Venetia (OP) and Voorspoed.218 <strong>Anglo</strong> <strong>American</strong> plc <strong>Annual</strong> <strong>Report</strong> <strong>2012</strong>
ORE RESERVES AND MINERAL RESOURCESDIAMONDSestimates as at 31 December <strong>2012</strong>DEBSWANA DIAMOND COMPANYThe Diamond Reserve and Diamond Resource estimates were compiled in accordance with The South African Code for the <strong>Report</strong>ing of Exploration Results,Mineral Resources and Mineral Reserves (The SAMREC Code, 2007 Edition as amended July 2009). The figures reported represent 100% of the DiamondReserves and Diamond Resources. Diamond Resources are quoted as inclusive of those used to calculate Diamond Reserves and must not be added to theDiamond Reserves. Rounding of figures may cause computational discrepancies. Debswana Diamond Company is a Joint Venture with the government of theRepublic of Botswana.Debswana – OperationsBCOTonnes Grade Saleable CaratsDIAMOND RESERVES Attributable % LOM (mm) Classification <strong>2012</strong> 2011 <strong>2012</strong> 2011 <strong>2012</strong> 2011Damtshaa (OP) (1) 42.5 17 1.65 Mt Mt cpht cpht M¢ M¢Kimberlite Proved – – – – – –Probable 25.0 – 16.60 – 4.1 –Total 25.0 – 16.60 – 4.1 –Jwaneng (OP) 42.5 20 1.47 cpht cphtKimberlite Proved – – – – – –Probable 70.1 – 126.05 – 88.3 –Total 70.1 – 126.05 – 88.3 –Letlhakane (OP) 42.5 4 1.65 cpht cphtKimberlite Proved – – – – – –Probable 4.7 – 16.93 – 0.8 –Total 4.7 – 16.93 – 0.8 –Orapa (OP) 42.5 21 1.65 cpht cphtKimberlite Proved – – – – – –Probable 146.1 – 58.69 – 85.7 –Total 146.1 – 58.69 – 85.7 –Debswana Diamond Company 42.5 multiple cpht cphtTOTAL Proved – – – – – –Probable 245.8 – 72.81 – 179.0 –Total 245.8 – 72.81 – 179.0 –Debswana – OperationsBCOTonnes Grade CaratsDIAMOND RESOURCES Attributable % (mm) Classification <strong>2012</strong> 2011 <strong>2012</strong> 2011 <strong>2012</strong> 2011Damtshaa (OP) (1) 42.5 1.65 Mt Mt cpht cpht M¢ M¢Kimberlite Measured – – – – – –Indicated 29.3 – 21.46 – 6.3 –Measured and Indicated 29.3 – 21.46 – 6.3 –Inferred 20.5 – 23.60 – 4.8 –Jwaneng (OP) (2) 42.5 1.47 cpht cphtKimberlite Measured – – – – – –Indicated 70.1 – 120.35 – 84.3 –Measured and Indicated 70.1 – 120.35 – 84.3 –Inferred 259.9 – 103.55 – 269.1 –Letlhakane (OP) (3) 42.5 1.65 cpht cphtKimberlite Measured – – – – – –Indicated 27.4 – 28.62 – 7.8 –Measured and Indicated 27.4 – 28.62 – 7.8 –Inferred 8.3 – 27.17 – 2.2 –Orapa (OP) (4) 42.5 1.65 cpht cphtKimberlite Measured – – – – – –Indicated 167.3 – 71.20 – 119.1 –Measured and Indicated 167.3 – 71.20 – 119.1 –Inferred 349.8 – 72.48 – 253.5 –Debswana Diamond Company 42.5 multiple cpht cphtTOTAL Measured – – – – – –Indicated 294.1 – 74.00 – 217.6 –Measured and Indicated 294.1 – 74.00 – 217.6 –Inferred 638.5 – 82.97 – 529.7 –DIAMOND RESOURCES INCLUDE DIAMOND RESERVESMining method: OP = Open Pit, UG = Underground.LOM = Life of Mine (years) is based on scheduled Probable Reserves including Indicated and some Inferred Resources considered for Life of Mine planning.Unless stated otherwise tonnage is quoted as dry metric tonnes. Estimates of Diamond Reserve tonnes reflect the tonnage to be treated.<strong>Report</strong>ed Diamond Reserves/Resources are based on a Bottom Cut Off (BCO) which refers to the bottom screen size aperture and varies between 1.00mm and 3.00mm (nominal square mesh).Grade is quoted as carats per hundred metric tonnes (cpht).Due to the uncertainty that may be attached to some Inferred Mineral Resources, it cannot be assumed that all or part of an Inferred Mineral Resource will necessarily be upgraded to an Indicatedor Measured Resource after continued exploration.Ore Reserves and Mineral Resources(1)Damtshaa: Higher grade Inferred Resources from the B/K 12 Kimberlite is mined for the first five years before including Probable Reserves from BK/9. The B/K 9 and B/K 12 Stockpile InferredResource estimates at 1.65mm BCO consisting of 2.0 Mt, 13.10 cpht, 0.3 M¢, are excluded from the table.(2)Jwaneng: The Jwaneng Resource Extension Project scheduled to conclude in 2014 is expected to increase the resource confidence at depth and upgrade a significant portion of Inferred Resourcesto Indicated. The D/K2 Stockpile Inferred Mineral Resource estimates at 1.47mm BCO, consisting of 8.5 Mt, 46.74 cpht, 4.0 M¢ as well as the Tailings Inferred Mineral Resource estimates at 1.47mmBCO, consisting of 36.9 Mt, 45.90 cpht, 17.0 M¢, are excluded from the table.(3)Letlhakane: Mining studies are underway to investigate the conversion of resources to reserves at depth. D/K1 and DK/2 Stockpile Inferred Resource estimates at 1.65mm BCO, consisting of 4.2 Mt,18.34 cpht, 0.8 M¢ as well as the Tailings Inferred Mineral Resource estimates at 1.72mm BCO, consisting of 77.7 Mt, 16.00 cpht, 12.4 M¢, are excluded from the table.(4)Orapa: The A/K1 Stockpile Inferred Resource estimates at 1.65mm BCO, consisting of 12.4 Mt, 45.39 cpht, 5.6 M¢ as well as the Tailings Inferred Mineral Resource estimates at 1.47mm BCO,consisting of 155.4 Mt, 52.83 cpht, 82.1 M¢, are excluded from the table.Audits related to the generation of the Ore Reserve and Mineral Resource estimates were carried out by independent consultants during <strong>2012</strong> at the following operations:Jwaneng and Orapa.<strong>Anglo</strong> <strong>American</strong> plc <strong>Annual</strong> <strong>Report</strong> <strong>2012</strong> 219
ORE RESERVES AND MINERAL RESOURCESDIAMONDSestimates as at 31 December <strong>2012</strong>NAMDEB HOLDINGSThe Diamond Reserve and Diamond Resource estimates were compiled in accordance with The South African Code for the <strong>Report</strong>ing of Exploration Results,Mineral Resources and Mineral Reserves (The SAMREC Code, 2007 Edition as amended July 2009). The figures reported represent 100% of the DiamondReserves and Diamond Resources. Diamond Resources are quoted as inclusive of those used to calculate Diamond Reserves and must not be added to theDiamond Reserves. Rounding of figures may cause computational discrepancies. Namdeb Holdings is a Joint Venture with the government of the Republicof Namibia.Namdeb Holdings – Operations (Terrestrial)BCOTonnes Grade Saleable CaratsDIAMOND RESERVES Attributable % LOM (mm) Classification <strong>2012</strong> 2011 <strong>2012</strong> 2011 <strong>2012</strong> 2011Elizabeth Bay (OC) 42.5 7 1.40 kt kt cpht cpht k¢ k¢Aeolian and Marine Proved – – – – – –Probable 1,808 – 12.78 – 231 –Total 1,808 – 12.78 – 231 –Mining Area 1 (OC) 42.5 7 2.00 cpht cphtBeaches Proved – – – – – –Probable 1,023 – 7.26 – 74 –Total 1,023 – 7.26 – 74 –Orange River (OC) (1) 42.5 7 3.00 cpht cphtFluvial Placers Proved – – – – – –Probable 34,994 – 1.03 – 359 –Total 34,994 – 1.03 – 359 –Namdeb Holdings (Terrestrial) 42.5 multiple cpht cphtTOTAL Proved – – – – – –Probable 37,825 – 1.76 – 664 –Total 37,825 – 1.76 – 664 –Namdeb Holdings – Operations (Offshore)BCOArea Grade Saleable CaratsDIAMOND RESERVES Attributable % LOM (mm) Classification <strong>2012</strong> 2011 <strong>2012</strong> 2011 <strong>2012</strong> 2011Atlantic 1 (MM) (2) 42.5 15 1.47 k m² k m² cpm² cpm² k¢ k¢Marine Placer Proved – – – – – –Probable 57,033 – 0.09 – 4,935 –Total 57,033 – 0.09 – 4,935 –Namdeb Holdings – Operations (Terrestrial)BCOTonnes Grade CaratsDIAMOND RESOURCES Attributable % (mm) Classification <strong>2012</strong> 2011 <strong>2012</strong> 2011 <strong>2012</strong> 2011Bogenfels (OC) (3) 42.5 multiple ( 2) kt kt cpht cpht k¢ k¢Pocket Beach and Deflation Measured – – – – – –Indicated – – – – – –Measured and Indicated – – – – – –Inferred 10,955 – 6.75 – 740 –Douglas Bay (OC) 42.5 1.40 cpht cphtAeolian and Deflation Measured – – – – – –Indicated 1,502 – 7.39 – 111 –Measured and Indicated 1,502 – 7.39 – 111 –Inferred 1,959 – 2.40 – 47 –Elizabeth Bay (OC) 42.5 1.40 cpht cphtAeolian, Marine and Deflation Measured – – – – – –Indicated 4,718 – 11.62 – 548 –Measured and Indicated 4,718 – 11.62 – 548 –Inferred 54,034 – 4.12 – 2,224 –Mining Area 1 (OC) ( 4) 42.5 2.00 cpht cphtBeaches Measured – – – – – –Indicated 17,597 – 1.01 – 178 –Measured and Indicated 17,597 – 1.01 – 178 –Inferred 281,564 – 1.09 – 3,082 –Orange River (OC) 42.5 3.00 cpht cphtFluvial Placers Measured – – – – – –Indicated 109,725 – 0.50 – 544 –Measured and Indicated 109,725 – 0.50 – 544 –Inferred 44,997 – 0.35 – 157 –Namdeb Holdings (Terrestrial) 42.5 multiple cpht cphtTOTAL Measured – – – – – –Indicated 133,542 – 1.03 – 1,381 –Measured and Indicated 133,542 – 1.03 – 1,381 –Inferred 393,509 – 1.59 – 6,250 –DIAMOND RESOURCES INCLUDE DIAMOND RESERVESFootnotes appear at the end of the section.220 <strong>Anglo</strong> <strong>American</strong> plc <strong>Annual</strong> <strong>Report</strong> <strong>2012</strong>
ORE RESERVES AND MINERAL RESOURCESNamdeb Holdings – Operations (Offshore)BCOArea Grade CaratsDIAMOND RESOURCES Attributable % (mm) Classification <strong>2012</strong> 2011 <strong>2012</strong> 2011 <strong>2012</strong> 2011Atlantic 1 (MM) (2) 42.5 1.47 k m² k m² cpm² cpm² k¢ k¢Marine Measured – – – – – –Indicated 114,190 – 0.09 – 10,773 –Measured and Indicated 114,190 – 0.09 – 10,773 –Inferred 1,028,119 – 0.09 – 89,637 –Midwater (MM) (5) 42.5 2.00 cpm² cpm²Aeolian, Fluvial and Marine Measured – – – – – –Indicated 1,339 – 0.25 – 330 –Measured and Indicated 1,339 – 0.25 – 330 –Inferred 11,336 – 0.09 – 1,031 –Namdeb Holdings (Offshore) 42.5 multiple cpm² cpm²TOTAL Measured – – – – – –Indicated 115,529 – 0.10 – 11,103 –Measured and Indicated 115,529 – 0.10 – 11,103 –Inferred 1,039,455 – 0.09 – 90,668 –DIAMOND RESOURCES INCLUDE DIAMOND RESERVESMining method: OC = Open Cast, MM = Marine Mining.LOM = Life of Mine (years) is based on scheduled Probable Reserves including Indicated and some Inferred Resources considered for Life of Mine planning.Unless stated otherwise tonnage is quoted as dry metric tonnes. Estimates of Diamond Reserve tonnes reflect the tonnage to be treated.<strong>Report</strong>ed Diamond Reserves/Resources are based on a Bottom Cut Off (BCO) which refers to the bottom screen size aperture and varies between 1.00mm and 3.00mm (nominal square mesh).Grade is quoted as carats per hundred metric tonnes (cpht) or as carats per square meter (cpm²). k m² = thousand square metres.Due to the uncertainty that may be attached to some Inferred Mineral Resources, it cannot be assumed that all or part of an Inferred Mineral Resource will necessarily be upgraded to an Indicatedor Measured Resource after continued exploration.(1)Orange River: The mining transition from Daberas to Sendelingsdrif will be completed within the next 3 years.(2)Atlantic 1: Due to the high costs associated with resource development, Indicated Resources are developed on an annual basis, resulting in a 24 month rolling reserve.(3)Bogenfels: Bottom screen cut off details for Inferred Resource estimates are as follows:1.40 mm BCO: Inferred: 7,910 kt, 6.47 cpht, 510 k¢;2.00 mm BCO: Inferred: 3,040 kt, 7.50 cpht, 230 k¢.(4)Mining Area 1: Incremental Inferred Resource development is dependent on operations and dredging creating beach accretion for drilling and sampling. Beach accretion is a process throughwhich an existing beach is built seaward to extend into areas previously submerged by sea water. The accretion is accomplished by sand buildup derived from current mining activities.The Overburden Stockpile Inferred Resource estimates at 2.00mm BCO, consisting of 24,750 kt, 0.41 cpht, 100 k¢ and the DMS Tailings Inferred Resource estimates at 2.00mm BCO,consisting of 6,6830 kt, 1.10 cpht, 740 k¢, as well as the Recovery Tailings Inferred Resource estimates at 1.40mm BCO, consisting of 340 kt, 13.26 cpht, 50 k¢, are excluded from the table.(5)Midwater: That part of the offshore component of the Diamond Area No. 1 (DA1) mining license covered by water depths of 30m and more below mean sea-level.Audits related to the generation of the Ore Reserve and Mineral Resource estimates were carried out by independent consultants during <strong>2012</strong> at the following operations:Elizabeth Bay and Atlantic 1.Ore Reserves and Mineral Resources<strong>Anglo</strong> <strong>American</strong> plc <strong>Annual</strong> <strong>Report</strong> <strong>2012</strong> 221
ORE RESERVES AND MINERAL RESOURCESPHOSPHATE PRODUCTSestimates as at 31 December <strong>2012</strong>ANGLO AMERICAN FOSFATOS BRASIL LIMITADAThe Ore Reserve and Mineral Resource estimates were compiled in accordance with the Australasian Code for <strong>Report</strong>ing of Exploration Results, MineralResources and Ore Reserves (The JORC Code, 2004) as a minimum standard. The figures reported represent 100% of the Ore Reserves and MineralResources, the percentage attributable to <strong>Anglo</strong> <strong>American</strong> plc is stated separately. Rounding of figures may cause computational discrepancies.Phosphates – OperationsTonnesGradeMineORE RESERVES Attributable % Life Classification <strong>2012</strong> 2011 <strong>2012</strong> 2011Ouvidor (OP) (1) 100 40 Mt Mt %P 2 O 5 %P 2 O 5Carbonatite Complex Proved 83.1 87.9 14.1 14.0Oxide Probable 151.0 151.3 13.0 13.0Total 234.0 239.2 13.4 13.4Phosphates – OperationsTonnesGradeMINERAL RESOURCES Attributable %Classification <strong>2012</strong> 2011 <strong>2012</strong> 2011Ouvidor (OP) (2) 100 Mt Mt %P 2O 5 %P2O5Carbonatite Complex Measured 3.9 3.9 13.4 13.4Oxide Indicated 60.2 60.2 11.8 11.8Measured and Indicated 64.1 64.2 11.9 11.9Inferred (in LOM Plan) 7.5 7.6 13.2 13.2Inferred (ex. LOM Plan) 50.4 50.7 10.9 10.9Total Inferred 57.9 58.2 11.2 11.2Phosphates – ProjectsTonnesGradeMINERAL RESOURCES Attributable %Classification <strong>2012</strong> 2011 <strong>2012</strong> 2011Coqueiros (OP) (3) 100 Mt Mt %P 2 O 5 %P 2 O 5Carbonatite Complex Measured 1.8 1.8 10.5 10.5Oxide Indicated 16.5 16.5 12.9 12.9Measured and Indicated 18.3 18.3 12.6 12.6Inferred 26.2 26.2 11.2 11.2Carbonatite Complex Measured 1.2 1.2 7.3 7.3Fresh Rock Indicated 34.0 34.0 8.5 8.5Measured and Indicated 35.2 35.2 8.5 8.5Inferred 16.2 16.2 7.6 7.6MINERAL RESOURCES ARE REPORTED AS ADDITIONAL TO ORE RESERVES.Mining method: OP = Open Pit. Mine Life = the extraction period in years for scheduled Ore Reserves comprising Proved and Probable Reserves only.Due to the uncertainty that may be attached to some Inferred Mineral Resources, it cannot be assumed that all or part of an Inferred Mineral Resource will necessarily be upgraded to an Indicatedor Measured Resource after continued exploration.(1)Ouvidor – Oxide Ore Reserves: The decrease is due to production. <strong>Report</strong>ed as Copebrás in 2011.(2)Ouvidor – Oxide Mineral Resources: Mineral Resources are quoted above a 7% P2O5 cut-off and a CaO/P2O5 ratio between 1 and 1.4. Inferred (ex. LOM Plan) material includes 29.8Mt at 11.64%P2O 5 Oxide in the MCG01 tenement. Currently <strong>Anglo</strong> <strong>American</strong> owns the mineral rights but not the surface rights for the area within MCG01 overlying the Inferred (ex. LOM Plan) material. <strong>Report</strong>edas Copebrás in 2011.(3)Coqueiros: The Oxide mineralisation is defined by a cut-off grade of 7% P2O5 and a CaO/ P2O5 ratio between 1 and 1.4. The Fresh Rock resources are defined by a cut-off grade of 5% P2O5.An updated exploration drilling report has been submitted to Brazil’s Departamento Nacional de Produção Mineral (DNPM) and is awaiting approval.222 <strong>Anglo</strong> <strong>American</strong> plc <strong>Annual</strong> <strong>Report</strong> <strong>2012</strong>
ORE RESERVES AND MINERAL RESOURCESNIOBIUMestimates as at 31 December <strong>2012</strong>ANGLO AMERICAN NIÓBIO BRASIL LIMITADAThe Ore Reserve and Mineral Resource estimates were compiled in accordance with the Australasian Code for <strong>Report</strong>ing of Exploration Results, MineralResources and Ore Reserves (The JORC Code, 2004) as a minimum standard. The figures reported represent 100% of the Ore Reserves and MineralResources, the percentage attributable to <strong>Anglo</strong> <strong>American</strong> plc is stated separately. Rounding of figures may cause computational discrepancies.Niobium – OperationsMineTonnes Grade Contained ProductORE RESERVES Attributable % Life Classification <strong>2012</strong> 2011 <strong>2012</strong> 2011 <strong>2012</strong> 2011Boa Vista (OP) 100 4 Mt Mt %Nb 2 O 5 %Nb 2 O 5 kt ktCarbonatite Complex Proved 2.9 3.4 0.98 1.03 29 35Oxide (1) Probable 1.0 1.0 1.18 1.04 11 10Total 3.9 4.3 1.03 1.03 40 45Carbonatite Complex Proved – – – – – –Phosphate Tailings (2) Probable 2.0 – 0.73 – 14 –Total 2.0 – 0.73 – 14 –Niobium – Operations Tonnes Grade Contained ProductMINERAL RESOURCES Attributable % Classification <strong>2012</strong> 2011 <strong>2012</strong> 2011 <strong>2012</strong> 2011Boa Vista (OP) 100 Mt Mt %Nb 2 O 5 %Nb 2 O 5 kt ktCarbonatite Complex Measured 2.6 2.0 1.29 1.30 34 26Oxide (3) Indicated 0.8 0.8 1.02 1.04 8 8Measured and Indicated 3.4 2.8 1.22 1.22 42 35Inferred (in LOM Plan) 0.2 0.3 0.90 0.95 2 3Inferred (ex. LOM Plan) 0.7 0.8 0.82 0.87 5 7Total Inferred 0.8 1.1 0.83 0.89 7 9Niobium – Projects Tonnes Grade Contained ProductMINERAL RESOURCES Attributable % Classification <strong>2012</strong> 2011 <strong>2012</strong> 2011 <strong>2012</strong> 2011Catalão I & II Complex (OP) 100 Mt Mt %Nb 2 O 5 %Nb 2 O 5 kt ktCarbonatite Complex Measured 14.3 13.7 1.23 1.24 175 170Fresh Rock (4) Indicated 36.8 19.5 1.01 1.24 373 243Measured and Indicated 51.1 33.2 1.07 1.24 548 413Inferred 20.2 18.1 1.27 1.37 255 248MINERAL RESOURCES ARE REPORTED AS ADDITIONAL TO ORE RESERVES.Mining method: OP = Open Pit. Mine Life = the extraction period in years for scheduled Ore Reserves comprising Proved and Probable Reserves only.Due to the uncertainty that may be attached to some Inferred Mineral Resources, it cannot be assumed that all or part of an Inferred Mineral Resource will necessarily be upgraded to an Indicated orMeasured Resource after continued exploration.(1)Boa Vista – Oxide Ore Reserves: The decrease is primarily due to production. <strong>Report</strong>ed as Catalão in 2011.(2)Boa Vista – Phosphate Tailings Ore Reserves: The fines portion of the Phosphate tailings from Ouvidor are processed in the Niobium Tailings Plant to recover Niobium.(3)Boa Vista – Oxide Mineral Resources: The Oxide Resources are reported above a 0.5% Nb 2 O 5 cut-off. The Mineral Resources are split into Oxide and Fresh Rock due to the recognition of distinctdifferences in mineralogical characteristics. The increase is due to improved grade control and new drilling information. <strong>Report</strong>ed as Catalão in 2011.(4)Catalão I & II Complex – Fresh Rock Mineral Resources: The Fresh Rock Resources are reported above a 0.5 %Nb 2 O 5 cut-off for Boa Vista Mine. For Area Leste, Mina II and Morro do Padre thecut-off grade is 0.7 %Nb2O 5 . The increase is a result of the completion of a drilling campaign enabling the geological model to be updated along with a lowering in the cut-off grade. Studies are inprogress to convert resources to reserves. The Fresh Rock Resources are a combination of 4 project areas:Area Leste: Measured 8.2 Mt at 1.24 %Nb2O 5 ; Indicated 4.7 Mt at 1.20 %Nb 2 O 5 ; Inferred 1.3 Mt at 1.12 %Nb 2 O 5Boa Vista: Measured 0.6 Mt at 0.97 %Nb 2 O 5 ; Indicated 28.6 Mt at 0.95 %Nb 2 O 5 ; Inferred 9.2 Mt at 1.03 %Nb 2 O 5Mina II: Measured 5.5 Mt at 1.24 %Nb 2 O 5 ; Indicated 0.9 Mt at 1.17 %Nb 2 O 5 ; Inferred 0.8 Mt at 1.19 %Nb 2 O 5Morro do Padre: Indicated 2.6 Mt at 1.27 %Nb 2 O 5 ; Inferred 8.9 Mt at 1.54 %Nb 2 O 5Ore Reserves and Mineral Resources<strong>Anglo</strong> <strong>American</strong> plc <strong>Annual</strong> <strong>Report</strong> <strong>2012</strong> 223
ORE RESERVES AND MINERAL RESOURCESRESERVE AND RESOURCE RECONCILIATION OVERVIEW (1)(2)2011–<strong>2012</strong>Detailed 2011 and <strong>2012</strong> information appears pages 196–2232011–<strong>2012</strong> Kumba Iron Ore Ore Reserves reconciliationSaleable Product (Mt) – Operations (100% basis)1,0002011–<strong>2012</strong> Kumba Iron Ore Mineral Resources reconciliationTonnes (Mt) – Operations (100% basis)1,000950950900850Negative: -98.1Positive: 45.19008508007507006502011: 955.4<strong>2012</strong>: 902.5Total (Mt) <strong>2012</strong> 2011902.5 955.4– +Production 43.3 0Conversion 1.0 0Economic 0 25.0assumptionsNewinformation 53.8 0Other 0 20.1Acquisitions/ 0 0Disposals8007507006502011: 953.9Negative: -241.8Positive: 21.2<strong>2012</strong>: 733.2Total (Mt) <strong>2012</strong> 2011733.2 953.9– +Depletion 2.0 0Conversion 0 2.8Economic 0 18.4assumptionsNewinformation 175.3 0Other 64.5 0Acquisitions/ 0 0Disposals2011–<strong>2012</strong> Minas-Rio Ore Reserves reconciliationTonnes (Mt) – Project (100% basis)1,5502011–<strong>2012</strong> Minas-Rio Mineral Resources reconciliationTonnes (Mt) – Project (100% basis)6,0001,4505,8001,3501,2505,6005,4001,1505,2005,0001,0509508507506502011: 0Positive: 1,452.8<strong>2012</strong>: 1,452.8Total (Mt) <strong>2012</strong> 20111,452.8 0– +Production 0 0Conversion 0 1,452.8Economic 0 0assumptionsNewinformation 0 0Other 0 0Acquisitions/ 0 0Disposals4,8004,6004,4004,2004,0002011: 5,770.7Negative: -1,546.8Positive: 44.2<strong>2012</strong>: 4,268.1Total (Mt) <strong>2012</strong> 20114,268.1 5,770.7– +Depletion 0 0Conversion 1,452.8 0Economic 0 0assumptionsNewinformation 0 44.2Other 94.0 0Acquisitions/ 0 0Disposals2011–<strong>2012</strong> Metallurgical Coal Reserves reconciliationROM Tonnes (Mt) – Operations (100% basis)1,2002011–<strong>2012</strong> Metallurgical Coal Resources reconciliationTonnes (MTIS) – Operations (100% basis)1,5001,000800Negative: -36.3Positive: 239.01,4401,38060040020002011: 810.0<strong>2012</strong>: 1,012.7Total (Mt) <strong>2012</strong> 20111,012.7 810.0– +Production 36.3 0Conversion 0 1.1Economic 0 139.7assumptionsNewinformation 0 98.2Other 0 0Acquisitions/ 0 0Disposals1,3201,2601,2002011: 1,464.3Negative: -148.9Positive: 8.5<strong>2012</strong>: 1,323.9Total <strong>2012</strong> 2011(MTIS) 1,323.9 1,464.3– +Depletion 0 0Conversion 1.1 0Economic 147.8 0assumptionsNewinformation 0 8.5Other 0 0Acquisitions/ 0 0Disposals224 <strong>Anglo</strong> <strong>American</strong> plc <strong>Annual</strong> <strong>Report</strong> <strong>2012</strong>
ORE RESERVES AND MINERAL RESOURCES2011–<strong>2012</strong> Thermal Coal Reserves reconciliationROM Tonnes (Mt) – Operations (100% basis)2,0002011–<strong>2012</strong> Thermal Coal Resources reconciliationTonnes (MTIS) – Operations (100% basis)2,0001,9501,9501,9001,9001,8501,8001,7502011: 1,948.2Negative: -137.2Positive: 0.8<strong>2012</strong>: 1,811.8Total (Mt) <strong>2012</strong> 20111,811.8 1,948.2– +Production 109.5 0Conversion 2.5 0Economic 6.8 0assumptionsNewinformation 0 0.8Other 18.4 0Acquisitions/ 0 0Disposals1,8501,8001,7502011: 1,843.0Negative: -0.3Positive: 105.9<strong>2012</strong>: 1948.6Total <strong>2012</strong> 2011(MTIS) 1,948.6 1,843.0– +Depletion 0.3 0Conversion 0 11.1Economic 0 9.0assumptionsNewinformation 0 75.8Other 0 10.0Acquisitions/ 0 0Disposals2011–<strong>2012</strong> Copper Ore Reserves reconciliationContained Copper (kt) – Operations (100% basis)40,0002011–<strong>2012</strong> Copper Mineral Resources reconciliationContained Copper (kt) – Operations (100% basis)70,00039,00065,00038,00037,00060,00036,00035,00034,0002011–<strong>2012</strong> Nickel Ore Reserves reconciliationContained Nickel (kt) – Operations (100% basis)1,0009509002011: 36,958.5Negative: -2,126.9Positive: 4,350.2<strong>2012</strong>: 39,181.9Total (kt) <strong>2012</strong> 201139,181.9 36,958.5– +Production 1,151.5 0Conversion 0 3,370.2Economic 0 900.1assumptionsNewinformation 0 79.9Other 975.4 0Acquisitions/ 0 0Disposals55,00050,0002011–<strong>2012</strong> Nickel Mineral Resources reconciliationContained Nickel (kt) – Operations (100% basis)1,3001,2501,2001,1502011: 56,489.9Negative: -4,376.6Positive: 14,683.6<strong>2012</strong>: 66,796.9Total (kt) <strong>2012</strong> 201166,796.9 56,489.9– +Depletion 6.9 0Conversion 3,702.9 0Economic 0 9,650.2assumptionsNewinformation 0 5,033.4Other 666.8 0Acquisitions/ 0 0DisposalsOre Reserves and Mineral Resources1,1008508007507002011: 963.9Negative: -204.0Positive: 60.0<strong>2012</strong>: 819.9Total (kt) <strong>2012</strong> 2011819.9 963.9– +Production 18.3 0Conversion 9.8 0Economic 0 30.1assumptionsNewinformation 0 29.9Other 107.9 0Acquisitions/ 68.0 0Disposals1,0501,0009509008508002011: 1,224.9Negative: -270.9Positive: 121.7<strong>2012</strong>: 1,075.3Total (kt) <strong>2012</strong> 20111,075.3 1,224.9– +Depletion 11.2 0Conversion 103.5 0Economic 32.3 0assumptionsNewinformation 25.9 0Other 0 121.7Acquisitions/ 98.1 0Disposals<strong>Anglo</strong> <strong>American</strong> plc <strong>Annual</strong> <strong>Report</strong> <strong>2012</strong> 225
ORE RESERVES AND MINERAL RESOURCESRESERVE AND RESOURCE RECONCILIATION OVERVIEW (1)(2)2011–<strong>2012</strong>Detailed 2011 and <strong>2012</strong> information appears on pages 196–2232011–<strong>2012</strong> Platinum Ore Reserves reconciliationContained PGE (Moz) – All Reefs (South Africa)1902011–<strong>2012</strong> Platinum Mineral Resources reconciliationContained PGE (Moz) – All Reefs (South Africa)6501806401706301601501401302011: 176.1Negative: -29.5Positive: 24.2<strong>2012</strong>: 170.8Total (Moz) <strong>2012</strong> 2011170.8 176.1– +Production 4.1 0Conversion 0 24.2Economic 25.4 0assumptionsNewinformation 0 0Other 0 0Acquisitions/ 0 0Disposals6206106002011: 639.2Negative: -26.6Positive: 31.5<strong>2012</strong>: 644.1Total (Moz) <strong>2012</strong> 2011644.1 639.2– +Depletion 0 0Conversion 25.4 0Economic 0 31.2assumptionsNewinformation 0 0Other 1.2 0Acquisitions/ 0 0.3Disposals2011–<strong>2012</strong> Phosphate Products Ore Reserves reconciliationTonnes (Mt) – Operations (100% basis)2452011–<strong>2012</strong> Phosphate Products Mineral Resources reconciliationTonnes (Mt) – Operations (100% basis)1252401242352302252202011: 239.2Negative: -5.6Positive: 0.5<strong>2012</strong>: 234.0Total (Mt) <strong>2012</strong> 2011234.0 239.2– +Production 5.6 0Conversion 0 0Economic 0 0assumptionsNewinformation 0 0Other 0 0.5Acquisitions/ 0 0Disposals1231221211202011: 122.4Negative: -0.5Positive: 0<strong>2012</strong>: 122.0Total (Mt) <strong>2012</strong> 2011122.0 122.4– +Depletion 0.4 0Conversion 0 0Economic 0 0assumptionsNewinformation 0 0Other 0.1 0Acquisitions/ 0 0Disposals2011–<strong>2012</strong> Niobium Ore Reserves reconciliationContained Product (kt) – Operations (100% basis)602011–<strong>2012</strong> Niobium Mineral Resources reconciliationContained Product (kt) – Operations (100% basis)50495048474030202011: 44.7Negative: -10.1Positive: 20.0<strong>2012</strong>: 54.7Total (kt) <strong>2012</strong> 201154.7 44.7– +Production 9.9 0Conversion 0.2 0Economic 0 0assumptionsNewinformation 0 16.4Other 0 3.6Acquisitions/ 0 0Disposals4645444342412011: 44.1Negative: -0.2Positive: 4.9<strong>2012</strong>: 48.8Total (kt) <strong>2012</strong> 201148.8 44.1– +Depletion 0.2 0Conversion 0 0Economic 0 0assumptionsNewinformation 0 4.9Other 0 0Acquisitions/ 0 0Disposals226 <strong>Anglo</strong> <strong>American</strong> plc <strong>Annual</strong> <strong>Report</strong> <strong>2012</strong>
ORE RESERVES AND MINERAL RESOURCES(1)Ore Reserve and Mineral Resource reconciliation categoriesTonnage and content change categoriesOpening BalanceProduction*(from Reserve Model)Depletion*(from Resource Model)ConversionEconomic AssumptionsNew InformationDefinition and explanationas at 31 December – previous reporting yearThe amount of material (expressed in terms of tonnage or content as applicable) removed by planned mining from the scheduled Ore Reservesi.e. the areas actually mined during the reporting period which are removed from the reserve model/s.The amount of material (expressed in terms of tonnage or content as applicable) removed by mining from the Mineral Resources i.e. the areas actuallymined during the reporting period which are removed from the resource model/s. Material removed from the ‘Inferred in Mine Plan’ category should bereported as Depletion.The effect of applying updated ‘Modifying Factors’ to Ore Reserves and Mineral Resources which include geo-technical, mining, metallurgical,marketing, legal, environmental, social and governmental considerations including infrastructure. Includes changes to the mining method, mine planand/or layout changes e.g. changes in pit slope angles or mineable cut due to geo-technical reasons.The change can be positive or negative year-on-year.Sub-Categories:• Conversion is the process of up-grading Mineral Resources to Ore Reserves based on a change in confidence levels and/or modifying factors.• Re-allocation is the process of down-grading of Ore Reserves to Mineral Resources or Mineral Resources to Mineralised Inventory based on a change inconfidence levels and/or modifying factors.• Sterilisation is the process of removing material from Ore Reserves and/or Mineral Resources that no longer has reasonable and realistic prospects foreventual economic extraction.The effect of assumptions based on the current or future price of a commodity and exchange rate estimates as determined by the corporate centre(Global Assumptions) which has a direct impact on the Mineral Resources or Ore Reserves particularly the cut-off grade (which can be affected bychanges in costs).The effect of additional resource definition information (with QA/QC information) which initiates an update to the geological models (facies, structural,grade, geo-technical) and results in an updated (re-classified) resource model and subsequent determination of new Ore Reserve estimates.Includes ore bodies (or portions of current orebodies) within the same project/operation not previously reported.Other Model Refinement No additional resource definition drilling has been undertaken but the interpretation (geometry) of theorebody has been refined or internal mine/lease boundaries changed e.g. based on mappinginformation obtained during mining or a different structural model being applied. Changes to in-situtonnages as a result of new geological losses being applied or a change to the definition of theboundary of the Mineral Resources due to an updated ‘economically mineable cut’ being applied.MethodologyTransferStockpilesNew TechnologyReconciliation AdjustmentOnly valid for changes in the estimation or classification methodologies applied to the resource modelevaluation i.e. no new information available or model refinement taken place.Movement of Mineral Resources and/or Ore Reserves from one type of product/ore type to another orfrom one mining/project area to another.Changes to stockpiles.Changes to Mineral Resources or Ore Reserves in response to the application of new or improvedmining and/or processing methods.Changes which cannot be allocated to a defined category or an adjustment necessary to mitigateinaccurate production/depletion estimates of the previous year.*AcquisitionsDisposalsClosing BalanceAdditional Mineral Resources and Ore Reserves due to acquisitions of assets or increased attributable interests in JV agreements/associate companies.Reduction in Mineral Resources and Ore Reserves due to disposals of assets or reduced attributable interests in JV agreements/associate companies,refusal/withdrawal of Mining/Prospecting Rights or related permits e.g. due to environmental issues, changes in policy.as at 31 December – current reporting year* The Production/Depletion figures may be estimated for these last three months of the reporting period based on the monthly average of the previous nine months.(2)Ore Reserves: Includes Proved and ProbableMineral Resources: Includes Measured, Indicated and Inferred [for Coal only Inferred (in LOM Plan) is considered]Due to the uncertainty that may be attached to some Inferred Mineral Resources, it cannot be assumed that all or part of an Inferred Mineral Resource will necessarily be upgraded to an Indicated orMeasured Resource after continued exploration.Rounding of figures may cause computational discrepancies.Ore Reserves and Mineral Resources<strong>Anglo</strong> <strong>American</strong> plc <strong>Annual</strong> <strong>Report</strong> <strong>2012</strong> 227
ORE RESERVES AND MINERAL RESOURCESDEFINITIONSORE RESERVESAn ‘Ore Reserve’ is the economically mineable part of a Measured and/orIndicated Mineral Resource. It includes diluting materials and allowancesfor losses, which may occur when the material is mined. Appropriateassessments and studies have been carried out, and include considerationof and modification by realistically assumed mining, metallurgical, economic,marketing, legal, environmental, social and governmental factors. Theseassessments demonstrate at the time of reporting that extraction couldreasonably be justified. Ore Reserves are sub-divided in order of increasingconfidence into Probable Ore Reserves and Proved Ore Reserves.A ‘Proved Ore Reserve’ is the economically mineable part of a MeasuredMineral Resource. It includes diluting materials and allowances for losseswhich may occur when the material is mined. Appropriate assessments andstudies have been carried out, and include consideration of and modificationby realistically assumed mining, metallurgical, economic, marketing, legal,environmental, social and governmental factors. These assessmentsdemonstrate at the time of reporting that extraction could reasonablybe justified.A ‘Probable Ore Reserve’ is the economically mineable part of an Indicated,and in some circumstances, a Measured Mineral Resource. It includes dilutingmaterials and allowances for losses which may occur when the material ismined. Appropriate assessments and studies have been carried out, andinclude consideration of and modification by realistically assumed mining,metallurgical, economic, marketing, legal, environmental, social andgovernmental factors. These assessments demonstrate at the time ofreporting that extraction could reasonably be justified.MINERAL RESOURCESA ‘Mineral Resource’ is a concentration or occurrence of material of intrinsiceconomic interest in or on the Earth’s crust in such form, quality and quantitythat there are reasonable prospects for eventual economic extraction. Thelocation, quantity, grade, geological characteristics and continuity of a MineralResource are known, estimated or interpreted from specific geological evidenceand knowledge. Mineral Resources are sub-divided, in order of increasinggeological confidence, into Inferred, Indicated and Measured categories.A ‘Measured Mineral Resource’ is that part of a Mineral Resource for whichtonnage, densities, shape, physical characteristics, grade and mineral contentcan be estimated with a high level of confidence. It is based on detailed andreliable exploration, sampling and testing information gathered throughappropriate techniques from locations such as outcrops, trenches, pits,workings and drill holes. The locations are spaced closely enough to confirmgeological and grade continuity.An ‘Indicated Mineral Resource’ is that part of a Mineral Resource for whichtonnage, densities, shape, physical characteristics, grade and mineral contentcan be estimated with a reasonable level of confidence. It is based onexploration, sampling and testing information gathered through appropriatetechniques from locations such as outcrops, trenches, pits, workings and drillholes. The locations are too widely or inappropriately spaced to confirmgeological and/or grade continuity but are spaced closely enough forcontinuity to be assumed.An ‘Inferred Mineral Resource’ is that part of a Mineral Resource for whichtonnage, grade and mineral content can be estimated with a low level ofconfidence. It is inferred from geological evidence and assumed but notverified geological and/or grade continuity. It is based on informationgathered through appropriate techniques from locations such as outcrops,trenches, pits, workings and drill holes which may be limited or of uncertainquality and reliability.COMMON TERMINOLOGYDepositA deposit is a concentration (or occurrence) of material of possible economic interest, in or on the earth’s crust, that may include mineralized material thatcannot be estimated with sufficient confidence to be classified in the Inferred category. Portions of a deposit that do not have reasonable and realisticprospects for eventual economic extraction are not included in a Mineral Resource.GradeThe relative quantity, percentage or quality, of a metal or mineral/diamond content estimated to be contained within a deposit.Cut-off (grade)A grade (see grade units) above which the Mineral Resource or Ore Reserve is reported as being potentially economic.Run of Mine (ROM)The mined material delivered from the mine to the processing plant is called run-of-mine, or ROM. This is the raw unprocessed mineralised material andincludes mineralised rock and varying amounts of internal and external contamination (either unmineralised rock or mineralised material below the cut-offgrade). Contamination is usually introduced by the mining process to ensure all the mineralised material is mined or to provide a minimum mining height. ROMmaterial can have highly variable moisture content and maximum particle size.Inferred (in LOM Plan)/Inferred (ex. LOM Plan)Inferred (in LOM Plan): Inferred Resources within the scheduled Life of Mine Plan (LOM Plan).Inferred (ex. LOM Plan): The portion of Inferred Resources with reasonable prospects for eventual economic extraction not considered in the Life of Mine Plan(LOM Plan).Mine LifeThe extraction period in years for scheduled Ore Reserves comprising Proved and Probable Reserves only.This is the current view of the period of production based on current Ore Reserve tonnes and average annual planned production rate.Life of Mine PlanA design and costing study of an existing operation in which appropriate assessments have been made of realistically assumed geological, mining,metallurgical, economic, marketing, legal, environmental, social, governmental, engineering, operational and all other modifying factors, which are consideredin sufficient detail to demonstrate at the time of reporting that extraction is reasonably justified.228 <strong>Anglo</strong> <strong>American</strong> plc <strong>Annual</strong> <strong>Report</strong> <strong>2012</strong>
ORE RESERVES AND MINERAL RESOURCESGLOSSARYMASS UNITScarat: carat is a unit of mass equal to 0.2gkt:kilotonne; metric system unit of mass equal to 1,000 metric tonnesMoz:million troy ounces (a kilogram is equal to 32.1507 ounces; a troy ounce is equal to 31.1035 grams)Mt:million tonnes, metric system unit of mass equal to 1,000 kilotonnesMTIS: Mineable Tonnage In-Situ; quoted in million tonnesmtpa: million tonnes per annumTonnes: metric system unit of mass equal to 1,000 kilogramsGRADE UNITS (expressed on a moisture-free basis)ASCu: Acid soluble copper (%)Au:Gold (g/t)cpht:carats per hundred metric tonnescpm²: carats per square metreCSN:Crucible Swell Number (CSN is rounded to the nearest 0.5 index)CuEq: Copper equivalent based on long term metal prices taking into consideration the recovery of Copper, Gold and Molybdenum (%)CV:Calorific Value (CV is rounded to the nearest 10 kcal/kg)ICu: Insoluble copper, total copper less acid soluble copper (%)kcal/kg: kilocalories per kilogramg/t:grams per tonnek¢:Thousand caratsM¢:Million caratsTCu: Total Copper (%)4E PGE: The sum of Platinum, Palladium, Rhodium and Gold grades in grammes per tonne (g/t)3E PGE: The sum of Platinum, Palladium and Gold grades in grammes per tonne (g/t)% Cu: weight percent Copper% Fe: weight percent Iron% Mn: weight percent Manganese% Mo: weight percent Molybdenum% Ni: weight percent Nickel% Nb 2 O 5 : weight percent Niobium pentoxide% P 2 O 5 : weight percent Phosphorus pentoxideMINING TERMINOLOGYMM:Marine Mining – Mining diamonds deposited on the continental shelf using mining vessels equipped with specialised underwater mining toolssuch as suction drills and crawlers.OC:Open Cut – A surface mining method performed on orebodies with shallow-dipping tabular geometries.OP:Open Pit – A surface mining method in which both ore and waste are removed during the excavation of a pit. The pit geometry is related to theorebody shape, but tends to have a conical form, closing with depth.UG:Underground – A class of subsurface mining methods, where the ore is accessed either through a vertical shaft or decline. Ore and waste aremoved within subsurface excavations, which may be located on several different elevations. The nature of the underground excavations isdependent on the geometry and size of the mineralisation.PROCESSING TERMINOLOGYDump Leach: A process similar to Heap Leaching, but usually applied to lower grade material. Rather than constructing a heap of material with a controlledgrain size, the material grain sizes are as mined, similar to the situation found within a waste rock dump. This material is then irrigated with aleach solution that dissolves the valuable minerals, allowing recovery from the drained leach solution.Flotation: A process for concentrating minerals based on their surface properties. Finely ground mineral is slurried with water and specific reagents thatincrease the water repellent nature of the valuable mineral and agitated with air. The water repellent mineral grains cling to froth bubbles thatconcentrate the mineral at the top of the flotation cell, from where it is mechanically removed.Heap Leach: A process in which mineral-bearing rock is crushed and built into a designed heap. The heap is irrigated with a leach solution that dissolves thedesirable mineral and carries it into a drain system from which solution is pumped and the mineral/elements of interest are recovered.Vat Leach: A process whereby crushed rock containing valuable minerals is placed within vats. The vats are filled with a leach solution and the valuablemineral(s) dissolve. The leach solution is pumped to a recovery circuit and the vats are drained and emptied of the spent ore and recharged.Ore Reserves and Mineral Resources<strong>Anglo</strong> <strong>American</strong> plc <strong>Annual</strong> <strong>Report</strong> <strong>2012</strong> 229
ORE RESERVES AND MINERAL RESOURCESGLOSSARYRESOURCE TYPESAeolian:Diamond deposits created and enriched during transport of sediment through wind action (aeolian processes) resulting in theformation of wind blown dunes, ripples and sand sheets within which localised enrichment of diamonds may occur.Banded Iron Formation: A chemical sedimentary rock consisting of silica and iron oxide. The rock texture is characteristically laminated or banded.Beaches:Diamond deposits enriched through marine processes and preserved along the marine shoreline within a series of fossil terraces.Canga:An iron rich rock formed where material weathered from an original iron ore deposit has been cemented by iron minerals.Carbonatite Complex: A group of overlapping igneous intrusions of alkaline rocks including magmatic carbonate (sövite) rock. These complexes arefrequently host to phosphate, niobium and rare-earth element deposits.Colluvium:Loose, unconsolidated material that accumulates above the weathering iron ore bodies.Deflation:Diamond deposits enriched through wind driven removal of light particles resulting in concentration of diamonds.Ferruginous Laterite: An especially iron-rich laterite.Fluvial Placer:Diamond deposits formed and preserved within fossil sand and gravel terraces located adjacent to contemporary fluvial(river) systems.Fresh Rock:Mineable material that has not been significantly modified by surface weathering processes.Hematite: An iron oxide mineral with the chemical formula Fe 2 O 3 .Itabirite (Friable/Compact): Itabirite is a banded quartz hematite schist, very similar to banded iron formation in appearance and composition.Friable Itabirite is extensively weathered leading to disaggregation of the individual mineral grains comprising the rock.Compact Itabirite, previously known as Hard Itabirite, is the unweathered equivalent.Kimberlite:A potassic ultrabasic volcanic rock, emplaced as either pipes, dykes or sills, which sometimes contain diamonds.Laterite:A claylike soil horizon rich in iron and aluminium oxides that formed by weathering of igneous rocks under tropical conditions.Magnetite: An iron oxide mineral with the chemical formula Fe 3 O 4 .Main Sulphide Zone (MSZ): The Main Sulphide Zone is the principal host of Platinum Group Metals within the Great Dyke of Zimbabwe. The Main SulphideZone is a tabular zone of sulphide-bearing rock within the uppermost P1 Pyroxenite.Marine:Submerged diamond deposits enriched through fluvial (river), beach and marine reworking processes.Merensky Reef (MR): One of the three major Platinum Group Metals bearing units within the Bushveld Complex. The Merensky Reef is located withinthe Upper Critical Zone of the Bushveld Complex and ranges in width from 0.8m to 4m. The Merensky Reef occurs at theinterface between the Merensky Pyroxenite and the underlying anorthosite to norite. The Merensky Reef is characterised by theoccurrence of one or more narrow chromitite stringers and frequently includes a coarse-grained pegmatoidal pyroxenite.Oxide:Oxide ores are those found within close proximity to surface and whose mineralogy is dominated by oxidised species, includingoxides and sulphates. Frequently, silicate minerals have broken down partially or completely to clay-rich species.Platreef (PR):The Platreef is only present within the Northern Limb of the Bushveld Complex, in the vicinity of Polokwane, South Africa.The Platreef is a heterogenous unit dominated by felspathic pyroxenite, but including serpentinised pyroxenites and xenolithsof footwall rock. The Platreef dips steeply to the west and ranges in thickness between 60m and 200m. Platinum Group Metalmineralisation occurs disseminated within the Platreef and in frequent association with base-metal sulphides.Pocket Beach:Diamond deposits formed due to interactions of ocean (longshore) currents with specific shoreline topographic features thatfacilitate the concentration of diamonds.Porphyry (Copper):Large copper deposits hosted by intermediate felsic rocks. These deposits form close to large-scale subduction zones.Saprolite:Clay-rich rock formed by decomposition of pre-existing rocks within a surface weathering environment.Stockpile:Stockpiles resources comprise material that is mined together with the principal ore, but for economic or technical reasons is notprocessed. This material is stockpiled in preparation for processing when economic or technical conditions are more favourable.Sulphide:Sulphide ores contain sulphide minerals that have not been subjected to surface oxidation.Tailings:Material left over after the process of separating the valuable fraction of the mineralised material from the uneconomic fraction(gangue) of the run-of-mine. In some cases tailings can be re-treated to extract by-products.UG2 Reef (UG2):The UG2 Reef is located between 20m and 400m below the Merensky Reef and is the second chromitite unit within the UpperGroup. The UG2 is typically a massive chromitite unit ranging in thickness from 0.6m to 1.2m. The hangingwall of the UG2 is afelspathic pyroxenite unit that may include several narrow chromitite stringers. The footwall of the UG2 is a coarse-grainedpegmatoidal pyroxenite.COAL PRODUCTSMetallurgical – Coking:Metallurgical – Other:Thermal – Export:Thermal – Domestic:Synfuel:High-, medium- or low-volatile semi-soft, soft or hard coking coal primarily for blending and use in the steel industry; qualitymeasured as Crucible Swell Number (CSN).Semi-soft, soft, hard, semi-hard or anthracite coal, other than Coking Coal, such as pulverized coal injection (PCI) or othergeneral metallurgical coal for the export or domestic market with a wider range of properties than Coking Coal; quality measuredby calorific value (CV).Low- to high-volatile thermal coal primarily for export in the use of power generation; quality measured by calorific value (CV).Low- to high-volatile thermal coal primarily for domestic consumption for power generation; quality measured by calorificvalue (CV).Coal specifically for the domestic production of synthetic fuel and chemicals; quality measured by calorific value (CV).230 <strong>Anglo</strong> <strong>American</strong> plc <strong>Annual</strong> <strong>Report</strong> <strong>2012</strong>
OTHER INFORMATIONPRODUCTION STATISTICSThe figures below include the entire output of consolidated entities and the Group’s attributable share of joint ventures, joint arrangements and associateswhere applicable, except for Collahuasi in the Copper segment and De Beers which are quoted on a 100% basis.<strong>2012</strong> 2011Iron Ore and Manganese segment (tonnes)Kumba Iron Ore (1)(2)Lump 26,580,500 25,445,100Fines 16,484,600 15,822,500Total iron ore production 43,065,100 41,267,600Samancor (3)Manganese ore 3,347,800 2,786,800Manganese alloys (4) 198,400 300,500Coal (tonnes)Metallurgical Coal segmentAustraliaMetallurgical – Coking 10,484,700 9,290,400Metallurgical – Other (PCI) 5,802,700 3,963,000Thermal 12,970,500 13,426,50029,257,900 26,679,900CanadaMetallurgical – Coking 1,376,900 936,300Total Metallurgical Coal segment coal production 30,634,800 27,616,200Thermal Coal segmentSouth AfricaThermal – Export 17,132,100 16,328,400Thermal – Domestic (Eskom) 33,706,400 35,296,000Thermal – Domestic (non-Eskom) 6,219,100 5,059,700Metallurgical – Domestic 74,100 323,40057,131,700 57,007,500ColombiaThermal – Export 11,548,800 10,751,700Total Thermal Coal segment coal production 68,680,500 67,759,200Total coal production 99,315,300 95,375,400Coal (tonnes)Metallurgical Coal segmentAustraliaCallide 7,464,000 8,038,700Capcoal 6,022,400 5,047,900Dawson 4,593,500 3,904,600Drayton 3,663,300 3,991,900Foxleigh 1,896,000 1,417,100Jellinbah 2,073,200 1,829,600Moranbah North 3,545,500 2,450,10029,257,900 26,679,900CanadaPeace River Coal 1,376,900 936,300Total Metallurgical Coal segment coal production 30,634,800 27,616,200Thermal Coal segmentSouth AfricaGreenside 2,883,200 2,853,100Goedehoop 4,859,900 5,200,800Isibonelo 5,399,200 4,338,200Kriel 8,096,900 8,151,700Kleinkopje 3,765,500 4,400,600Landau 4,272,300 4,171,200New Denmark 3,401,200 4,812,600New Vaal 17,623,300 17,399,700Mafube 1,804,100 2,313,100Zibulo (5) 5,026,100 3,366,50057,131,700 57,007,500(1)Kolomela commenced commercial production on 1 December 2011. Revenue and related costs associated with 984,700 tonnes of production were capitalised for the year ended31 December 2011.(2)In <strong>2012</strong> Amapá has been reclassified from Iron Ore and Manganese to Other Mining and Industrial to align with internal management reporting. Comparatives have been reclassified to alignwith current presentation.(3)Saleable production.(4)Production includes Medium Carbon Ferro Manganese.(5)Zibulo commenced commercial production on 1 October 2011. Revenue and related costs associated with 2,155,200 tonnes of production were capitalised before commercial production wasreached in 2011. This included Eskom coal production of 633,400 tonnes and export thermal coal production of 1,521,800 tonnes.Other information<strong>Anglo</strong> <strong>American</strong> plc <strong>Annual</strong> <strong>Report</strong> <strong>2012</strong> 231
OTHER INFORMATION PRODUCTION STATISTICS<strong>2012</strong> 2011Coal (tonnes) (continued)Thermal Coal segment (continued)ColombiaCarbones del Cerrejón 11,548,800 10,751,700Total Thermal Coal segment coal production 68,680,500 67,759,200Total coal production 99,315,300 95,375,400Total coal production by commodity (tonnes)MetallurgicalSouth Africa 74,100 323,400Australia – Export 16,287,400 13,253,400Canada – Export 1,376,900 936,300Total metallurgical coal production 17,738,400 14,513,100ThermalSouth Africa – Thermal (non-Eskom) 23,351,200 21,388,100South Africa – Eskom 33,706,400 35,296,000Australia 12,970,500 13,426,500South America 11,548,800 10,751,700Total thermal coal production 81,576,900 80,862,300Total coal production 99,315,300 95,375,400Copper segmentCollahuasi100% basis (<strong>Anglo</strong> <strong>American</strong> share 44%)Ore mined Oxide tonnes 2,733,600 906,800Sulphide tonnes 17,293,800 32,535,900Marginal ore mined tonnes 54,370,100 11,797,300Ore processed Oxide tonnes 8,081,400 8,075,800Sulphide tonnes 43,618,600 47,747,400Ore grade processed Oxide % Cu 0.88 0.72Sulphide % Cu 0.76 1.02Production Copper concentrate dry metric tonnes 934,800 1,535,800Copper cathode tonnes 36,800 36,000Copper in concentrate tonnes 245,300 417,300Total copper production for Collahuasi tonnes 282,100 453,300<strong>Anglo</strong> <strong>American</strong>’s share of copper production for Collahuasi tonnes 124,100 199,500<strong>Anglo</strong> <strong>American</strong> SurLos Bronces mineOre mined tonnes 49,766,500 26,587,500Marginal ore mined tonnes 17,854,200 30,515,600Las Tortolas concentrator Ore processed tonnes 17,970,600 20,595,700Ore grade processed % Cu 0.83 0.90Average recovery % 84.0 85.8Confluencia concentrator Ore processed tonnes 27,884,300 3,329,400Ore grade processed % Cu 0.84 0.74Average recovery % 84.0 84.3Production Copper concentrate dry metric tonnes 1,195,500 658,300Copper cathode tonnes 40,800 38,400Copper in sulphate tonnes 2,500 4,600Copper in concentrate tonnes 322,000 178,800Total tonnes 365,300 221,800El Soldado mineOre mined Open pit – ore mined tonnes 8,544,500 10,197,700Ore processed Oxide tonnes 1,091,900 1,887,000Sulphide tonnes 7,782,300 7,209,100Ore grade processed Oxide % Cu 0.46 0.68Sulphide % Cu 0.83 0.82Production Copper concentrate dry metric tonnes 190,400 171,900Copper cathode tonnes 2,000 5,000Copper in concentrate tonnes 51,800 41,900Total tonnes 53,800 46,900Chagres smelterCopper concentrate smelted tonnes 142,900 143,000Production Copper blister/anode tonnes 138,700 138,200Acid tonnes 461,400 487,500Total copper production for <strong>Anglo</strong> <strong>American</strong> Sur (1) tonnes 419,100 268,700(1)Includes copper cathode, copper in sulphate and copper in concentrate production.232 <strong>Anglo</strong> <strong>American</strong> plc <strong>Annual</strong> <strong>Report</strong> <strong>2012</strong>
<strong>2012</strong> 2011Copper segment (continued)<strong>Anglo</strong> <strong>American</strong> NorteMantos Blancos mineOre mined tonnes 6,527,100 7,624,300Ore processed Oxide tonnes 4,512,100 4,563,400Sulphide tonnes 4,393,200 4,186,600Marginal ore tonnes 5,900,200 5,109,400Ore grade processed Oxide % Cu (soluble) 0.40 0.59Sulphide % Cu (insoluble) 0.64 0.95Marginal ore % Cu (soluble) 0.23 0.23Production Copper concentrate dry metric tonnes 83,000 119,000Copper cathode tonnes 29,200 36,000Copper in concentrate tonnes 25,000 36,100Total tonnes 54,200 72,100Mantoverde mineOre mined tonnes 10,642,500 10,060,100Ore processed Oxide tonnes 10,460,400 10,012,200Marginal ore tonnes 8,671,700 8,025,300Ore grade processed Oxide % Cu (soluble) 0.63 0.62Marginal ore % Cu (soluble) 0.25 0.27Production Copper cathode tonnes 62,300 58,700Total copper production for <strong>Anglo</strong> <strong>American</strong> Norte (1) tonnes 116,500 130,800Total Copper segment copper production (1) tonnes 659,700 599,000Platinum copper production tonnes 11,400 12,800Black Mountain copper production tonnes – 300Total attributable copper production (1) tonnes 671,100 612,100Nickel segmentCodeminOre mined (2) tonnes 612,600 549,900Ore processed tonnes 581,100 562,900Ore grade processed % Ni 1.81 1.89Production tonnes 9,600 9,500Loma de NíquelOre mined tonnes 432,900 1,302,600Ore processed tonnes 767,400 1,014,200Ore grade processed % Ni 1.40 1.45Production tonnes 8,100 13,400Barro Alto (3)Ore mined tonnes 1,231,700 978,000Ore processed tonnes 1,422,100 456,500Ore grade processed % Ni 1.94 1.96Production tonnes 21,600 6,200Total Nickel segment nickel production tonnes 39,300 29,100Platinum nickel production tonnes 17,700 20,300Total attributable nickel production tonnes 57,000 49,400Platinum segment (4)Platinum troy ounces 2,378,600 2,530,100Palladium troy ounces 1,395,900 1,430,700Rhodium troy ounces 310,700 337,600Copper (5) tonnes 11,400 12,800Nickel (5) tonnes 17,700 20,300Gold troy ounces 105,200 105,100Equivalent refined platinum troy ounces 2,219,100 2,410,1004E Built-up head grade g/tonne milled 3.20 3.24Diamonds segment (De Beers) (diamonds recovered – carats) (6)100% basisDebswana 20,216,000 22,890,000Namdeb 1,667,000 1,335,000De Beers Consolidated Mines 4,432,000 5,443,000De Beers Canada 1,560,000 1,660,000Total diamonds production for De Beers 27,875,000 31,328,000(1)Includes copper cathode, copper in sulphate and copper in concentrate production.(2)Represents ore mined at Barro Alto for processing at Codemin.(3)Barro Alto is currently not in commercial production and therefore all revenue and related costs associated with 21,600 tonnes (2011: 6,200 tonnes) of production have been capitalised.(4)See the published results of <strong>Anglo</strong> <strong>American</strong> Platinum Limited for further analysis of production information.(5)Also disclosed within total attributable copper and nickel production.(6)On 16 August <strong>2012</strong> <strong>Anglo</strong> <strong>American</strong> completed its acquisition of an additional 40% interest in De Beers increasing <strong>Anglo</strong> <strong>American</strong>’s total shareholding to 85%. Production data is disclosedon a 100% basis. Post completion of the acquisition, De Beers Consolidated Mines and De Beers Canada are fully consolidated subsidiaries and Debswana and Namdeb are joint venturesproportionately consolidated at 19.2% and 50% respectively. Global Sightholder Sales sells a significant portion of total production on behalf of operations based on contractual agreementsin place.Other information<strong>Anglo</strong> <strong>American</strong> plc <strong>Annual</strong> <strong>Report</strong> <strong>2012</strong> 233
OTHER INFORMATION PRODUCTION STATISTICS<strong>2012</strong> 2011Other Mining and Industrial segment (1)PhosphatesFertilisers produced tonnes 1,113,000 1,060,900NiobiumOre mined tonnes 933,200 866,600Ore processed tonnes 973,500 902,600Ore grade processed Kg Nb/tonne 8.5 8.1Production tonnes 4,400 3,900AmapáSinter feed tonnes 2,100,000 1,401,000Pellet feed tonnes 2,223,200 1,948,300Spiral concentrates tonnes 1,749,100 1,472,2006,072,300 4,821,500TarmacAggregates tonnes 37,570,800 42,878,400Lime products tonnes 1,316,900 1,264,000Concrete m 3 3,119,300 3,285,700Scaw Metals (2)South Africa Steel Products tonnes 611,600 677,400Zinc and leadLisheen (3)Ore mined tonnes – 152,800Ore processed tonnes – 156,200Ore grade processed Zinc % Zn – 13.4Lead % Pb – 2.7Production Zinc in concentrate tonnes – 19,200Lead in concentrate tonnes – 2,900Black Mountain (3)Ore mined tonnes – 132,800Ore processed tonnes – 126,200Ore grade processed Zinc % Zn – 3.4Lead % Pb – 4.5Copper % Cu – 0.4Production Zinc in concentrate tonnes – 3,300Lead in concentrate tonnes – 5,400Copper in concentrate tonnes – 300Total attributable zinc production tonnes – 22,500Total attributable lead production tonnes – 8,300(1)In <strong>2012</strong> Amapá has been reclassified from Iron Ore and Manganese to Other Mining and Industrial to align with internal management reporting. Comparatives have been reclassified to alignwith current presentation.(2)The Group sold its interest in Scaw Metals in November <strong>2012</strong>.(3)The Group sold its interest in Lisheen and Black Mountain in February 2011.234 <strong>Anglo</strong> <strong>American</strong> plc <strong>Annual</strong> <strong>Report</strong> <strong>2012</strong>
OTHER INFORMATIONQUARTERLY PRODUCTION STATISTICSQuarter ended% Change (Quarter ended)31 December<strong>2012</strong>30 September<strong>2012</strong>30 June<strong>2012</strong>31 March<strong>2012</strong>31 December201131 December <strong>2012</strong> v30 September <strong>2012</strong>31 December <strong>2012</strong> v31 December 2011Iron Ore and Manganese segment(tonnes)Iron ore (1)(2) 9,012,500 12,496,900 11,449,200 10,106,500 11,160,200 (28)% (19)%Manganese ore (3) 846,800 858,400 826,400 816,200 722,500 (1)% 17%Manganese alloys (3)(4) 61,200 52,000 30,200 55,000 78,000 18% (22)%Metallurgical Coal segment (tonnes)Metallurgical – Export 4,580,000 4,495,700 4,845,600 3,743,000 4,060,600 2% 13%Thermal 3,714,700 3,398,900 3,286,300 2,570,600 3,358,700 9% 11%Thermal Coal segment (tonnes) (5)Thermal – Export (RSA) 4,659,100 4,555,300 4,223,500 3,694,200 4,455,900 2% 5%Thermal – Domestic (Eskom) 8,560,600 9,056,900 8,326,200 7,762,700 9,487,000 (5)% (10)%Thermal – Domestic (non-Eskom) 1,594,500 1,530,500 1,560,900 1,533,200 1,390,100 4% 15%Metallurgical – Domestic – – 15,700 58,400 84,500 – (100)%Thermal – Export (Colombia) 2,661,700 2,829,400 3,104,700 2,953,000 2,752,700 (6)% (3)%Copper segment (tonnes) (6) 172,900 157,300 161,100 168,400 170,000 10% 2%Nickel segment (tonnes) (7)(8) 7,400 9,000 10,900 12,000 9,900 (18)% (25)%Platinum segmentPlatinum (troy ounces) 703,800 649,000 623,000 402,800 710,000 8% (1)%Palladium (troy ounces) 413,300 392,100 355,500 235,000 392,700 5% 5%Rhodium (troy ounces) 91,200 90,500 75,100 53,900 96,800 1% (6)%Copper (tonnes) 2,500 2,700 3,300 2,900 2,900 (7)% (14)%Nickel (tonnes) 3,900 3,700 5,400 4,700 5,100 5% (24)%Gold (troy ounces) 18,600 38,500 24,100 24,000 28,000 (52)% (34)%Equivalent refined platinum (troy ounces) 416,000 626,300 583,600 593,200 583,200 (34)% (29)%Diamonds segment (De Beers)(diamonds recovered – carats)100% basisDiamonds (9) 8,051,000 6,375,000 7,241,000 6,208,000 6,491,000 26% 24%Other Mining and Industrial segment(tonnes) (10)Phosphates 302,300 292,300 271,500 246,900 274,900 3% 10%Niobium 1,000 1,100 1,200 1,100 1,000 (9)% –Iron ore (2) 1,498,000 1,534,300 1,468,000 1,572,000 1,267,100 (2)% 18%Coal production by commodity (tonnes)Metallurgical 4,580,000 4,495,700 4,861,300 3,801,400 4,145,100 2% 10%Thermal (excluding RSA domestic) 11,035,500 10,783,600 10,614,500 9,217,800 10,567,300 2% 4%RSA domestic thermal 10,155,100 10,587,400 9,887,100 9,295,900 10,877,100 (4)% (7)%(1)Kolomela commenced commercial production on 1 December 2011. Revenue and related costs associated with 984,700 tonnes of production were capitalised for the year ended31 December 2011.(2)In <strong>2012</strong> Amapá has been reclassified from Iron Ore and Manganese to Other Mining and Industrial to align with internal management reporting. Comparatives have been reclassified to align withcurrent presentation.(3)Saleable production.(4)Production includes Medium Carbon Ferro Manganese.(5)Zibulo commenced commercial production on 1 October 2011. Revenue and related costs associated with 2,155,200 tonnes of production were capitalised before commercial production wasreached in 2011. This included Eskom coal production of 633,400 tonnes and export thermal coal production of 1,521,800 tonnes.(6)Excludes Platinum copper production.(7)Excludes Platinum nickel production.(8)Includes Barro Alto which is currently not in commercial production and therefore all revenue and related costs associated with 21,600 tonnes (2011: 6,200 tonnes) of production have beencapitalised.(9)On 16 August <strong>2012</strong> <strong>Anglo</strong> <strong>American</strong> completed its acquisition of an additional 40% interest in De Beers increasing <strong>Anglo</strong> <strong>American</strong>’s total shareholding to 85%. Production data is disclosedon a 100% basis. Post completion of the acquisition, De Beers Consolidated Mines and De Beers Canada are fully consolidated subsidiaries and Debswana and Namdeb are joint venturesproportionately consolidated at 19.2% and 50% respectively. Global Sightholder Sales sells a significant portion of total production on behalf of operations based on contractual agreementsin place.(10)Excludes Tarmac and Scaw Metals.Other information<strong>Anglo</strong> <strong>American</strong> plc <strong>Annual</strong> <strong>Report</strong> <strong>2012</strong> 235
OTHER INFORMATIONEXCHANGE RATES AND COMMODITY PRICESUS$ exchange rates <strong>2012</strong> 2011Year end spot pricesRand 8.47 8.11Brazilian real 2.05 1.87Sterling 0.62 0.65Australian dollar 0.96 0.98Euro 0.76 0.77Chilean peso 479 520Botswana pula 7.79 7.49Average prices for the yearRand 8.21 7.26Brazilian real 1.95 1.67Sterling 0.63 0.62Australian dollar 0.97 0.97Euro 0.78 0.72Chilean peso 486 484Botswana pula 7.61 6.82Commodity prices <strong>2012</strong> 2011Year end spot pricesIron ore (FOB Australia) (1) US$/tonne 138 127Thermal coal (FOB South Africa) (2) US$/tonne 89 105Thermal coal (FOB Australia) (2) US$/tonne 91 112Hard coking coal (FOB Australia) (3) US$/tonne 170 285Copper (4) US cents/lb 359 343Nickel (4) US cents/lb 771 829Platinum (5) US$/oz 1,533 1,388Palladium (5) US$/oz 705 636Rhodium (5) US$/oz 1,080 1,400Average market prices for the yearIron ore (FOB Australia) (1) US$/tonne 122 160Thermal coal (FOB South Africa) (2) US$/tonne 93 116Thermal coal (FOB Australia) (2) US$/tonne 94 121Hard coking coal (FOB Australia) (6) US$/tonne 210 289Copper (4) US cents/lb 361 400Nickel (4) US cents/lb 794 1,035Platinum (5) US$/oz 1,555 1,725Palladium (5) US$/oz 647 736Rhodium (5) US$/oz 1,275 2,022(1)Source: Platts.(2)Source: McCloskey.(3)Source: Represents the quarter four benchmark.(4)Source: LME daily prices.(5)Source: Johnson Matthey.(6)Source: Represents the average quarterly benchmark.236 <strong>Anglo</strong> <strong>American</strong> plc <strong>Annual</strong> <strong>Report</strong> <strong>2012</strong>
OTHER INFORMATIONSUMMARY BY BUSINESS OPERATIONRevenue (1) Underlying EBITDA (2) profit/(loss) (3)Underlying earningsUnderlying operatingUS$ million <strong>2012</strong> 2011 <strong>2012</strong> 2011 (4) <strong>2012</strong> 2011 (4) <strong>2012</strong> 2011 (4)Iron Ore and Manganese 6,403 7,643 3,198 4,586 2,949 4,400 1,037 1,457Kumba Iron Ore 5,572 6,717 3,175 4,640 2,980 4,491(6)1,085(6)1,534Iron Ore Brazil (5) – – (1) (137) (5) (141) (30) (130)Samancor 831 926 153 198 103 165 83 144Projects and corporate – – (129) (115) (129) (115)(6)(101)(6)(91)Metallurgical Coal 3,889 4,347 877 1,577 405 1,189 275 844Australia 3,657 4,068 940 1,553 519 1,188 365 850Canada 232 279 13 85 (38) 62 (27) 46Projects and corporate – – (76) (61) (76) (61) (63) (52)Thermal Coal 3,447 3,722 972 1,410 793 1,230 523 902South Africa 2,477 2,642 607 906 482 779 312 613Colombia 970 1,080 412 535 358 482 251 318Projects and corporate – – (47) (31) (47) (31) (40) (29)Copper 5,122 5,144 2,179 2,750 1,687 2,461 908 1,610<strong>Anglo</strong> <strong>American</strong> Sur 3,186 2,320 1,686 1,283 1,369 1,126 675 784<strong>Anglo</strong> <strong>American</strong> Norte 934 1,136 336 665 288 629 237 470Collahuasi 1,002 1,688 451 1,071 324 975 230 601Projects and corporate – – (294) (269) (294) (269) (234) (245)Nickel 336 488 50 84 26 57 11 23Codemin 176 203 53 46 47 40 31 35Loma de Níquel 160 285 46 86 29 66 18 29Barro Alto – – (7) (12) (8) (13) (5) (8)Projects and corporate – – (42) (36) (42) (36) (33) (33)Platinum 5,489 7,359 580 1,672 (120) 890 (225) 410Operations 5,489 7,359 656 1,734 (44) 952 (155) 469Projects and corporate – – (76) (62) (76) (62) (70) (59)Diamonds (7) 4,028 3,320 711 794 496 659 312 443Other Mining and Industrial 4,066 4,520 485 540 337 315 229 175Core 770 720 196 211 169 184 108 109Phosphates 597 571 114 158 91 134 64 78Niobium 173 149 85 55 81 52 47 33Projects and corporate – – (3) (2) (3) (2) (3) (2)Non-core 3,296 3,800 289 329 168 131 121 66Amapá (5) 327 481 89 147 54 120 27 68Tarmac (8) 2,171 2,347 148 103 73 (38) 65 (34)Scaw Metals (9) 798 931 60 67 49 37 37 25Lisheen (10) – 36 – 17 – 17 – 14Black Mountain (10) – 5 – 3 – 3 – 1Projects and corporate – – (8) (8) (8) (8) (8) (8)Exploration – – (206) (121) (206) (121) (195) (118)Corporate Activities and Unallocated Costs 5 5 (160) 56 (203) 15 (36) 37432,785 36,548 8,686 13,348 6,164 11,095 2,839 6,120(1)Revenue includes the Group’s attributable share of revenue of joint ventures and associates. Revenue for copper and zinc operations is shown after deduction of treatment and refiningcharges (TC/RCs).(2)Earnings before interest, tax, depreciation and amortisation (underlying EBITDA) is operating profit/(loss) before special items, remeasurements, depreciation and amortisation in subsidiariesand joint ventures and includes attributable share of underlying EBITDA of associates.(3)Underlying operating profit/(loss) is revenue less operating costs before special items and remeasurements, and includes the Group’s attributable share of associates’ operating profit beforespecial items and remeasurements.(4)Projects and corporate has been revised to align with internal management reporting. Comparatives have been reclassified to align with current presentation.(5)In <strong>2012</strong> Amapá has been reclassified from Iron Ore and Manganese to Other Mining and Industrial to align with internal management reporting. Comparatives have been reclassified to align withcurrent presentation.(6)Of the projects and corporate expense, $67 million (2011: $72 million) relates to Kumba Iron Ore. The total contribution from Kumba Iron Ore to the Group’s underlying earnings is $1,018 million(2011: $1,462 million) as reported in the external earnings reconciliation, see page 240.(7)On 16 August <strong>2012</strong> the Group acquired a controlling interest in De Beers (Diamonds segment). Until this date De Beers was accounted for as an associate of the Group. From 16 August <strong>2012</strong>De Beers ceased to be an associate and has been accounted for as a subsidiary of the Group.(8)In 2011 the Group sold Tarmac’s businesses in China, Turkey and Romania.(9)In November <strong>2012</strong>, the Group sold its interest in Scaw Metals.(10)In 2011 the Group sold its interests in Lisheen and Black Mountain, which comprised the remainder of the Group’s portfolio of zinc operations.Other information<strong>Anglo</strong> <strong>American</strong> plc <strong>Annual</strong> <strong>Report</strong> <strong>2012</strong> 237
OTHER INFORMATIONKEY FINANCIAL DATAUS$ million (unless otherwise stated) <strong>2012</strong> 2011 2010 2009 2008 2007 2006 (1) 2005 (1) 2004 (1)Group revenue including associates 32,785 36,548 32,929 24,637 32,964 30,559 29,404 24,872 22,610Less: Share of associates’ revenue (4,024) (5,968) (4,969) (3,779) (6,653) (5,089) (4,413) (4,740) (5,429)Group revenue 28,761 30,580 27,960 20,858 26,311 25,470 24,991 20,132 17,181Underlying operating profit including associates beforespecial items and remeasurements 6,164 11,095 9,763 4,957 10,085 9,590 8,888 5,549 3,832Special items and remeasurements (excluding financing and taxspecial items and remeasurements) (5,757) (44) 1,727 (208) (330) (227) 24 16 556Net finance costs (including financing special items andremeasurements), tax and non-controlling interests of associates (269) (452) (423) (313) (783) (434) (398) (315) (391)Total profit from operations and associates 138 10,599 11,067 4,436 8,972 8,929 8,514 5,250 3,997Net finance (costs)/income (including financing special itemsand remeasurements) (377) 183 (139) (407) (401) (108) (71) (220) (385)(Loss)/profit before tax (239) 10,782 10,928 4,029 8,571 8,821 8,443 5,030 3,612Income tax expense (including special items and remeasurements) (375) (2,860) (2,809) (1,117) (2,451) (2,693) (2,518) (1,208) (765)(Loss)/profit for the financial year – continuing operations (614) 7,922 8,119 2,912 6,120 6,128 5,925 3,822 2,847Profit for the financial year – discontinued operations – – – – – 2,044 997 111 1,094(Loss)/profit for the financial year – total Group (614) 7,922 8,119 2,912 6,120 8,172 6,922 3,933 3,941Non-controlling interests (879) (1,753) (1,575) (487) (905) (868) (736) (412) (440)(Loss)/profit attributable to equity shareholders ofthe Company (1,493) 6,169 6,544 2,425 5,215 7,304 6,186 3,521 3,501Underlying earnings (2) – continuing operations 2,839 6,120 4,976 2,569 5,237 5,477 5,019 3,335 2,178Underlying earnings (2) – discontinued operations – – – – – 284 452 401 506Underlying earnings (2) – total Group 2,839 6,120 4,976 2,569 5,237 5,761 5,471 3,736 2,684(Loss)/earnings per share (US$) – continuing operations (1.19) 5.10 5.43 2.02 4.34 4.04 3.51 2.35 1.84Earnings per share (US$) – discontinued operations – – – – – 1.54 0.70 0.08 0.60(Loss)/earnings per share (US$) – total Group (1.19) 5.10 5.43 2.02 4.34 5.58 4.21 2.43 2.44Underlying earnings per share (US$) – continuing operations 2.26 5.06 4.13 2.14 4.36 4.18 3.42 2.30 1.52Underlying earnings per share (US$) – discontinued operations – – – – – 0.22 0.31 0.28 0.35Underlying earnings per share (US$) – total Group 2.26 5.06 4.13 2.14 4.36 4.40 3.73 2.58 1.87Ordinary dividend per share (US cents) 85.0 74.0 65.0 – 44.0 124.0 108.0 90.0 70.0Special dividend per share (US cents) – – – – – – 67.0 33.0 –Weighted average basic number of shares outstanding (million) 1,254 1,210 1,206 1,202 1,202 1,309 1,468 1,447 1,434Underlying EBITDA (3) – continuing operations 8,686 13,348 11,983 6,930 11,847 11,171 10,431 7,172 5,359Underlying EBITDA (3) – discontinued operations – – – – – 961 1,766 1,787 1,672Underlying EBITDA (3) – total Group 8,686 13,348 11,983 6,930 11,847 12,132 12,197 8,959 7,031Underlying EBITDA interest cover (4) – total Group 61.2 n/a 42.0 27.4 28.3 42.0 45.5 20.0 18.5Operating margin (before special items and remeasurements) –total Group 18.8% 30.4% 29.6% 20.1% 30.6% 28.4% 25.4% 18.5% 14.7%Ordinary dividend cover (based on underlying earnings per share) –total Group 2.7 6.8 6.4 – 9.9 3.5 3.5 2.9 2.7Balance sheetIntangible assets and property, plant and equipment 49,660 42,871 42,126 37,974 32,551 25,090 25,632 33,368 35,816Other non-current assets and investments (5) 8,512 10,269 9,852 7,303 7,607 9,271 8,258 5,585 5,547Working capital 3,744 2,093 2,385 2,168 861 1,966 3,096 3,538 3,543Other net current liabilities (5) (990) (1,683) (785) (272) (840) (911) (1,430) (1,429) (611)Other non-current liabilities and obligations (5) (10,710) (9,220) (8,757) (8,487) (7,567) (6,387) (5,826) (8,491) (8,339)Cash and cash equivalents and borrowings (6) (8,660) (1,141) (7,038) (11,046) (11,051) (5,170) (3,244) (4,993) (8,243)Net assets classified as held for sale 2,231 – 188 429 195 471 641 – –Net assets 43,787 43,189 37,971 28,069 21,756 24,330 27,127 27,578 27,713Non-controlling interests (6,130) (4,097) (3,732) (1,948) (1,535) (1,869) (2,856) (3,957) (4,588)Equity attributable to equity shareholders of the Company 37,657 39,092 34,239 26,121 20,221 22,461 24,271 23,621 23,125Total capital (7) 52,402 44,563 45,355 39,349 33,096 29,181 30,258 32,558 35,806Cash flows from operations – continuing operations 7,021 11,498 9,924 4,904 9,579 9,375 9,012 5,963 3,857Cash flows from operations – discontinued operations – – – – – 470 1,045 1,302 1,434Cash flows from operations – total Group 7,021 11,498 9,924 4,904 9,579 9,845 10,057 7,265 5,291Dividends received from associates and financial assetinvestments – continuing operations 340 403 285 639 659 311 251 468 380Dividends received from associates and financial assetinvestments – discontinued operations – – – – – 52 37 2 16Dividends received from associates and financial assetinvestments – total Group 340 403 285 639 659 363 288 470 396Return on capital employed (8) – total Group 13.3% 26.5% 24.8% 14.4% 36.9% 38.0% 32.6% 18.8% 16.9%EBITDA/average total capital (7) – total Group 17.9% 29.7% 28.3% 19.1% 38.0% 40.8% 38.8% 26.2% 21.3%Net debt to total capital (gearing) (9) 16.4% 3.1% 16.3% 28.7% 34.3% 16.6% 10.3% 15.3% 22.6%(1)Comparatives for 2006, 2005 and 2004 were adjusted in the 2007 <strong>Annual</strong> <strong>Report</strong> to reclassify amounts relating to discontinued operations where applicable.(2)Underlying earnings is profit attributable to equity shareholders of the Company before special items and remeasurements and is therefore presented after net finance costs, income tax andnon-controlling interests.(3)Underlying EBITDA is operating profit before special items and remeasurements, depreciation and amortisation in subsidiaries and joint ventures and includes attributable share of EBITDAof associates.(4)Underlying EBITDA interest cover is underlying EBITDA divided by net finance costs, excluding other net financial income, exchange gains and losses on monetary assets and liabilities,unwinding of discount relating to provisions and other liabilities, financing special items and remeasurements, and including attributable share of associates’ net interest expense, which in 2011resulted in a net finance income and therefore the ratio is not applicable.(5)Comparatives for 2008, 2007, 2006 and 2005 were adjusted in the 2009 <strong>Annual</strong> <strong>Report</strong> in accordance with IAS 1 Presentation of Financial Statements – Improvements to reclassify non-hedgederivatives whose expected settlement date was more than one year from the period end from current to non-current.(6)This differs from the Group’s measure of net debt as it excludes the net cash/(debt) of disposal groups (<strong>2012</strong>: $213 million; 2011: nil; 2010: $59 million; 2009: $48 million; 2008: $8 million;2007: $(69) million; 2006: $(80) million; 2005: nil; 2004: nil) and excludes related hedges (<strong>2012</strong>: net liabilities of $168 million; 2011: net liabilities of $233 million; 2010: net liabilities of$405 million; 2009: net liabilities of $285 million; 2008: net liabilities of $297 million; 2007: net assets of $388 million; 2006: net assets of $193 million; 2005: nil; 2004: nil). See note 31 to thefinancial statements.(7)Total capital is net assets excluding net debt.(8)Return on capital employed is calculated as total operating profit before impairments for the year divided by the average of total capital less other investments and adjusted for impairments.(9)Net debt to total capital is calculated as net debt (including related hedges) divided by total capital. Comparatives are presented on a consistent basis.238 <strong>Anglo</strong> <strong>American</strong> plc <strong>Annual</strong> <strong>Report</strong> <strong>2012</strong>
OTHER INFORMATIONNON-FINANCIAL DATA<strong>2012</strong> 2011 2010 2009 2008Safety (1)Work-related fatalities 13 17 15 20 28Fatal-injury frequency rate (FIFR) (2) 0.008 0.009 0.008 0.010 0.015Total recordable case frequency rate (TRCFR) (3) 1.29 2.01 1.44 1.81 2.27Lost time injury frequency rate (LTIFR) (4) 0.60 0.64 0.64 0.76 1.04Lost time injury severity rate (LTISR) (5) 223 220 229 226 240Occupational health (1)New cases of occupational disease (NCOD) (6) 170 197 268 489 132Occupational disease incidence rate (per 200,000 hours) (ODIR) 0.189 0.205 0.284 0.483 0.126Environment (1)Total CO 2emissions (Mt CO 2e) 18 19 20 19 19Total energy consumed (million GJ) (7) 108 102 100 106 102Water used for primary activities (million m 3 ) (8) 122 115 115 125 124Human Resources (1)(9)Women in management (%) (10) 23 22 21 19 17Historically Disadvantaged South Africans in management (%) (11) 62 51 46 46 45Resignations (%) (12) 2.4 2.7 2.4 2.4 3.8Redundancies (%) (13) 0.6 1.4 2.1 3.8 0.6Dismissals (%) (14) 1.4 1.1 1.3 2.0 2.6Other reasons for leaving (%) (15) 2.4 0.3 2.8 4.9 2.0Social (1)CSI spend (total in US$ million) (16) 154 129 112 83 76CSI spend (% of pre-tax profit) 3 1 1 2 1Procurement: BEE spend (rand billion) 25.8 23.3 20.9 23.5 24.6Businesses supported through enterprise development initiatives 17,598 38,681 9,392 3,720 3,012Jobs created/maintained through enterprise development programmes 64,927 47,070 17,200 12,982 13,431(1)With the exception of Social, which includes the results of De Beers from the date of acquisition, the data includes wholly owned subsidiaries and joint ventures over which <strong>Anglo</strong> <strong>American</strong> hasmanagement control, and does not include De Beers or other non-managed operations such as Collahuasi, Carbones del Cerrejón and Samancor.(2)FIFR is calculated as the number of fatal injuries to employees or contractors per 200,000 hours worked.(3)TRCFR is the number of fatal injuries, lost time injuries and medical treatment cases for employees or contractors per 200,000 hours.(4)LTIFR is the number of lost time injuries (LTIs) per 200,000 hours worked. An LTI is an occupational injury which renders the person unable to perform his/her regular duties for one full shift ormore, the day after the injury was incurred, whether a scheduled workday or not.(5)LTISR is the number of lost days and restricted workdays per 200,000 hours worked.(6)NCOD is the sum of occupational diseases due to asbestosis, NIHL, silicosis, coal-workers’ pneumoconiosis, pneumoconiosis due to other fibrogenic diseases, chronic obstructive airwaysdisease, occupational tuberculosis, occupational asthma, HAVs, musculoskeletal disorders, dermatitis, occupational cancers and other occupational diseases.(7)Total amount of energy consumed is the sum of total energy from electricity purchased, total energy from fossil fuels and total energy from renewable fuels.(8)Total amount of water used for primary activities is the total new or make-up water entering the operation and used for the operation’s primary operational activities.(9)Excludes Other Mining and Industrial Non-core operations.(10)Women in management is the percentage of female managers as a percentage of all females in the workforce excluding contractors.(11)Historically Disadvantaged South Africans in management is the percentage of managers at <strong>Anglo</strong> <strong>American</strong> in South Africa who are ‘Historically Disadvantaged South Africans’.(12)The number of people who resigned as a percentage of the total workforce excluding contractors.(13)The number of people who have been retrenched as a percentage of total workforce excluding contractors.(14)The number of people who have been dismissed or have resigned to avoid dismissal, as a percentage of total workforce excluding contractors.(15)The number of people who left for reasons other than those shown above, for example retirement, ill health and death, as a percentage of total workforce excluding contractors.(16)CSI spend is the sum of donations for charitable purposes and community investment (which includes cash and in-kind donations and staff time) as well as investments in commercial initiativeswith public benefit (such as enterprise development).Other information<strong>Anglo</strong> <strong>American</strong> plc <strong>Annual</strong> <strong>Report</strong> <strong>2012</strong> 239
OTHER INFORMATIONRECONCILIATION OF SUBSIDIARIES’ REPORTED EARNINGS TOTHE UNDERLYING EARNINGS INCLUDED IN THE CONSOLIDATEDFINANCIAL STATEMENTSfor the year ended 31 December <strong>2012</strong>Note only key reported lines are reconciled.Kumba Iron Ore LimitedUS$ million <strong>2012</strong> 2011IFRS headline earnings 1,499 2,366Exploration 16 4Kumba Envision Trust (1) 53 –Other adjustments 3 31,571 2,373Non-controlling interests (2) (500) (826)Elimination of intercompany interest 4 (27)Depreciation on assets fair valued on acquisition (net of tax) (8) (9)Corporate cost allocation (49) (49)Contribution to <strong>Anglo</strong> <strong>American</strong> underlying earnings 1,018 1,462(1)The Kumba Envision Trust charge is included in IFRS headline earnings but is an operating special item so is excluded from underlying earnings.(2)On 20 July <strong>2012</strong> <strong>Anglo</strong> <strong>American</strong> increased its shareholding in Kumba Iron Ore Limited by 4.5% through the exercise of options acquired in 2011 and <strong>2012</strong>, thereby increasing its shareholdingfrom 65.2% to 69.7% for a total cost of $948 million.<strong>Anglo</strong> <strong>American</strong> Platinum LimitedUS$ million <strong>2012</strong> 2011IFRS headline (loss)/earnings (170) 527Exploration 4 5Operating and financing remeasurements (net of tax) 2 (27)Restructuring costs included in headline earnings (net of tax) – 6BEE transactions and related charges – 141(164) 652Non-controlling interests 33 (132)Elimination of intercompany interest 10 (1)Depreciation on assets fair valued on acquisition (net of tax) (41) (55)Corporate cost allocation (63) (54)Contribution to <strong>Anglo</strong> <strong>American</strong> underlying earnings (225) 410240 <strong>Anglo</strong> <strong>American</strong> plc <strong>Annual</strong> <strong>Report</strong> <strong>2012</strong>
OTHER INFORMATIONRECONCILIATION OF DE BEERS’ REPORTED EARNINGS TO THE AMOUNTSINCLUDED IN THE CONSOLIDATED FINANCIAL STATEMENTSfor the year ended 31 December <strong>2012</strong>On 16 August <strong>2012</strong> the Group acquired an additional 40% interest in De Beers, increasing its shareholding to 85%, and has consolidated 100% of the assetsand liabilities of De Beers from this date. In accordance with IFRS the Group is required to fair value 100% of the assets and liabilities acquired based on thepurchase consideration for the 40% acquired. As a result the Group has:• Recognised a fair value uplift of $2,017 million relating to its existing 45% shareholding, with a corresponding special item (remeasurement) gain in theincome statement. The additional depreciation arising as a result of the fair value uplifts on the Group’s existing 45% shareholding has also been recognisedas a special item (remeasurement) and amounted to $41 million in <strong>2012</strong> and is estimated to be $125 million in 2013.• Recognised fair value uplifts associated with the additional 55% to be consolidated, including the Government of Botswana’s 15% non-controlling interest.The additional depreciation and amortisation charge reduced operating profit by $50 million in <strong>2012</strong> and is estimated to be $150 million in 2013. Theadditional depreciation and amortisation charge reduced underlying earnings by $32 million in <strong>2012</strong> and is estimated to reduce underlying earnings by$100 million in 2013.The following tables reconcile the earnings and capital expenditure of De Beers to the amounts included in the Group’s Consolidated financial statements andillustrate the earnings impact of the requirement to fair value assets and liabilities acquired.De Beers(100%)<strong>2012</strong> 2011<strong>Anglo</strong><strong>American</strong>share (1)De Beers(100%)<strong>Anglo</strong><strong>American</strong>share (1)US$ millionUnderlying EBITDA (including associates) 1,075 711 1,763 794Underlying operating profit 815 496 1,491 659Underlying earnings (2) 506 312 993 443Capital expenditure 249 94 260 –(1)Amounts based on the Group’s 45% shareholding to 16 August <strong>2012</strong> and a 100% basis thereafter. Underlying earnings from 16 August <strong>2012</strong> excludes the 15% non-controlling interest.(2)See reconciliation below.US$ million <strong>2012</strong> 2011Underlying earnings (1)De Beers underlying earnings 506 993<strong>Anglo</strong> <strong>American</strong> share (45% prior to 16 August <strong>2012</strong>) 153 447<strong>Anglo</strong> <strong>American</strong> share (100% from 16 August <strong>2012</strong>) 166 –Fair value adjustments on acquisition (2) 18 –Depreciation on assets fair valued on acquisition (3) (44) –Exploration 23 –163 –Non-controlling interest (18) –Intercompany interest 14 –Corporate cost allocation (7) –Other 7 (4)159 (4)Contribution to <strong>Anglo</strong> <strong>American</strong> underlying earnings 312 443Operating special itemsDepreciation of fair value uplifts on existing assets (4) 41 –Reversal of uplift on inventory (5) 421 –(1)Debswana is a joint venture between De Beers and the Government of Botswana in which each shareholder has a 50% equity share. The joint venture arrangements provide De Beers with aneconomic interest in Debswana that is based on 19.2% of profits before deducting taxes and royalties paid by the joint venture. Consistent with these arrangements, De Beers proportionatelyconsolidates 19.2% of Debswana’s earnings (before taxes and royalties) in line with the Group’s policy on accounting for joint ventures. As De Beers’ share of earnings is based on profits beforetaxes and royalties, an effective tax rate of nil arises on the earnings of the joint venture in the Group’s Consolidated financial statements.(2)Relates to assets fair valued on acquisition where the treatment in De Beers’ underlying financial statements post-acquisition is already reflected in the Group’s financial statements.(3)Excludes the depreciation of fair value uplifts on the Group’s previously held 45% equity interest.(4)Relates to the depreciation of fair value uplifts on the Group’s previously held 45% equity interest upon obtaining a controlling interest.(5)Inventory held by De Beers at the date of the acquisition is required to be recognised at fair value under IFRS. This results in negligible margins upon the subsequent sale of inventory held at thedate of the acquisition. The impact of fair value uplifts on inventory has been excluded from the Group’s underlying earnings so as not to distort the operating margins of De Beers and to providemore useful information about the performance of the Group.Other information<strong>Anglo</strong> <strong>American</strong> plc <strong>Annual</strong> <strong>Report</strong> <strong>2012</strong> 241
OTHER INFORMATIONTHE BUSINESS – AN OVERVIEWas at 31 December <strong>2012</strong>Iron Ore and ManganeseKumba Iron Ore (South Africa) 69.7%Minas-Rio (Brazil) 100%LLX Minas-Rio (Brazil) (1) 49%Samancor (South Africa and Australia) 40%Metallurgical Coal Overall ownership: 100%100% owned Other interestsAustraliaAustraliaCallide Drayton 88.2%Moranbah North 88%Australia – other Dartbrook 83.3%Monash Energy Holdings Ltd German Creek (2) 70%Foxleigh 70%Canada Dawson 51%Peace River Coal Jellinbah 23.3%Australia – otherDalrymple Bay Coal Terminal Pty Ltd 25.4%Newcastle Coal Shippers Pty Ltd 17.6%MBD Energy Ltd 19.2%Thermal Coal Overall ownership: 100%100% owned Other interestsSouth AfricaSouth AfricaGoedehoop Mafube 50%Greenside Phola plant 50%Isibonelo Kriel (3) 73%Kleinkopje Zibulo (3) 73%LandauNew DenmarkSouth Africa – otherNew Vaal Richards Bay Coal Terminal 24.2%ColombiaCarbones del Cerrejón 33.3%Copper Overall ownership: 100%100% owned Other interestsPeruChileMichiquillay Chagres 50.1%El Soldado 50.1%Chile Los Bronces 50.1%Mantos Blancos (4) Collahuasi 44%Mantoverde (4)South AfricaPalabora 16.8%PeruQuellaveco 81.9%USPebble 50%Nickel Overall ownership: 100%100% owned Other interestsBrazilVenezuelaCodemin Loma de Níquel 91.4%Barro Alto(1)Owns the port of Açu (currently under construction).(2)The German Creek operation includes both Capcoal Open Cut and Underground operations.(3)Kriel and Zibulo form part of the <strong>Anglo</strong> <strong>American</strong> Inyosi Coal black economic empowerment (BEE) company of which <strong>Anglo</strong> <strong>American</strong> owns 73%.(4)Non-controlling interest of 0.018%.242 <strong>Anglo</strong> <strong>American</strong> plc <strong>Annual</strong> <strong>Report</strong> <strong>2012</strong>
Platinum Overall ownership: 79.9%100% owned Other interestsSouth AfricaSouth AfricaBathopele Mine Union Section 85%Khomanani Mine Masa Chrome Company 74%Thembelani MineKhuseleka MineJoint ventures or sharing agreementsSiphumelele Mine Modikwa Platinum Joint Venture 50%Tumela Mine Kroondal Pooling and Sharing Agreement 50%Dishaba Mine Marikana Pooling and Sharing Agreement 50%Mogalakwena Mine Mototolo Joint Venture 50%Western Limb Tailings RetreatmentWaterval Smelter (including converting process)AssociatesMortimer Smelter Bokoni 49%Polokwane Smelter Pandora 42.5%Rustenburg Base Metals Refinery Bafokeng-Rasimone 33%Precious Metals Refinery Atlatsa Resources Corporation (1) 27%Twickenham Mine Johnson Matthey Fuel Cells 17.5%ZimbabweSouth Africa – otherUnki Mine Wesizwe Platinum Limited 13%Royal Bafokeng Platinum Limited 12.6%De Beers Overall ownership: 85%100% owned Other interestsSouth AfricaCanadaDe Beers Group ServicesDe Beers Canada(Exploration and Services)Snap LakeDe Beers MarineVictorSynthetic Diamond SupermaterialsElement Six TechnologiesSalesGlobal Sightholder SalesAuction SalesBrandsForevermarkSouth AfricaDe Beers ConsolidatedMines 74% (2)VenetiaVoorspoedNamaqualand Mines (3)Kimberley MinesBotswanaDebswana 50%DamtshaaJwanengOrapaLetlhakaneNamibiaNamdeb Holdings (4) 50%Namdeb Diamond CorporationMining Area 1Orange RiverElizabeth BayAlluvial ContractorsDebmarine NamibiaAtlantic 1SalesDTC Botswana 50%Namibia DTC 50%Synthetic Diamond SupermaterialsElement Six Abrasives 60%BrandsDe Beers Diamond Jewellers 50%Other Mining and Industrial100% owned Other interestsPhosphatesIron ore<strong>Anglo</strong> <strong>American</strong> Fosfatos Brasil Limitada Amapá (Brazil) 70%NiobiumAggregates and Building Materials<strong>Anglo</strong> <strong>American</strong> Nióbio Brasil Limitada Tarmac Middle East 50%Aggregates and Building MaterialsTarmac Quarry MaterialsTarmac Building ProductsOther (5)100% owned Other interestsVergelegen (South Africa) Exxaro Resources (southern Africa and Australia) 9.8%(1)Anooraq Resources Corporation changed its name to Atlatsa Resources Corporation in <strong>2012</strong>.(2)De Beers’ 74% interest represents its legal ownership share in De Beers Consolidated Mines (DBCM). For accounting purposes De Beers consolidates 100% of DBCM as it is deemed to controlthe BEE entity which holds the remaining 26% after providing certain financial guarantees on its behalf during 2010.(3)In May 2011 De Beers announced that it had entered into an agreement to sell Namaqualand Mines.(4)In November 2011 the Government of the Republic of Namibia and De Beers restructured their mining partnership, creating a 50:50 holding company, Namdeb Holdings (Pty) Limited, withfull ownership of Namdeb Diamond Corporation (Pty) Limited and De Beers Marine Namibia (Pty) Limited (now trading as Debmarine Namibia). All mining licences were transferred to thenewly formed company.(5)Included within Corporate Activities and Unallocated Costs segment.Other information<strong>Anglo</strong> <strong>American</strong> plc <strong>Annual</strong> <strong>Report</strong> <strong>2012</strong> 243
OTHER INFORMATIONSHAREHOLDER INFORMATION<strong>Annual</strong> General MeetingWill be held at 2:00pm on Friday 19 April 2013, at The Queen Elizabeth IIConference Centre, Broad Sanctuary, Westminster, London SW1P 3EE.Shareholders’ diary 2013/14Interim results announcement July 2013<strong>Annual</strong> results announcement February 2014<strong>Annual</strong> <strong>Report</strong> March 2014<strong>Annual</strong> General Meeting April 2014Shareholding enquiriesEnquiries relating to shareholdings should be made to the Company’s UKRegistrars, Equiniti, or the South African Transfer Secretaries, Link MarketServices South Africa (Pty) Limited, at the relevant address below:UK RegistrarsEquinitiAspect HouseSpencer RoadLancingWest Sussex BN99 6DAEnglandTelephone:In the UK: 0871 384 2026*From outside the UK: +44 121 415 7558Transfer Secretaries in South AfricaLink Market Services South Africa (Pty) Limited13th Floor, Rennie House19 Ameshoff StreetBraamfontein 2001, South Africa(PO Box 4844, Johannesburg, 2000)Telephone: +27 (0) 11 713 0800Enquiries on other matters should be addressed to the Company Secretaryat the following address:Registered and Head Office<strong>Anglo</strong> <strong>American</strong> plc20 Carlton House TerraceLondon SW1Y 5ANEnglandTelephone: +44 (0) 20 7968 8888Fax: +44 (0) 20 7968 8500Registered number: 3564138www.angloamerican.comAdditional information on a wide range of shareholder services can be foundin the Shareholder Information section of the Notice of AGM and on theGroup’s website.* Calls to all 0871 numbers stated in this notice are charged at 8p per minute plus networkextras. Lines are open 8:30am to 5:30pm Monday to Friday.244 <strong>Anglo</strong> <strong>American</strong> plc <strong>Annual</strong> <strong>Report</strong> <strong>2012</strong>
OTHER INFORMATIONOTHER ANGLO AMERICAN PUBLICATIONS• <strong>2012</strong>/13 Fact Book• Notice of 2013 AGM and Shareholder Information Booklet• Sustainable Development <strong>Report</strong> <strong>2012</strong>• Business Unit Sustainable Development <strong>Report</strong>s (<strong>2012</strong>)• Optima – <strong>Anglo</strong> <strong>American</strong>’s current affairs journal• Good Citizenship: Business Principles• The Environment Way• The Occupational Health Way• The Projects Way• The Safety Way• The Social Way• The People Development Way• www.facebook.com/angloamerican• https://twitter.com/angloamerican• www.youtube.com/angloamerican• www.flickr.com/angloamerican• www.slideshare.com/angloamericanThe Company implemented electronic communications in 2008 in order toreduce the financial and environmental costs of producing the <strong>Annual</strong> <strong>Report</strong>.More information about this can be found in the attached Notice of AGM.In this regard we would encourage downloading of reports from our website.Financial and sustainable development reports may be found at:www.angloamerican.com/reportingcentreHowever, the <strong>2012</strong> <strong>Annual</strong> <strong>Report</strong> and the booklet containing the Notice ofAGM and other shareholder information are available free of charge from theCompany, its UK Registrars and the South African Transfer Secretaries.If you would like to receive paper copies of <strong>Anglo</strong> <strong>American</strong>’s publications,please write to:Investor Relations<strong>Anglo</strong> <strong>American</strong> plc20 Carlton House TerraceLondon SW1Y 5ANEnglandAlternatively, publications can be ordered online at:www.angloamerican.com/siteservices/requestreportCharitable partnersThis is just a selection of the charities which <strong>Anglo</strong> <strong>American</strong>, <strong>Anglo</strong> <strong>American</strong>Chairman’s Fund and the <strong>Anglo</strong> <strong>American</strong> Group Foundation have workedwith in <strong>2012</strong>:Designed and producedby Salterbaxter.This document is printedon Amadeus 50 Silk andAmadeus 50 Offset which hasbeen independently certifiedaccording to the rules of theForest Stewardship Council®(FSC). All the paper in this reportcontains 50% recycled and 50%virgin fibre.The recycled fibre isbleached in a Process ChlorineFree (PCF) process and the virginfibre is Elemental Chlorine Free(ECF) bleached.Printed in the UK by Pureprintusing its alcofree® and pureprint®environmental printing technology,and vegetable inks were usedthroughout. Pureprint is aCarbonNeutral® company.Both manufacturing paper milland the printer are registered tothe Environmental ManagementSystem ISO 14001 and are ForestStewardship Council® (FSC)chain-of-custody certified.
<strong>Anglo</strong> <strong>American</strong> plc20 Carlton House TerraceLondonSW1Y 5ANEnglandTel +44 (0)20 7968 8888Fax +44 (0)20 7968 8500Registered number 3564138www.angloamerican.comFind us on FacebookFollow us on Twitter


![English PDF [ 189KB ] - Anglo American](https://img.yumpu.com/50470814/1/184x260/english-pdf-189kb-anglo-american.jpg?quality=85)


![pdf [ 595KB ] - Anglo American](https://img.yumpu.com/49420483/1/184x260/pdf-595kb-anglo-american.jpg?quality=85)
![pdf [ 1.1MB ] - Anglo American](https://img.yumpu.com/49057963/1/190x240/pdf-11mb-anglo-american.jpg?quality=85)

