DSTL (PDF) - Cham
DSTL (PDF) - Cham
DSTL (PDF) - Cham
SHOW LESS

You also want an ePaper? Increase the reach of your titles
YUMPU automatically turns print PDFs into web optimized ePapers that Google loves.
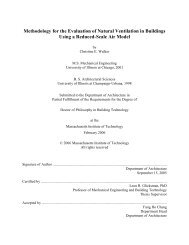
Figure 4. (Top) CFD wave evolution for initial 70m wave and (bottom) 100m wave.The time interval between each profile is 1250s. The thick dashed line represents thesea bed. Note the elevation waves appearing in 175m to 190m depth (measurementsrecord the appearance of elevation waves between 150m to 180m depth).10