Traffic-induced building vibrations in Montréal - National Research ...
Traffic-induced building vibrations in Montréal - National Research ...
Traffic-induced building vibrations in Montréal - National Research ...

Create successful ePaper yourself
Turn your PDF publications into a flip-book with our unique Google optimized e-Paper software.
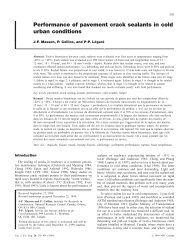
740Can. J. Civ. Eng. Vol. 24, 1997Fig. 2. Typical acceleration signals <strong><strong>in</strong>duced</strong> by (a) emptybusand(b) loaded truck at 50 km/h.us<strong>in</strong>g digital filters of the recursive type, which conform tospecifications of band-limit<strong>in</strong>g and band-pass filters for frequencyweight<strong>in</strong>gs W xy and W z per ISO 8041 (ISO 1990b) <strong>in</strong>the horizontal and vertical directions, respectively (see Al-Hunaidiand Guan (1996) for details). Root-mean-square values of frequency-weightedacceleration signals were then calculated us<strong>in</strong>gthe same <strong>in</strong>tegration time and discard<strong>in</strong>g the same numberof <strong>in</strong>itial averages as for the 1/3 octave band analysis describedabove.Narrow-band frequency analysisNarrow-band frequency analysis us<strong>in</strong>g the fast Fourier transform(FFT) was performed <strong>in</strong> order to resolve <strong>in</strong> detail thefrequency content of the measured vibration signals. Thenumber of po<strong>in</strong>ts used <strong>in</strong> FFT calculations was large enough toconta<strong>in</strong> the major part of the signal. This elim<strong>in</strong>ated the needfor smooth<strong>in</strong>g w<strong>in</strong>dows, hence avoid<strong>in</strong>g difficulties associatedwith these w<strong>in</strong>dows <strong>in</strong> the analysis of transient signals (Al-Hunaidiet al. 1994).Transfer functionsTransfer functions (i.e., ratios) between different measurementpo<strong>in</strong>ts were calculated for both the 1/3 octave band and frequency-weightedacceleration values. Transfer functions werefirst calculated for acceleration values obta<strong>in</strong>ed for each vehiclepass-by. Then a mean value was calculated from threevehicle pass-bys for the same test.It should be noted that unlike transfer functions obta<strong>in</strong>edfrom usual spectral analysis methods, the method describedabove does not provide a measure for judg<strong>in</strong>g whether the <strong>vibrations</strong>ignals at the two particular po<strong>in</strong>ts used <strong>in</strong> the transferfunction calculation are coherent, i.e., generated by the samesource. In this study, coherence between vibration signals wasverified <strong>in</strong> two ways. First, a comparison was made betweenambient vibration values and those due to test vehicles. In thefrequency range of 8 to 25 Hz it was found that <strong>vibrations</strong> <strong><strong>in</strong>duced</strong>by test vehicles are much higher than ambient <strong>vibrations</strong>;elsewhere this was not so. This was taken as an <strong>in</strong>dication ofcoherent signals only for 1/3 octave frequency bands from 8 to25 Hz. Second, <strong>in</strong> the frequency range for 1/3 octave frequencybands between 8 and 25 Hz, the m<strong>in</strong>imum and maximum oftransfer functions obta<strong>in</strong>ed for each band from three test repetitionswere compared. In most cases, there were <strong>in</strong>significantdifferences and aga<strong>in</strong> this was taken as an <strong>in</strong>dication of coherencebetween the signals <strong>in</strong> the said frequency range.© 1997 NRC Canada