Traffic-induced building vibrations in Montréal - National Research ...
Traffic-induced building vibrations in Montréal - National Research ...
Traffic-induced building vibrations in Montréal - National Research ...

You also want an ePaper? Increase the reach of your titles
YUMPU automatically turns print PDFs into web optimized ePapers that Google loves.
740Can. J. Civ. Eng. Vol. 24, 1997Fig. 2. Typical acceleration signals <strong><strong>in</strong>duced</strong> by (a) emptybusand(b) loaded truck at 50 km/h.us<strong>in</strong>g digital filters of the recursive type, which conform tospecifications of band-limit<strong>in</strong>g and band-pass filters for frequencyweight<strong>in</strong>gs W xy and W z per ISO 8041 (ISO 1990b) <strong>in</strong>the horizontal and vertical directions, respectively (see Al-Hunaidiand Guan (1996) for details). Root-mean-square values of frequency-weightedacceleration signals were then calculated us<strong>in</strong>gthe same <strong>in</strong>tegration time and discard<strong>in</strong>g the same numberof <strong>in</strong>itial averages as for the 1/3 octave band analysis describedabove.Narrow-band frequency analysisNarrow-band frequency analysis us<strong>in</strong>g the fast Fourier transform(FFT) was performed <strong>in</strong> order to resolve <strong>in</strong> detail thefrequency content of the measured vibration signals. Thenumber of po<strong>in</strong>ts used <strong>in</strong> FFT calculations was large enough toconta<strong>in</strong> the major part of the signal. This elim<strong>in</strong>ated the needfor smooth<strong>in</strong>g w<strong>in</strong>dows, hence avoid<strong>in</strong>g difficulties associatedwith these w<strong>in</strong>dows <strong>in</strong> the analysis of transient signals (Al-Hunaidiet al. 1994).Transfer functionsTransfer functions (i.e., ratios) between different measurementpo<strong>in</strong>ts were calculated for both the 1/3 octave band and frequency-weightedacceleration values. Transfer functions werefirst calculated for acceleration values obta<strong>in</strong>ed for each vehiclepass-by. Then a mean value was calculated from threevehicle pass-bys for the same test.It should be noted that unlike transfer functions obta<strong>in</strong>edfrom usual spectral analysis methods, the method describedabove does not provide a measure for judg<strong>in</strong>g whether the <strong>vibrations</strong>ignals at the two particular po<strong>in</strong>ts used <strong>in</strong> the transferfunction calculation are coherent, i.e., generated by the samesource. In this study, coherence between vibration signals wasverified <strong>in</strong> two ways. First, a comparison was made betweenambient vibration values and those due to test vehicles. In thefrequency range of 8 to 25 Hz it was found that <strong>vibrations</strong> <strong><strong>in</strong>duced</strong>by test vehicles are much higher than ambient <strong>vibrations</strong>;elsewhere this was not so. This was taken as an <strong>in</strong>dication ofcoherent signals only for 1/3 octave frequency bands from 8 to25 Hz. Second, <strong>in</strong> the frequency range for 1/3 octave frequencybands between 8 and 25 Hz, the m<strong>in</strong>imum and maximum oftransfer functions obta<strong>in</strong>ed for each band from three test repetitionswere compared. In most cases, there were <strong>in</strong>significantdifferences and aga<strong>in</strong> this was taken as an <strong>in</strong>dication of coherencebetween the signals <strong>in</strong> the said frequency range.© 1997 NRC Canada
© 1997 NRC CanadaFig. 3. Vertical acceleration (rms) for 1/3 octave frequency bands and frequency-weighted (FW) acceleration — bus at 50 km/h.Hunaidi and Tremblay 741
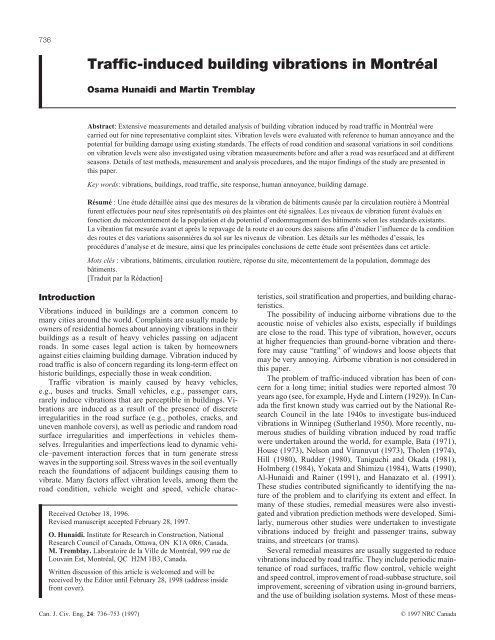
742Fig. 4. Vertical acceleration (rms) for 1/3 octave frequency bands and frequency-weighted (FW) acceleration — truck at 50 km/h.Can. J. Civ. Eng. Vol. 24, 1997© 1997 NRC Canada
744Fig. 5. Transfer functions between rms acceleration values at po<strong>in</strong>ts <strong>in</strong>side and outside <strong>build<strong>in</strong>g</strong>s.Can. J. Civ. Eng. Vol. 24, 1997© 1997 NRC Canada
Hunaidi and Tremblay 747Fig. 6. Layout of site 9 show<strong>in</strong>g location of wood plank attached to road surface. (All dimensions are <strong>in</strong> meters.)value was for the second-storey measurement po<strong>in</strong>t; ratioswere higher at other po<strong>in</strong>ts <strong>in</strong> the <strong>build<strong>in</strong>g</strong>). For PSR values of4 and 0 represent<strong>in</strong>g road conditions before and after resurfac<strong>in</strong>g,Rudder’s (1978) approximate relationship would give areduction factor of 6.9. This is <strong>in</strong> good agreement withthe m<strong>in</strong>imum reduction factor of 6.4 found above. Therefore,it may be a reasonable suggestion for the time be<strong>in</strong>g to applyRudder’s relationship for site conditions <strong>in</strong> Montréal. Needlessto say, however, more tests at other sites hav<strong>in</strong>g PSR valuesdifferent from that of the site selected <strong>in</strong> this study would berequired to further validate the applicability of this relationship.Vibration levelsVibration levels listed <strong>in</strong> Table 4 for the bus and the truck at 25and 50 km/h before road resurfac<strong>in</strong>g were substantially higherthan the ISO 2631/2 guide value of 0.001g (rms). The correspond<strong>in</strong>gvibration levels after the road was resurfaced weresignificantly reduced, as can be seen from the values listed <strong>in</strong>Table 5. For the truck, vibration levels became lower than theguide value at all po<strong>in</strong>ts <strong>in</strong>side the <strong>build<strong>in</strong>g</strong>. For the bus at50 km/h, however, vibration levels <strong>in</strong> the second storey rema<strong>in</strong>edhigher than the guide value by about 50% (vibrationlevels were six times the ambient acceleration levels of0.24 × 10 –3 g (rms))! Tenants might cont<strong>in</strong>ue to compla<strong>in</strong> <strong>in</strong>view of past experience by the City of Montréal that for somesites vibration compla<strong>in</strong>ts persisted even after the road wasresurfaced.It is <strong>in</strong>terest<strong>in</strong>g to note that vibration levels <strong><strong>in</strong>duced</strong> by theempty bus at 50 km/h (both before and after the road wasresurfaced) were similar to and <strong>in</strong> some cases higher than thecorrespond<strong>in</strong>g vibration levels <strong><strong>in</strong>duced</strong> by the loaded bus. Thesame trend was observed earlier by Al-Hunaidi and Ra<strong>in</strong>er(1991) us<strong>in</strong>g an empty and a loaded water truck and by Watts(1990) us<strong>in</strong>g empty and loaded trucks. Also worth not<strong>in</strong>g <strong>in</strong>Table 4 is that vibration levels <strong><strong>in</strong>duced</strong> by the bus and the truckat a speed of 25 km/h before the road was resurfaced weresimilar. At 50 km/h, however, <strong>vibrations</strong> <strong><strong>in</strong>duced</strong> by the buswere more than two times those <strong><strong>in</strong>duced</strong> by the truck. Obviously,the relationship between vehicle speed and vibrationlevels depends on the vehicle characteristics.Effect of seasonal variations <strong>in</strong> soilconditionsSoil conditions at compla<strong>in</strong>t sites, particularly the frost layer <strong>in</strong>w<strong>in</strong>ter and the level of ground water table, are believed to<strong>in</strong>fluence the level of traffic-<strong><strong>in</strong>duced</strong> <strong>vibrations</strong>. However, theextent of this <strong>in</strong>fluence is not clear. In a study of <strong>vibrations</strong><strong><strong>in</strong>duced</strong> by buses <strong>in</strong> W<strong>in</strong>nipeg, Sutherland (1950) reported that<strong>vibrations</strong> measured <strong>in</strong> w<strong>in</strong>ter while the top soil was frozenwere significantly less than those measured <strong>in</strong> summer.On theother hand, subway-<strong><strong>in</strong>duced</strong> <strong>vibrations</strong> <strong>in</strong> <strong>build<strong>in</strong>g</strong>s that weremeasured more recently <strong>in</strong> Toronto were found to be slightlyhigher <strong>in</strong> w<strong>in</strong>ter (while the top soil was frozen) than <strong>in</strong> summer.1 Tests were performed <strong>in</strong> this study to determ<strong>in</strong>e the trendfor conditions <strong>in</strong> Montréal.Officials of many cities <strong>in</strong> Canada <strong>in</strong>dicate that vibrationcompla<strong>in</strong>ts are more frequent dur<strong>in</strong>g the thaw period <strong>in</strong> spr<strong>in</strong>gthan <strong>in</strong> other seasons. The extent to which the higher level ofground water table <strong>in</strong> the spr<strong>in</strong>g thaw period adversely affectvibration levels was not known. Tests were thus performed <strong>in</strong>this study to shed some light on this issue.Description of testsTests were performed at site 9 after the road was resurfaced.Identical measurements of <strong>vibrations</strong> <strong><strong>in</strong>duced</strong> by a test buswere made dur<strong>in</strong>g the fall, w<strong>in</strong>ter, and spr<strong>in</strong>g. Visual <strong>in</strong>spectionof the road surface at time of measurements <strong>in</strong> the differentseasons <strong>in</strong>dicated that the road condition was almost identical.Tests were performed us<strong>in</strong>g a bus while empty and loaded; notrucks were used. The test bus was driven at speeds of 25 and50 km/h with and without a wood plank attached to the roadsurface. The wood plank was 3.7 cm high, 13.8 cm wide, and90 cm long. Only the far side of the bus passed over the woodplank located as shown <strong>in</strong> Fig. 6. Only the results obta<strong>in</strong>edwith the wood plank attached to the road are presented here;vibration levels for tests performed with no wood plank werelow and consequently the ratios between vibration levels <strong>in</strong> the1Bracken, M. 1994. Aercoustics Eng<strong>in</strong>eer<strong>in</strong>g Limited, Rexdale,Ont., Private communication.© 1997 NRC Canada
748Can. J. Civ. Eng. Vol. 24, 1997Table 7. Frequency-weighted vertical accelerations (10 -3 g, rms) <strong><strong>in</strong>duced</strong> by test buses <strong>in</strong> fall, w<strong>in</strong>ter, and spr<strong>in</strong>g.25 km/h 50 km/hEmpty bus Loaded bus Empty bus Loaded busLocation Fall W<strong>in</strong>ter Spr<strong>in</strong>g Fall W<strong>in</strong>ter Spr<strong>in</strong>g Fall W<strong>in</strong>ter Spr<strong>in</strong>g Fall W<strong>in</strong>ter Spr<strong>in</strong>gGround 3.66 1.56 3.86 3.87 1.72 3.78 4.18 1.92 3.94 4.25 1.63 4.22External foundation wall 2.47 1.21 2.57 2.61 1.26 2.48 2.58 1.14 2.47 2.66 1.03 2.92Midpo<strong>in</strong>t of floor <strong>in</strong> 1st storey 3.49 1.89 3.99 3.68 2.04 4.08 3.80 2.04 4.34 4.17 1.93 5.05Midpo<strong>in</strong>t of floor <strong>in</strong> 2nd storey 6.91 3.26 8.53 7.68 3.57 9.39 7.71 3.83 10.24 9.15 4.04 11.33Table 8. Ratio between bus-<strong><strong>in</strong>duced</strong> accelerations <strong>in</strong> w<strong>in</strong>ter and fall (w<strong>in</strong>ter/fall).25 km/h 50 km/hLocation Empty bus Loaded bus Empty bus Loaded busGround 0.42 0.44 0.46 0.38External foundation wall 0.49 0.48 0.44 0.39Midpo<strong>in</strong>t of floor <strong>in</strong> 1st storey 0.54 0.55 0.54 0.46Midpo<strong>in</strong>t of floor <strong>in</strong> 2nd storey 0.47 0.46 0.50 0.44Fig. 7. Vertical response and coherence functions obta<strong>in</strong>ed with thedrop weight device <strong>in</strong> summer and w<strong>in</strong>ter for the ground <strong>in</strong> front of<strong>build<strong>in</strong>g</strong> at site 9.Fig. 8. Narrow-band frequency spectra of acceleration recorded <strong>in</strong>(a) fall and (b) w<strong>in</strong>ter on ground <strong>in</strong> front of <strong>build<strong>in</strong>g</strong> at site 9(empty bus at 50 km/h).various seasons were not believed to be accurate. Dur<strong>in</strong>g alltests, the road and the nearest cross road north of the test <strong>build<strong>in</strong>g</strong>were closed to public traffic.At the time of vibration measurements dur<strong>in</strong>g w<strong>in</strong>ter, thetemperature was about –5°C and the depth of top frozen soilwas about 1.1 m, as found from both a soil borehole and a Cityof Montréal frost gauge at the site. Vibration measurements <strong>in</strong>the spr<strong>in</strong>g were performed dur<strong>in</strong>g the period when the groundwater table level was believed to be highest. At the time ofvibration measurements <strong>in</strong> the fall and spr<strong>in</strong>g, the level of theground water table was 5.8 and 2 m below the surface, respectively.Tests were also performed with the drop weight device <strong>in</strong>w<strong>in</strong>ter and spr<strong>in</strong>g. No similar tests were performed <strong>in</strong> the fall,however, due to a device malfunction; <strong>in</strong>stead, the results obta<strong>in</strong>eddur<strong>in</strong>g summer <strong>in</strong> earlier tests are used, assum<strong>in</strong>g thatthe levels of the ground water table were similar at the time of© 1997 NRC Canada
Hunaidi and Tremblay 749Fig. 9. Vertical response and coherence functions obta<strong>in</strong>ed with thedrop weight device <strong>in</strong> summer and spr<strong>in</strong>g for the ground <strong>in</strong> front of<strong>build<strong>in</strong>g</strong> at site 9.measurements <strong>in</strong> summer and fall. Site response functions obta<strong>in</strong>edwith the drop weight device were used as an additionalsource of <strong>in</strong>formation on the effect of the frost layer and variation<strong>in</strong> ground water table level.Frozen soil samples were obta<strong>in</strong>ed at a depth of about 0.6to 0.8 m <strong>in</strong> front of the <strong>build<strong>in</strong>g</strong> at the time of w<strong>in</strong>ter tests.Dynamic shear moduli and damp<strong>in</strong>g ratios of the soil sampleswhile frozen and after they were allowed to thaw were determ<strong>in</strong>edfrom resonant column tests (Al-Hunaidi et al. 1996b).Fall versus w<strong>in</strong>ter vibration levelsVibration levels and ratios obta<strong>in</strong>ed dur<strong>in</strong>g the fall and w<strong>in</strong>terare listed <strong>in</strong> Tables 7 and 8, respectively. Vibration levelsmeasured <strong>in</strong> w<strong>in</strong>ter were about one half those measured <strong>in</strong> thefall. This is <strong>in</strong> agreement with the results reported by Sutherland(1950) for similar vibration measurements <strong>in</strong> W<strong>in</strong>nipeg.Ratios of <strong>vibrations</strong> measured by Sutherland (1950) were generallyhigher than those found <strong>in</strong> this study. This is believed tobe due to the depth of the frost layer dur<strong>in</strong>g Sutherland’s measurementsbe<strong>in</strong>g 0.9 m, compared with 1.1 m <strong>in</strong> this study, and(or) due to the dom<strong>in</strong>ant frequency at the site of Sutherland’smeasurements <strong>in</strong> W<strong>in</strong>nipeg be<strong>in</strong>g about 7.5 Hz, comparedwith 13 Hz <strong>in</strong> this study.Vertical response and coherence functions obta<strong>in</strong>ed withten load impacts us<strong>in</strong>g the drop weight device dur<strong>in</strong>g summerand w<strong>in</strong>ter are shown <strong>in</strong> Fig. 7 for the ground measurementlocations. The coherence is close to 1 over the frequency rangethat is of <strong>in</strong>terest regard<strong>in</strong>g traffic <strong>vibrations</strong>, i.e., 8–20 Hz,thus <strong>in</strong>dicat<strong>in</strong>g a high signal-to-noise ratio. In this frequencyrange, it can be seen that the response function obta<strong>in</strong>ed <strong>in</strong>summer is higher than that obta<strong>in</strong>ed <strong>in</strong> the w<strong>in</strong>ter. This is consistentwith the results obta<strong>in</strong>ed us<strong>in</strong>g the test bus. For frequencieshigher than about 40 Hz, however, the response functionobta<strong>in</strong>ed <strong>in</strong> w<strong>in</strong>ter has higher magnitudes than that obta<strong>in</strong>ed <strong>in</strong>the summer. This seems to corroborate the observation mentionedearlier that subway-<strong><strong>in</strong>duced</strong> <strong>build<strong>in</strong>g</strong> <strong>vibrations</strong> <strong>in</strong>Toronto are higher <strong>in</strong> w<strong>in</strong>ter than <strong>in</strong> summer, as the dom<strong>in</strong>antfrequency of these <strong>vibrations</strong> is between 40 and 50 Hz.Results of resonant column tests on frozen and unfrozensoil samples taken at the site used <strong>in</strong> this study show that thestiffness of soil samples while frozen is about 30–50 times thestiffness after they were allowed to thaw. In addition, thedamp<strong>in</strong>g ratio obta<strong>in</strong>ed with frozen samples was roughly twotimes that obta<strong>in</strong>ed with thawed samples. Apparently the <strong>in</strong>crease<strong>in</strong> stiffness and damp<strong>in</strong>g of the top part of the soil ledto smaller <strong>vibrations</strong> (i.e., smaller dynamic deformations) forfrequencies up to 30 Hz. On the other hand, the <strong>in</strong>crease <strong>in</strong>stiffness of the top frozen part of the soil has led to a majorshift for the dom<strong>in</strong>ant frequency <strong>in</strong> the site response.F<strong>in</strong>ally, it was observed that the range of predom<strong>in</strong>antfrequencies of <strong>vibrations</strong> measured <strong>in</strong> the fall was widerthan the frequency range of <strong>vibrations</strong> measured <strong>in</strong> thew<strong>in</strong>ter, i.e., the former had higher levels at higher frequencies(e.g., 20–30 Hz). This can be seen, for example,from the narrow-band spectra shown <strong>in</strong> Fig. 8. The follow<strong>in</strong>gmay provide the reason. Attenuation of <strong>vibrations</strong> <strong>in</strong> soils, dueto material damp<strong>in</strong>g only, along the direction of wave propagation,can be expressed as follows (Richart et al. 1970):[1] A 2 = A 1 exp[–α(r 2 – r 1 )]where A 1 and A 2 are vibration amplitudes at distances r 1 and r 2from the vibration source, respectively; α is the coefficient ofattenuation which is related to the soil damp<strong>in</strong>g ratio and frequencyof vibration by[2] α= 2πfDcwhere f is frequency, D is damp<strong>in</strong>g ratio, and c is wave propagationvelocity. Because of the exponent <strong>in</strong> the above attenuationrelationship, a higher damp<strong>in</strong>g ratio <strong>in</strong> w<strong>in</strong>ter will lead togreater attenuation at high frequencies than at low ones.Spr<strong>in</strong>g versus fall vibration levelsVibration levels and ratios obta<strong>in</strong>ed dur<strong>in</strong>g the spr<strong>in</strong>g and fallare listed <strong>in</strong> Tables 7 and 9, respectively. Vibration levelsmeasured dur<strong>in</strong>g the thaw period <strong>in</strong> spr<strong>in</strong>g were only slightlyhigher than those measured <strong>in</strong> the fall. The highest ratio of 1.33occurred <strong>in</strong> the second storey.The <strong>in</strong>crease <strong>in</strong> vibration levels <strong>in</strong> the spr<strong>in</strong>g is not as highas expected, consider<strong>in</strong>g that more vibration compla<strong>in</strong>ts areusually made dur<strong>in</strong>g this season. Possibly, the water table levelat the time of vibration measurements made <strong>in</strong> the spr<strong>in</strong>g wasnot as high as usual dur<strong>in</strong>g the snow thaw period. On the otherhand, it might be speculated that the higher number ofcompla<strong>in</strong>ts <strong>in</strong> the spr<strong>in</strong>g is <strong>in</strong> fact due to the significantly lowervibration levels dur<strong>in</strong>g w<strong>in</strong>ter. The “quiet” w<strong>in</strong>ter period mightbe lead<strong>in</strong>g to a loss of familiarity with vibration and subsequentlylead<strong>in</strong>g to a decrease <strong>in</strong> tolerance as vibration levels<strong>in</strong>crease aga<strong>in</strong> <strong>in</strong> the spr<strong>in</strong>g.Vertical response and coherence functions obta<strong>in</strong>ed withthe drop weight device <strong>in</strong> summer and spr<strong>in</strong>g are shown <strong>in</strong>Fig. 9 for the ground measurement locations. The coherence© 1997 NRC Canada
750Can. J. Civ. Eng. Vol. 24, 1997Table 9. Ratio between bus-<strong><strong>in</strong>duced</strong> accelerations <strong>in</strong> spr<strong>in</strong>g and fall (spr<strong>in</strong>g/fall).25 km/h 50 km/hLocation Empty bus Loaded bus Empty bus Loaded busGround 1.05 0.98 0.94 0.99External foundation wall 1.04 0.95 0.96 1.10Midpo<strong>in</strong>t of floor <strong>in</strong> 1st storey 1.14 1.11 1.14 1.21Midpo<strong>in</strong>t of floor <strong>in</strong> 2nd storey 1.24 1.22 1.33 1.24Table 10. Peak particle velocities <strong>in</strong> basements<strong><strong>in</strong>duced</strong> by test buses at 50 km/h.Peak velocity (mm/s)Site No. Vertical Transverse2 0.89 —3 0.80 —4 0.62 0.205 1.55 0.266 0.25 0.277 0.79 0.169 2.23 0.71is close to 1 over the frequency range of <strong>in</strong>terest, i.e., 8–20 Hz,thus <strong>in</strong>dicat<strong>in</strong>g a high signal-to-noise ratio. In this frequencyrange, the response function of the ground obta<strong>in</strong>ed <strong>in</strong> thespr<strong>in</strong>g is similar to or slightly lower than that obta<strong>in</strong>ed <strong>in</strong> summer.This trend is <strong>in</strong> agreement with the ratios listed <strong>in</strong> Table10, although drop weight tests performed <strong>in</strong> the summerwere used as a substitute for those that could not be performed<strong>in</strong> the fall.Human response to vibrationVibrations <strong>in</strong> <strong>build<strong>in</strong>g</strong>s may be unacceptable to <strong>build<strong>in</strong>g</strong> tenantsfor one or more of the follow<strong>in</strong>g reasons: annoy<strong>in</strong>g physicalsensations that vibration may produce <strong>in</strong> the human body;<strong>in</strong>terference with activities such as sleep, conversation, andwork; annoy<strong>in</strong>g noise caused by “rattl<strong>in</strong>g” of w<strong>in</strong>dow panes,walls, and loose objects; fear of damage to the <strong>build<strong>in</strong>g</strong> and itscontents; and <strong>in</strong>terference with proper operation of sensitive<strong>in</strong>struments and (or) processes. For <strong>vibrations</strong> <strong><strong>in</strong>duced</strong> <strong>in</strong> residential<strong>build<strong>in</strong>g</strong>s by road traffic, experience has shown thattenants are likely to compla<strong>in</strong> if vibration levels are onlyslightly above the perception threshold — the major concernbe<strong>in</strong>g fear of damage to the <strong>build<strong>in</strong>g</strong> or its contents. With<strong>in</strong>residential areas, exist<strong>in</strong>g vibration standards report that thereis a wide variation <strong>in</strong> vibration tolerance. Possibly, this iscaused by variation of the perception threshold and differences<strong>in</strong> psychosocial and socioeconomic conditions among <strong>in</strong>dividuals.The International Organization for Standardization (ISO)and several countries have published standards that provideguidance for evaluation of human response to cont<strong>in</strong>uous, <strong>in</strong>termittent,and transient <strong>vibrations</strong> <strong>in</strong> <strong>build<strong>in</strong>g</strong>s. Tentativeguidance is provided <strong>in</strong> the standards regard<strong>in</strong>g satisfactoryvibration levels, i.e., levels at which adverse comment maybeg<strong>in</strong> to arise or levels below which the probability of reactionis low. No such standards have yet been adopted <strong>in</strong> Canada.Three standards were used to evaluate human response to thevibration levels measured for transit buses <strong>in</strong> this study. They<strong>in</strong>cluded standards published by the International StandardizationOrganization (ISO 1989), and standards organizations<strong>in</strong> Brita<strong>in</strong> (BSI 1984) and the United States (ASA 1983).Review of the above standards, details on evaluation ofvibration levels measured <strong>in</strong> this study, and recommendationsfor evaluation methods were reported by Al-Hunaidi (1996).It was found that the guidance provided by the standards is notclear when used for evaluation of <strong>vibrations</strong> <strong><strong>in</strong>duced</strong> by transitbuses. Bus-<strong><strong>in</strong>duced</strong> <strong>vibrations</strong> have relatively short durationand complex amplitude characteristics. The standards, however,seem to be geared for evaluation of cont<strong>in</strong>uous and <strong>in</strong>termittent<strong>vibrations</strong> such as that <strong><strong>in</strong>duced</strong> by mach<strong>in</strong>ery andpile driv<strong>in</strong>g, and impulsive <strong>vibrations</strong> such as that <strong><strong>in</strong>duced</strong> byblast<strong>in</strong>g.The follow<strong>in</strong>g two major difficulties were encountered <strong>in</strong>apply<strong>in</strong>g the standards. First, there was confusion regard<strong>in</strong>gthe classification of these <strong>vibrations</strong>, e.g., as <strong>in</strong>termittent ortransient <strong>vibrations</strong>. Both the ISO and American standardsmention <strong>vibrations</strong> <strong><strong>in</strong>duced</strong> by road traffic as examples for<strong>in</strong>termittent vibration, which <strong>in</strong> both standards is treated <strong>in</strong> thesame manner as cont<strong>in</strong>uous vibration. The British standardgives no examples; and it groups <strong>in</strong>termittent and transient<strong>vibrations</strong> under the same category. Vibration guide valuesprovided by the standards depend on the category of vibration.Second, although vibration levels are provided <strong>in</strong> the standards<strong>in</strong> terms of rms values, there is no specification regard<strong>in</strong>g the<strong>in</strong>tegration time for rms calculation. For vibration signals withshort time duration and time-vary<strong>in</strong>g amplitude, which is thecase for <strong>vibrations</strong> <strong><strong>in</strong>duced</strong> by buses, rms values are significantly<strong>in</strong>fluenced by the <strong>in</strong>tegration time. For impulsive signals,the American standard suggests us<strong>in</strong>g the peak method.The British standard offers the peak, root-mean-quad (rmq),and vibration dose value (VDV) as alternative methods forevaluation of transient signals. The ISO standard identifiesthese methods, but it is not clear whether it <strong>in</strong>tended to recommendthem as alternative methods. This aspect of the variousstandards was confus<strong>in</strong>g.In order to determ<strong>in</strong>e an appropriate method for the evaluationof vibration signals measured <strong>in</strong> this study, <strong>vibrations</strong>were analysed us<strong>in</strong>g the follow<strong>in</strong>g methods (Al-Hunaidi1996): (i) rms method, (ii) rmq method, (iii) peak method, and(iv) VDV method. Two sets of <strong>in</strong>tegration time were used forrms and rmq calculations. Also, vibration was evaluated asboth cont<strong>in</strong>uous and transient with several occurrences perday. Subsequently, the follow<strong>in</strong>g two evaluation methods wereidentified as the most appropriate (Al-Hunaidi 1996), <strong>in</strong> viewof the measured vibration levels and compla<strong>in</strong>ts at the selectedsites:• Method I: rms or rmq acceleration evaluated with respectto the base value of 0.005 m/s 2 specified by ISO 2631/2 (ISO© 1997 NRC Canada
Hunaidi and Tremblay 7511989) and a multiplication factor of 2. This results <strong>in</strong> a satisfactoryacceleration value (rms) of 0.01 m/s 2 , which is twicethe perception threshold of the most sensitive people. The rmsor rmq values should be calculated us<strong>in</strong>g a 2 s <strong>in</strong>tegration timeover the high amplitude portion of acceleration signals.• Method II: Peak acceleration evaluated with respect to thebase value of 0.007 m/s 2 specified by ISO 2631/2 (ISO 1989)and a multiplication factor of 30 together with multiplicationfactors recommended by ISO 2631/2 for the number and durationof events.In the above two methods, acceleration signals need to befrequency-weighted accord<strong>in</strong>g to ISO 8041 (ISO 1990b). If,on the other hand, velocity signals are measured and the frequencycontent <strong>in</strong> the signals is mostly above 8 Hz, frequencyweight<strong>in</strong>gis not needed — humans respond equally to<strong>vibrations</strong> at frequencies at or above 8 Hz. For velocity signals,the base values to be used <strong>in</strong> methods I and II are 0.1 mm/s(rms) and 0.14 mm/s, respectively.Potential for <strong>build<strong>in</strong>g</strong> damageIn some cases, owners of residential homes may make claimsabout vibration-<strong><strong>in</strong>duced</strong> <strong>build<strong>in</strong>g</strong> damage such as cracks <strong>in</strong>walls and ceil<strong>in</strong>gs, separations of masonry blocks, or cracks <strong>in</strong>the <strong>build<strong>in</strong>g</strong> foundation. Although vibration levels <strong>in</strong> <strong>build<strong>in</strong>g</strong>s<strong><strong>in</strong>duced</strong> by road traffic are rarely high enough to be the directcause of damage, they could contribute to the process of deteriorationfrom other causes. Build<strong>in</strong>gs usually have residualstra<strong>in</strong>s <strong>in</strong> their components as a result of uneven soil movement,moisture and temperature cycles, poor ma<strong>in</strong>tenance, and(or) past renovations and repairs. Therefore small vibrationlevels <strong><strong>in</strong>duced</strong> <strong>in</strong> <strong>build<strong>in</strong>g</strong>s by road traffic (and similarly byother man-made <strong>vibrations</strong> such as blast<strong>in</strong>g and pile driv<strong>in</strong>g)could trigger damage by “topp<strong>in</strong>g up” residual stra<strong>in</strong>s. Consequently,it is difficult to establish a vibration level above whichtraffic-<strong><strong>in</strong>duced</strong> vibration may cause <strong>build<strong>in</strong>g</strong> damage. It can beargued that such damage might be triggered or caused by activities<strong>in</strong> the home such as jump<strong>in</strong>g on stairs or floors andslamm<strong>in</strong>g doors, which can <strong>in</strong>duce vibration levels higher thanthose <strong><strong>in</strong>duced</strong> by road traffic. On the other hand, it could beargued that activities <strong>in</strong> <strong>build<strong>in</strong>g</strong>s cause local and less severedeformation patterns <strong>in</strong> <strong>build<strong>in</strong>g</strong>s compared to those caused bystress waves <strong>in</strong> the ground <strong><strong>in</strong>duced</strong> by traffic. Also, when<strong>build<strong>in</strong>g</strong>s are subjected to vibration for extended periods, as for<strong>vibrations</strong> caused by road traffic, the possibility of fatiguedamage exists if the <strong><strong>in</strong>duced</strong> dynamic stresses are high enough.In addition to damage caused directly by vibration, it should beacknowledged that there is a potential of <strong>in</strong>direct damagecaused by differential movement due to soil densification. Thelatter is particularly known to happen when loose and watersaturatedcohesionless soils are subjected to vibration.In view of the above remarks, it should not be surpris<strong>in</strong>gthat controversy still cont<strong>in</strong>ues to surround the issue of vibration-<strong><strong>in</strong>duced</strong><strong>build<strong>in</strong>g</strong> damage. Nonetheless, several countrieshave adopted standards that provide guidance on the evaluationof the effect of vibration on <strong>build<strong>in</strong>g</strong>s — no such nationalstandards have yet been adopted <strong>in</strong> Canada; some prov<strong>in</strong>ceshave, however, adopted guide values for <strong>vibrations</strong> <strong><strong>in</strong>duced</strong> byblast<strong>in</strong>g, e.g., Ontario (M<strong>in</strong>istry of the Environment 1978).Vibration levels measured <strong>in</strong> this study for transit buseswere evaluated to determ<strong>in</strong>e their potential for <strong>build<strong>in</strong>g</strong> damage.The follow<strong>in</strong>g standards and criterion were used:— German standard DIN 4150 (DIN 1984),— Swiss standard SN 640 312 (ASHE 1978),— British standard BS 7385 (BSI 1993), and— U.S. Bureau of M<strong>in</strong>es (USBM) criterion (Sisk<strong>in</strong>d et al.1980).These standards provide guide values <strong>in</strong> terms of frequency-dependentpeak particle velocity measured <strong>in</strong> basementsnear foundation walls or on the ground close to<strong>build<strong>in</strong>g</strong>s (the German standard also provides values for uppermoststoreys). The probability of <strong>build<strong>in</strong>g</strong> damage due tovibration below the guide values is very small. The <strong>in</strong>ternationalstandard ISO 4866 (ISO 1990a), which also deals withthe measurement of <strong>vibrations</strong> and evaluation of their effectson <strong>build<strong>in</strong>g</strong>s, does not yet <strong>in</strong>clude such guide values (mostlikely due to the controversy that cont<strong>in</strong>ues to surround thisissue). Damage to <strong>build<strong>in</strong>g</strong>s is generally def<strong>in</strong>ed <strong>in</strong> the standardsas formation of cracks, fall<strong>in</strong>g away of plaster, the enlargementof cracks already present, and the separation ofpartitions or <strong>in</strong>termediate walls from load-bear<strong>in</strong>g walls. Forresidential <strong>build<strong>in</strong>g</strong>s of wooden construction and vibration ata frequency of 10 Hz or higher, the lowest guide value <strong>in</strong> thestandards is that specified by the Swiss standard at 5 mm/s.In this study, only acceleration time histories were measured.Velocity time histories were obta<strong>in</strong>ed by <strong>in</strong>directly <strong>in</strong>tegrat<strong>in</strong>gthe measured acceleration time histories <strong>in</strong> thefrequency doma<strong>in</strong>. In this process, acceleration time recordswere transformed <strong>in</strong>to the frequency doma<strong>in</strong> us<strong>in</strong>g a 1024-po<strong>in</strong>t fast Fourier transform (FFT) with 50% overlapp<strong>in</strong>g Hann<strong>in</strong>gw<strong>in</strong>dows. Then, FFT components below 2.5 Hz were setto zero to avoid low frequency drift<strong>in</strong>g, and those above 2.5 Hzwere divided by the correspond<strong>in</strong>g frequencies. The modifiedFFT spectrum was then <strong>in</strong>verse fast Fourier transformed(IFFT) to obta<strong>in</strong> velocity time records. Acceleration levels below2.5 Hz were extremely small (see the section on narrowbandspectra). Hence, errors <strong>in</strong>troduced by discard<strong>in</strong>gcomponents below 2.5 Hz are <strong>in</strong>significant.Peak particle velocities of <strong>vibrations</strong> <strong>in</strong> basements nearfoundation walls are listed <strong>in</strong> Table 10 for measurements made<strong>in</strong> this study for test buses at 50 km/h. It can be seen that peakparticle velocities are well below 5 mm/s, <strong>in</strong>dicat<strong>in</strong>g that thepotential for direct <strong>build<strong>in</strong>g</strong> damage was very small. The possibilityof <strong>in</strong>direct damage caused by uneven soil densificationwas ruled out for most compla<strong>in</strong>t sites <strong>in</strong> Montréal, as thedom<strong>in</strong>ant soil type is silty clay which is very unlikely to settlewhen subjected to vibration. F<strong>in</strong>ally, fatigue-<strong><strong>in</strong>duced</strong> damagewas also ruled out <strong>in</strong> view of the small vibration levels measured<strong>in</strong> this study.ConclusionsCharacteristics of traffic-<strong><strong>in</strong>duced</strong> <strong>build<strong>in</strong>g</strong> <strong>vibrations</strong> <strong>in</strong>Montréal, <strong>in</strong>clud<strong>in</strong>g transfer functions between <strong>vibrations</strong> <strong>in</strong>sideand outside <strong>build<strong>in</strong>g</strong>s, were determ<strong>in</strong>ed from detailedmeasurements and analysis at n<strong>in</strong>e compla<strong>in</strong>t sites. A typicaltransit bus and city truck were used. Exist<strong>in</strong>g standards wereapplied to evaluate human annoyance from <strong>build<strong>in</strong>g</strong> vibrationand the potential for <strong>build<strong>in</strong>g</strong> damage. Also, controlled testswere performed at a selected site to evaluate the effect of road© 1997 NRC Canada
752resurfac<strong>in</strong>g and seasonal variation <strong>in</strong> soil conditions on vibrationlevels. The major f<strong>in</strong>d<strong>in</strong>gs of the study were as follows:1. Transfer functions varied from one site to another, <strong>in</strong>some cases significantly. For rough prediction of vibration levels<strong>in</strong>side <strong>build<strong>in</strong>g</strong>s, it was suggested that first floor vibrationlevels be taken equal to those on the ground close to <strong>build<strong>in</strong>g</strong>sand that floor-to-floor amplification be taken as 2 times.2. Vibration levels <strong><strong>in</strong>duced</strong> by transit buses were at leasttwice those <strong><strong>in</strong>duced</strong> by trucks of the same weight category.Predom<strong>in</strong>ant frequencies of bus-<strong><strong>in</strong>duced</strong> <strong>vibrations</strong> were between10 and 12.5 Hz, while those of truck-<strong><strong>in</strong>duced</strong> <strong>vibrations</strong>spread over a wider range.3. Each measurement site exhibited a “cutoff frequency”below which acceleration levels were very small. The lowestobserved cutoff frequency was 6.5 Hz.4. Road resurfac<strong>in</strong>g resulted <strong>in</strong> a reduction of vibration levelsby a factor of at least 6.4. Although such a reduction factormight be sufficient to resolve vibration compla<strong>in</strong>ts at mostsites, second-storey vibration rema<strong>in</strong>ed slightly higher thansatisfactory level for the selected site.5. Vibration levels measured while top soil was frozen <strong>in</strong>w<strong>in</strong>ter were about one half those measured while the soil wasnot frozen.6. The effect of the level of the ground water table on vibrationlevels was not significant.7. Exist<strong>in</strong>g vibration standards for evaluation of human annoyancewere not clear when applied for bus-<strong><strong>in</strong>duced</strong> <strong>vibrations</strong>.Consequently, two evaluation methods were developedbased on measurements made <strong>in</strong> this study.8. Bus-<strong><strong>in</strong>duced</strong> <strong>vibrations</strong> were significantly lower than themost str<strong>in</strong>gent guide value for <strong>build<strong>in</strong>g</strong> damage specified byexist<strong>in</strong>g standards. The potential of traffic vibration for <strong>build<strong>in</strong>g</strong>damage was therefore considered very small for the conditions<strong>in</strong> Montréal.The cutoff frequency phenomenon and the f<strong>in</strong>d<strong>in</strong>g that bus<strong><strong>in</strong>duced</strong><strong>vibrations</strong> are ma<strong>in</strong>ly due to axle hop have practicalsignificance. Possibly, vibration levels <strong><strong>in</strong>duced</strong> by buses — thema<strong>in</strong> cause of vibration compla<strong>in</strong>ts <strong>in</strong> Montréal — could besignificantly reduced by modifications to bus suspension systems.Such modifications would consist of alter<strong>in</strong>g the axlehop frequency so that it is below the cutoff frequency of mostsites <strong>in</strong> the city and (or) reduc<strong>in</strong>g the axle hop amplitude andthe unsprung mass. Lighter urban transit buses, currently underdevelopment, offer some hope for a lighter unsprung mass.AcknowledgmentsThis study was carried out on a cost-shar<strong>in</strong>g basis between theCity of Montréal and the Institute for <strong>Research</strong> <strong>in</strong> Construction,<strong>National</strong> <strong>Research</strong> Council of Canada (IRC/NRC). Theauthors would like to thank Dr. G. Pernica, Messrs. L. Wang,R. Glazer, T. Hoogeveen, and A. Laberge of IRC/NRC and Mr.C. Sanfaçon of the City of Montréal for their help <strong>in</strong> field testsand data process<strong>in</strong>g. The authors would also like to expresstheir appreciation to J.H. Ra<strong>in</strong>er of IRC/NRC for his manyhelpful comments. The cooperation of the regional PublicWorks Departments of the City of Montréal <strong>in</strong> arrang<strong>in</strong>g thetests and Société de transport de la Communauté urba<strong>in</strong>e deMontréal for provid<strong>in</strong>g test buses is gratefully acknowledged.Also, the cooperation of tenants and owners of <strong>build<strong>in</strong>g</strong>s used<strong>in</strong> the study is greatly appreciated.ReferencesCan. J. Civ. Eng. Vol. 24, 1997Al-Hunaidi, M.O. 1996. Evaluation of human response to <strong>build<strong>in</strong>g</strong>vibration caused by transit buses. Journal of Low Frequency Noiseand Vibration, 15(1): 25–42.Al-Hunaidi, M.O., and Guan, W. 1996. Digital frequency weight<strong>in</strong>gfilters for evaluation of human exposure to <strong>build<strong>in</strong>g</strong> vibration.Noise Control Eng<strong>in</strong>eer<strong>in</strong>g Journal, 44: 79–91.Al-Hunaidi, M.O., and Ra<strong>in</strong>er, J.H. 1990. Evaluation of measurementlimits of transducer mount<strong>in</strong>gs <strong>in</strong> the ground. Canadian Acoustics,18(3): 15–27.Al-Hunaidi, M.O., and Ra<strong>in</strong>er, J.H. 1991. Remedial measures fortraffic-<strong><strong>in</strong>duced</strong> <strong>vibrations</strong> at a residential site. Part 1: Field tests.Canadian Acoustics, 19(1): 3–13.Al-Hunaidi, M.O., Hofmeister, M., and Halliwell, R.E. 1992. A programfor 1/3 octave analysis of traffic <strong>vibrations</strong> us<strong>in</strong>g digitalfilter<strong>in</strong>g on PCs. Proceed<strong>in</strong>gs, Inter-Noise 92, Toronto, Ont., Vol.2, pp. 1153–1156.Al-Hunaidi, M.O., Ra<strong>in</strong>er, J.H., and Pernica, G. 1994. Measurementand analysis of traffic-<strong><strong>in</strong>duced</strong> <strong>vibrations</strong>. Proceed<strong>in</strong>gs, SecondInternational Symposium — Transport Noise and Vibration, St.Petersburg, Russia, pp. 103–108.Al-Hunaidi, M.O., Ra<strong>in</strong>er, J.H., and Tremblay, M. 1996a. Control oftraffic-<strong><strong>in</strong>duced</strong> vibration <strong>in</strong> <strong>build<strong>in</strong>g</strong>s us<strong>in</strong>g vehicle suspensionsystems. Soil Dynamics and Earthquake Eng<strong>in</strong>eer<strong>in</strong>g,15: 245–254.Al-Hunaidi, M.O., Chen, P.A., Ra<strong>in</strong>er, J.H., and Tremblay, M. 1996b.Shear moduli and damp<strong>in</strong>g of frozen and unfrozen clay by resonantcolumn tests. Canadian Geotechnical Journal, 33: 510–514.ASA. 1983. Guide to the evaluation of human exposure to vibration<strong>in</strong> <strong>build<strong>in</strong>g</strong>s. Acoustical Society of America, New York, N.Y.,ANSI S3.29.ASHE. 1978. Effect of vibration on construction. Association ofSwiss Highway Eng<strong>in</strong>eers (VSS), Zurich, Switzerland, SN 640312.Ashley, C. 1978. Proposed <strong>in</strong>ternational standards concern<strong>in</strong>g vibration<strong>in</strong> <strong>build<strong>in</strong>g</strong>s. Instrumentation for Ground Vibration and Earthquakes,Institution of Civil Eng<strong>in</strong>eers, London, United K<strong>in</strong>gdom,pp. 153–170.Bata, M. 1971. Effects on <strong>build<strong>in</strong>g</strong>s of <strong>vibrations</strong> caused by traffic.Build<strong>in</strong>g Science, 6: 21–246.BSI. 1984. Evaluation of human exposure to vibration <strong>in</strong> <strong>build<strong>in</strong>g</strong>s (1to 80 Hz). British Standards Institution, London, United K<strong>in</strong>gdom,BS 6472.BSI. 1993. Evaluation and measurement for vibration <strong>in</strong> <strong>build<strong>in</strong>g</strong>s.Part 2: Guide to damage levels from groundborne vibration. BritishStandards Institution, London, United K<strong>in</strong>gdom, BS 7385.Corbeil, S., Hardy, J., and Mantha, M. 1995. Cost/benefit analysis oflighter transit buses. Report prepared by Beauchem<strong>in</strong>-Beaton-Lapo<strong>in</strong>te Inc. for Transportation Development Centre, TransportCanada, Montréal, Que., Publication No. TP 12558E.DIN. 1984. Structural vibration <strong>in</strong> <strong>build<strong>in</strong>g</strong>s. Part 3: Effects on structures.Deutsches Institut fuer Normung, Berl<strong>in</strong>, Germany,DIN 4150.Gibby, R., Dawson, R., and Sebaaly, P. 1996. Local urban transit busimpact on pavements. ASCE Journal of Transportation Eng<strong>in</strong>eer<strong>in</strong>g,122(3): 215–217.Hanazato, T., Ugai, K., Mori, M., and Sakaguchi, R. 1991. Three-dimensionalanalysis of traffic-<strong><strong>in</strong>duced</strong> ground <strong>vibrations</strong>. ASCEJournal of Geotechnical Eng<strong>in</strong>eer<strong>in</strong>g, 117(8): 1133–1151.Hill, R.C. 1980. <strong>Traffic</strong> <strong><strong>in</strong>duced</strong> vibration <strong>in</strong> <strong>build<strong>in</strong>g</strong>s. Noise andVibration Control Worldwide, 11(5): 176–180.Holmberg, R. 1984. Vibrations generated by traffic and <strong>build<strong>in</strong>g</strong> constructionactivities. Swedish Council for Build<strong>in</strong>g <strong>Research</strong>,Stockholm, Sweden, D15 (ISBN 91-540-4159-7).House, M.E. 1973. <strong>Traffic</strong>-<strong><strong>in</strong>duced</strong> <strong>vibrations</strong> <strong>in</strong> <strong>build<strong>in</strong>g</strong>s. The HighwayEng<strong>in</strong>eer, 20(2): 6–16.© 1997 NRC Canada
Hunaidi and Tremblay 753Hyde, J.H., and L<strong>in</strong>tern, H.R. 1929. The <strong>vibrations</strong> of roads and structures.Proceed<strong>in</strong>gs, The Institution of Civil Eng<strong>in</strong>eers, London,United K<strong>in</strong>gdom, 227: 187–242.ISO. 1989. Evaluation of human exposure to whole-body vibration.Part 2: Cont<strong>in</strong>uous vibration and shock-<strong><strong>in</strong>duced</strong> vibration <strong>in</strong> <strong>build<strong>in</strong>g</strong>s(1 to 80 Hz). International Organization for Standardization,Geneva, Switzerland, ISO 2631/2.ISO. 1990a. Mechanical vibration and shock. Vibration of <strong>build<strong>in</strong>g</strong>s:guidel<strong>in</strong>es for the measurement of <strong>vibrations</strong> and evaluation oftheir effects on <strong>build<strong>in</strong>g</strong>s. International Organization for Standardization,Geneva, Switzerland, ISO 4866.ISO. 1990b. Human response to vibration. Measur<strong>in</strong>g <strong>in</strong>strumentation.International Organization for Standardization, Geneva,Switzerland, ISO 8041.Jakobsen, J. 1989. Transmission of ground-borne vibration <strong>in</strong> <strong>build<strong>in</strong>g</strong>s.Journal of Low Frequency Noise and Vibration, 8(3): 75–80.M<strong>in</strong>istry of the Environment. 1978. Model municipal noise controlby-law. M<strong>in</strong>istry of the Environment, Toronto, Ont., PublicationNo. NPC-119.Nelson, J.D., and Viranuvut, S. 1973. <strong>Traffic</strong> <strong><strong>in</strong>duced</strong> <strong>vibrations</strong> atWat Po, Bangkok. Geotechnical Eng<strong>in</strong>eer<strong>in</strong>g, 4:15–30.Richart, F.E., Woods, R.D., and Hall, J.R. 1970. Vibrations of soilsand foundations. Prentice-Hall, Inc., Englewood Cliffs, N.J.Rudder, F.F., Jr. 1978. Eng<strong>in</strong>eer<strong>in</strong>g guidel<strong>in</strong>es for the analysis oftraffic-<strong><strong>in</strong>duced</strong> <strong>vibrations</strong>. U.S. Department of Transportation,Federal Highways Adm<strong>in</strong>istration, Report No. FHWA-RD-78-166.Sisk<strong>in</strong>d, D.E., Stagg, M.S., Kopp, J.W., and Dowd<strong>in</strong>g, C.H. 1980.Structure response and damage produced by ground vibrationfrom surface m<strong>in</strong>e blast<strong>in</strong>g. United States Department of the Interior,Bureau of M<strong>in</strong>es, Report No. 8507.Sutherland, H.B. 1950. A study of <strong>vibrations</strong> produced <strong>in</strong> structuresby heavy vehicles. Proceed<strong>in</strong>gs, Thirtieth Annual Meet<strong>in</strong>g of theHighway <strong>Research</strong> Board, December, pp. 406–419.Taniguchi, E., and Okada, S. 1981. Reduction of ground <strong>vibrations</strong> byimprov<strong>in</strong>g soft ground. Soils and Foundations, Japanese Societyof Soil Mechanics and Foundation Eng<strong>in</strong>eer<strong>in</strong>g, 21(2): 99–113.Tholén, O. 1974. Markvibrationer orsakade av vägtrafik (Ground <strong>vibrations</strong>caused by road traffic). <strong>National</strong> Swedish Road and <strong>Traffic</strong><strong>Research</strong> Institute, Stockholm, Sweden, Report No. 53.Watts, G.R. 1990. <strong>Traffic</strong> <strong><strong>in</strong>duced</strong> <strong>vibrations</strong> <strong>in</strong> <strong>build<strong>in</strong>g</strong>s. Transportand Road <strong>Research</strong> Laboratory, Crowthorne, Berkshire, UnitedK<strong>in</strong>gdom, <strong>Research</strong> Report 246.Wolf, J.P. 1985. Dynamic soil–structure <strong>in</strong>teraction. Prentice-Hall,Inc., Englewood Cliffs, N.J.Yokota, A., and Shimizu, S. 1984. The prediction of ground vibrationcaused by road traffic. Proceed<strong>in</strong>gs, Inter-Noise 84, Honolulu,Hawaii, pp. 51–54.© 1997 NRC Canada