Care and support for people living with HIV/AIDS
Care and support for people living with HIV/AIDS
Care and support for people living with HIV/AIDS

You also want an ePaper? Increase the reach of your titles
YUMPU automatically turns print PDFs into web optimized ePapers that Google loves.
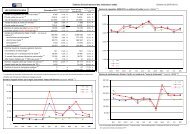
Report on the global <strong>HIV</strong>/<strong>AIDS</strong> epidemic – June 20007. <strong>HIV</strong> prevalence rate (%), data from selected populationsWomen in antenatal careclinics – major urban areasWomen in antenatal careclinics – outside majorurban areasMale STI patients – majorurban areasFemale sex workers – majorurban areasCountryYear Median Min. Max. Year Median Min. Max. Year Median Min. Max. Year Median Min. Max.Global Totalsub-Saharan AfricaAngolaBeninBotswanaBurkina FasoBurundiCameroonCentral African RepublicChadComorosCongoCote d'IvoireDem. Republic of CongoDjiboutiEquatorial GuineaEritreaEthiopiaGabonGambiaGhanaGuineaGuinea-BissauKenyaLesothoLiberiaMadagascarMalawiMaliMauritaniaMauritiusMozambiqueNamibiaNigerNigeriaReunionRw<strong>and</strong>aSenegalSierra LeoneSomaliaSouth AfricaSwazil<strong>and</strong>TogoUg<strong>and</strong>aUnited Rep. of TanzaniaZambiaZimbabweEast Asia & PacificChinaHong Kong S.A.R.19951998199819981998199819971999199619961998199919961996…199719951997199819961995199719941993199619981997199419981998199819931999…19971998199219851998199819971998199619981997……1.23.7437.418.65.512.86.205.210.64.12.90.7…17.64.01.03.41.52.715.231.34.00.026.02.70.5011.225.91.34.5…190.52019.230.36.813.813.72729.7……1.22.939.15.918.65.510.83.605.210.62.72.90.4…14.12.11.02.21.52.714.431.34.00.018.52.70.509.922.71.32.7…100.5205.230.36.813.413.725.924……1.25.949.98.318.65.515.27.305.210.65.42.91.0…20.05.41.06.61.52.715.931.34.00.030.42.70.5012.5291.38.0…280.52032.530.36.814.213.729.133.3……19961998199819981998199819971999…199319981999…1995199419981993199719981996…1997199919981996199819941988…1998199819971999…19971998…199719981998199719981998199819971998…8.51.530.04.319.79.212.24.7…4108.5…0.339.21.22.43.41.4…12.727.110.1018.22.90…17.0154.74.9…7.50.5…2.021.331.54.67.718.613.930.00.4…8.5022.34.019.73.55.34.1…28.18.5…0.330.81.20.721.3…5.927.110.106.42.90…55.94.70.5…60.2…1.09.929.63.01.312.35.27.00.4…8.513.937.56.619.714.822.05.5…13.612.88.5…0.3314.51.23.512.41.8…34.927.110.1125.24.50…18.334.44.721.0…120.7…3.030.034.88.211.524.031.053.30.4…1992199819981992…19961997…199619901992199719961996199419921988199619981995…19981994199319981996…199419981998199819921996…19961998199219901994199819921998199719921995199819982.52.860.441.8…1627.3…01818.412.222.215.99.537.53.75.616.74.5…2930.5r80.954.8…0.97.5942.24.13…41.833.3021.849.845.229.413.2587100.07n2.52.854.241.8…1616…016.418.412.222.23.29.5323.75.66.34.5…29218054.8…0.97.5939.94.13…29.103.3018.847.445.229.413.25850.70…2.52.864.041.8…1628.8…019.618.412.222.228.69.5433.75.627.14.5…2948.381.754.8…0.97.5944.64.13…54.54.13.3024.752.745.229.413.25871.20.4……1996…1994199319951989199519941987199519971998…19941991…199319971996…1995……199819941995…1990……19971996……1998199519901998…1992…1993…199519981988…53.5…58.242.216.518.913.456.849.268.429.027.5…25r67.5r…13.672.627.0…55.2……1.37055.5…0.8……23.630.5……7.026.72.461.1…78.9…49.5…86.000…48.9…57.242.215.218.913.456.834.367.629.027.5…2565.6…13.672.617…55.2……1.37055.5…0.8……23.630.5……6.126.72.461.1…78.9…49.5…86.000…58.1…59.242.217.718.913.456.864.169.229.027.5…2569.4…13.672.638…55.2……1.37055.5…0.8……23.630.5……13.326.72.461.1…78.9…49.5…86.02.30Dem. Peo. Rep. of Korea … … … … … … … … … … … … … … … …Fiji … … … … … … … … … … … … … … … …JapanMongoliaPapua New GuineaRepublic of KoreaAustralia & New Zeal<strong>and</strong>AustraliaNew Zeal<strong>and</strong>1993…1996………0…0.2………0…0.2………0…0.2………1996…1992………0…0………0…0………0…0………198919901998…19961997006…0.60.15006…0.50.1006…0.70.2199219901998………009.9………003.1………0016.7………126