Care and support for people living with HIV/AIDS
Care and support for people living with HIV/AIDS
Care and support for people living with HIV/AIDS

You also want an ePaper? Increase the reach of your titles
YUMPU automatically turns print PDFs into web optimized ePapers that Google loves.
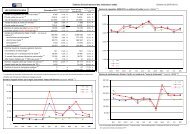
Report on the global <strong>HIV</strong>/<strong>AIDS</strong> epidemic – June 2000Women in antenatal care clinics – major urban areasWomen in antenatal care clinics – outside major urban areasMale patients <strong>with</strong> a sexually transmitted infection (STI) – major urbanareasFemale sex workers – major urban areasInjecting drug users – major urban areas8. Prevention indicatorsCondom availability• condoms available per capitaTotal number of condoms available <strong>for</strong> distribution, during the 12 monthspreceding the report, per adult (15–49). This includes imports, local manufactures,private-sector condoms <strong>and</strong> socially marketed condoms. Theyear indicates the date of the most recent report.• condom access (%)The percentage of adults (15–49) that have access to condoms. The yearindicates the date of the most recent survey.Reported non-regular sexual partnerships (%)The percentage of adults who report having had at least one sex partner other thantheir regular sex partner(s) in the 12 months preceding the report. An “a” denotes theproportion <strong>for</strong> both sexes combined. Urban samples are marked <strong>with</strong> a “u”. A “y”denotes the proportion <strong>for</strong> those not <strong>living</strong> <strong>with</strong> a spouse or other stable partner. Theyear indicates the date of the most recent survey.Reported condom use <strong>with</strong> non-regular partner (%)The percentage of adults who report having used a condom during the most recentintercourse <strong>with</strong> a non-regular sex partner. An “a” denotes the proportion <strong>for</strong> bothsexes combined. Urban samples are marked <strong>with</strong> a “u”. The year indicates the dateof the most recent report. The age range indicates the age group of the populationincluded in the survey.122