Care and support for people living with HIV/AIDS
Care and support for people living with HIV/AIDS
Care and support for people living with HIV/AIDS

Create successful ePaper yourself
Turn your PDF publications into a flip-book with our unique Google optimized e-Paper software.
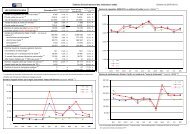
Annex 2. <strong>HIV</strong>/<strong>AIDS</strong> estimates <strong>and</strong> data, end 1999Adult (thous<strong>and</strong>s)Population aged 15–49 in 1999 (UN Population Division, Department of Economic<strong>and</strong> Social Affairs, United Nations Secretariat).5. Ranges of uncertainty around prevalence <strong>and</strong> mortality estimatesThe best estimates of <strong>HIV</strong> prevalence <strong>and</strong> <strong>AIDS</strong> deaths are given under indicators 1<strong>and</strong> 3 (see above). Depending on the reliability of the data available, there may bemore or less uncertainty surrounding each such estimate. Indicator 5 there<strong>for</strong>epresents both low <strong>and</strong> high estimates <strong>for</strong> certain variables. The wider the range,the greater the uncertainty surrounding the country’s estimates, which in turndepends mainly on the quality, coverage <strong>and</strong> consistency of the country’s surveillancesystem.While a measure of uncertainty applies to all estimates, in this report ranges ofuncertainty are presented <strong>for</strong> the following key variables:• the estimated number of adults <strong>and</strong> children <strong>living</strong> <strong>with</strong> <strong>HIV</strong>/<strong>AIDS</strong> at the endof 1999• the estimated number of <strong>AIDS</strong> deaths in adults (15–49) during 1999• the estimated number of <strong>AIDS</strong> deaths in children (0–14) during 1999.6. Estimated <strong>HIV</strong> prevalence rate (%) in young <strong>people</strong>, end 1999The estimated number of young <strong>people</strong> (15–24) <strong>living</strong> <strong>with</strong> <strong>HIV</strong>/<strong>AIDS</strong> at the end of1999 divided by the 1999 population of young <strong>people</strong> (15–24). These countryspecificestimates are expressed as a range generated by regional modelling.7. <strong>HIV</strong> prevalence rate (%), data from selected populationsPercentage of <strong>people</strong> tested in each group who were found to be infected <strong>with</strong> <strong>HIV</strong>.Most of these data are from routine sentinel surveillance (see Annex 1).For each of the groups the table gives the year of the most recent report, the median<strong>for</strong> all surveillance sites, the minimum <strong>and</strong> the maximum.Data from surveillance among pregnant women at antenatal care clinics are brokendown into urban populations <strong>and</strong> populations <strong>living</strong> outside major urban areas. Trulyrural areas often have no sentinel surveillance sites at all.Nearly all the data on groups <strong>with</strong> high-risk behaviour such as injecting drug use <strong>and</strong>sex work come from studies in urban areas. Data marked <strong>with</strong> an “r” are from ruralstudies, often conducted in small towns outside major urban centres. An “n”denotes a nationwide number that does not allow <strong>for</strong> a rural–urban breakdown.121