Care and support for people living with HIV/AIDS
Care and support for people living with HIV/AIDS
Care and support for people living with HIV/AIDS

You also want an ePaper? Increase the reach of your titles
YUMPU automatically turns print PDFs into web optimized ePapers that Google loves.
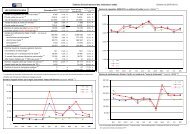
Annex 2. <strong>HIV</strong>/<strong>AIDS</strong> estimates <strong>and</strong> data, end 1999Annex 2.<strong>HIV</strong>/<strong>AIDS</strong> estimates <strong>and</strong> data, end 1999The estimates <strong>and</strong> data provided in the following table relate to the end of 1999unless stated otherwise. They are given in rounded numbers. However, unroundednumbers were used in the calculation of rates <strong>and</strong> regional totals, so there may besmall discrepancies between the regional/global totals <strong>and</strong> the sum of the countryfigures.Adults in this report are defined as men <strong>and</strong> women aged 15–49. This age rangecaptures those in their most sexually active years. While the risk of <strong>HIV</strong> infectionobviously continues beyond 50, the vast majority of those <strong>with</strong> substantial riskbehaviour are likely to have become infected by this age. Since population structuresdiffer greatly from one country to another, especially <strong>for</strong> children <strong>and</strong> the upperadult ages, the restriction of “adults” to 15–49-year-olds has the advantage of makingdifferent populations more comparable. This age range was used as the denominatorin calculating the adult <strong>HIV</strong> prevalence rate.The methodology used to produce the country-specific estimates in the table hasbeen described in full elsewhere (Schwartländer et al. <strong>AIDS</strong> 1999; 13:2445–2458).Notes on specific indicators listed in the table1. People <strong>living</strong> <strong>with</strong> <strong>HIV</strong>/<strong>AIDS</strong>, end 1999These estimates include all <strong>people</strong> <strong>with</strong> <strong>HIV</strong> infection, whether or not they havedeveloped symptoms of <strong>AIDS</strong>, alive at the end of 1999.For country estimates marked <strong>with</strong> an asterisk, not enough data were available to producean estimate of <strong>HIV</strong> prevalence <strong>for</strong> end 1999. For each of these countries the 1994prevalence rate published by the WHO Global Programme on <strong>AIDS</strong> (Weekly epidemiologicalrecord 1995; 70:353–360) was applied to the country’s 1999 adult populationto produce the estimates given in the table. No country-specific models were produced<strong>for</strong> countries marked <strong>with</strong> an asterisk. For data columns containing few or nocountry estimates, the regional totals were calculated on the basis of a regional model.119