Advanced Brazilian Beehive Kiln - the Katoomba Group
Advanced Brazilian Beehive Kiln - the Katoomba Group
Advanced Brazilian Beehive Kiln - the Katoomba Group

Create successful ePaper yourself
Turn your PDF publications into a flip-book with our unique Google optimized e-Paper software.
<strong>Katoomba</strong> Working <strong>Group</strong> IIINEW MARKETS FOR A GREEN ECONOMY:CARBON CREDITS AND ENVIRONMENTAL SERVICESOF FORESTSThe Global Carbon Market and<strong>the</strong> Prototype Carbon FundMarch 23 rd , 2001BNDES Training CenterRio de Janeiro, Brazil
Formal Market Drivers• Kyoto Protocol :– OECD/EITs to reduce GHG emissions 5% below 1990 levels in2008 - 2012.– Quantity to be met through trade: about 500 million t- C/year(each of 5 yrs, 2008/12) requiring thousands of transactions– Value of global trade estimate: ~$5-10 billion/year• Flexibility Mechanisms:– Project-based: Joint Implementation (JI) between OECDcountries and EITs; Clean Development Mechanism (CDM)between industrialized and developing country Parties after 2000– Emissions trading including ‘Hot Air’ trading• Key decisions at COP6 II bis July, 2001, and beyond.
Informal Market Drivers onCorporate Behavior• Companies see <strong>the</strong> climate change politicalprocess is real– Industrial countries are slowly -- but inexorably --moving towards substantial policies to reduce overallgreenhouse gas emissions (Nordics, UK, EU)– Ultimately <strong>the</strong> Kyoto Protocol implies a massivereallocation of assets– Shift will impact internal investment decision makingand external valuation (BP-Amoco, Sou<strong>the</strong>rn Pacific)• Developing and projecting an efficientgreenhouse response has become an issue of7corporate strategic competitiveness
Factors influencing CDM CarbonMarket Development• OECD will miss targets by 20-30% if no action is taken• Published Marginal Abatement Cost estimates insideOECD: $67-$584/ton C. But this likely under-estimates“low hanging fruit” in US and less energy-efficient OECDeconomies• Clearing price with full trade: $20-50/ton C. $20/t/C ismore realistic• Dutch Study: CDM/developing country “technical” supplypotential is 1.6 billion tons at up to $22/t/Carbon• Developing Country Capacity Constraints will limitvolume of of supply• CDM project cycle transaction costs and possible8additionality requirements are key factors in cost of supply
• Does CDM create a new “sovereigncommodity” market regulated by <strong>the</strong> Protocolor a project-based facility like GEF with exantereview and clearance of each transaction• For CDM to meet Technology Transfer andSustainable Development goals requires– high volume private investment– risk management and profit opportunity through activesecondary market– ‘ex post’ market-based regulation ra<strong>the</strong>r than ‘ex ante’project by project review, ie Low transaction costs– fungibility and transferability of emission reductionsCompeting CDM Models andCarbon Market Development
Critical CapacityConstraints• Host country government and private sector capacityis an important factor limiting <strong>the</strong> volume ofinvestment and technology transfer.– Effective private sector capacity is key to loweringtransaction costs of developing, negotiating andimplementing CDM/JI projects– Efficient arrangements across government agencies arekey to oversee CDM/JI, build investor confidence andprotect Governments’ interests– The most effective capacity building is through <strong>the</strong> firstprojects and real emission reduction purchasetransactions
Engaging <strong>the</strong> Private Sector• Private Sector Capacity exists in both Annex I andsome non-Annex I countries for Validation,Verification, and Certification– With clear guidance, <strong>the</strong> auditing profession can efficientlyfulfill <strong>the</strong>se needs• Private sector investment will flow more readily if<strong>the</strong> CDM project cycle….– is short and predictable– avoids ex ante, open-ended approval processes– ensures transparency and certainty (validationprotocol, accreditation criteria)
Transaction Costs As Barriers toCDM Market Development• Small projects involving technologies such as PV,small wind, biomass, micro-hydro often– have higher unit costs due to small size– displace lower carbon intensity end-uses– operate in riskier environments (e.g. remote rural areas)• AND <strong>the</strong>y represent majority of CDM opportunitiesfor most developing countries• To be competitive in CDM such projects need– aggregation to reduce transaction costs– streamlined/ simplified CDM procedures
Need for Intermediationfor Small projects/small countries• Smaller-scale project sponsors in small countries andriskier investment environments lack ready access tocarbon finance;• need “bundling” of small projects by financialintermediaries to tap global carbon market and deliverbenefits to small project sponsors and communities;– use of “Multi-project” or standardized baselines usingperformance standards for medium scale projects and– agree on standard emission factors for particular endusesand technologies in micro-projects
Cost of CDM Project Cycleprocedures• Total procedural cost: $200-400K– PCF Front end procedures (Baseline, Monitoring &Verification, Validation, legal fee, etc.): $100-200K– Procedures after project commissioning (lifetimesupervision, verification and certification): $100-200K– NOT including CDM fees– NOT including additional CDM registration and reviewrequirements• Compare with medium sized project with ERpurchase from project: $2 million and total financingof ~$10 million (power projects ~5-10MW)
Carbon Market ObservationsValue of CDM Carbon Financing• Carbon Prices are NOT >$5/t/CO2 and unlikely toexceed this level before 2005• At $3-5/t/CO2 Carbon Finance contributes:– typically an additional 0.5-3.0% to Project FIRR and;– 5-15% of project finance in PV terms– Exceptions with higher financing impacts include anymethane abatement measures (e.g. MSW to energy, gasflare & loss reduction), some energy efficiencymeasures, biomass and crop waste to energy options• Conclusion:– carbon finance is no “magic bullet”– delicate balance between Protocol transaction costs and
Will <strong>the</strong> CDM Contribute to Reduction of Emissions of CO 2through reducing vulnerability to land degradation and ruralpoverty?8000 B.C.19401987-1992Combat Forest FiresReduce DeforestationRecover Degraded Areas
Results of Poor Land Management in EthiopiaLoss of: carbon sinks (soil/vegetation C), hence soil fertility (nutrients, humus) and soil biodiversity, native fauna, flora, andkey food crop landraces
* Carbon estimates comes from <strong>the</strong> Harvard-INCAE-CABEI project, for <strong>the</strong> range between 6.5 and 62 milliontons per year cost estimates are less than $20 per ton (Castro Salazar, 1999; Boscolo et al., 2000)** Estimates for Panama and Belize come from a CCAD study conducted in 1998.Slides on Central America in this presentation come from Rene Castro and o<strong>the</strong>rs who madea presentation to<strong>the</strong> World Bank on possible collaboration in Carbon Finance in mid-2ooo. See PCF web-site.Will Maximize <strong>the</strong> Central American CERsPotential* which is Substantial at a Market Price of$28/ton*Potencial de Reducción de Carbono en Centroamérica(En Toneladas Métricas de Carbono)PaísActividadCombustibles Deforestación Plantaciones Aforestación Total por PaísCosta Rica 1,223,000 3,360,000 648,000 1,400,000 6,631,000El Salvador 1,991,000 1,584,000 324,000 84,000 3,983,000Guatemala 1,608,000 10,125,000 644,000 2,150,000 14,527,000Honduras 964,000 16,218,000 227,000 2,826,000 20,235,000Nicaragua 747,000 13,200,000 648,000 2,626,000 17,221,000Panama** NA NA NA NA 1,260,736Belize** NA NA NA NA 318,000Total 6,533,000 44,487,000 2,491,000 9,086,000 64,175,736
Carbon price scenarios and its potential for expansion of<strong>the</strong> Mesoamerican Biological CorridorProposedPrice ScenariosMaximumProtected $10 $20 $30 $50 $100 $200 landArea Expansion Percentage of <strong>the</strong> Total Area (000) haLa Amistad 18 88 100 100 100 100 186,201Rincon de la Vieja 0 10 26 76 94 95 12,421Palo Verde 0 33 70 98 98 100 9,302Piedras Blancas 4 4 8 25 65 89 11,537Barra Honda 0 45 45 66 88 100 2,019Guanacaste 1 18 61 91 100 100 32,895Carara 0 11 90 94 95 100 5,349Barbilla 0 18 61 100 100 100 2,604All Areas 10 56 82 93 98 99 262,000Note: Each protected area has a different opportunity cost and carbon productivity level.All land costs are based on historical acquisitions. All protected area figures are roundedto <strong>the</strong> unit, <strong>the</strong> proposed expansion of <strong>the</strong> protected areas.Ref: Castro Salazar, 1999.
Agro-Ecosystem/ Farming SystemCarbon Sequestration Project Concept
Clean Development MechanismOpportunity for Rural Poverty Alleviation:• To mobilize private capital to:– capitalize transition to sustainable intensiveagriculture/agro-forestry & sustainable forestry– Direct private capital to address rural poverty, landdegradation and forest loss– increase incentives for policy and market reform• Per hectare opportunity: 1.25-2.5 t/ha/year aboveand belowground, or ~$20-40/ha/year or• ~$250-500/ha, or over 15 years, front-end loaded.
Above GroundCarbonBelow GroundCarbonFarmingCommunitiesApproaches to SIA/LMand Carbon SequestrationTechniques OutcomesWater shed, shelterbeltplantingLiving fencesAgro-forestryHome-plot copsesRestoration plantingNo/low tillageLegume rotationMulchingImproved fertilizn.Demonstration,training, incentivepolicies, marketingorganizations, creditmechanismsReduced erosion,better watermanagement;increased biomass/C,increasedfuel/fodder/foodIncreased soilfertility; humus andsoil carbon; soil biotaIncreased farmyields, “commons”yields, increasedfarm incomes,community welfare
Features of <strong>the</strong> PCF• Portfolio or fund structure– Minimize Project Risks– Reduce Transactional Costs– Enhance <strong>the</strong> Learning Experience• Governments: $10 m; Companies: $5 m• Total: US$145 million to be used in 20-25 projects• PCF Products:– Competitively priced, high quality emissions reductions• target price outcome: $4-5/t-CO2 (= $20/t-C)• target cost of generating ERs: $3/t-CO2 (= $10/t-C)– High value knowledge asset to help create competitiveadvantage for corporate investors and efficient marketregulation for Parties
Key Demonstration Effects… that investments under CDM/JI can:• Earn export revenue for DevelopingCountries/Transition Economies engaging in <strong>the</strong>new ER commodity trade• Increase <strong>the</strong> profitability of cleaner more efficienttechnology in energy, industry, and transportsectors• Contribute to sustainable development•… and how to implement <strong>the</strong> CDM(JI?) project cycle
Governments: (6)Participants($145 million in subscribed capital)Ne<strong>the</strong>rlands, Finland, Sweden, Norway,Canada, Japan (through Japan Bank forInternational Cooperation)Private Sector: (17)RWE - Germany, Gaz de France, TokyoElectric Power, Deutsche Bank, ChubuElectric, Chugoku Electric, Kyushu Electric,Shikoku Electric, Tohoku Electric, Mitsui,Mitsubishi, Electrabel, NorskHydro- Norway,Statoil -Norway, BP-Amoco, Fortum,RaboBank, NL
PCF Status and FocusDeal flow far exceeds funding - several carbon contractsnow under negotiation >50 deals with $300m+ carbon purchases under review Targeting signed Emissions Reductions PurchaseAgreements (ERPAs) by end-Summer, 2001 of $30-35mm in Chile, CostRica, Nicaragua, El Salvador, Belarus, Brazil,Honduras, India by end December 2001 of $25-30mm in Hungary,Bulgaria, Morocco, Jamaica, Guyana, Guatemala,Argentina, Uganda. Constraints: Government Awareness and Resolve, Qualityof Asset after baseline review
Current PCF Portfolio andFocus• predominance of wind, municipal solid wastemanagement, small-hydro, andbagasse/biomass co-generation• strategic focus on building marketinfrastructure for aggregation andintermediation of small projects• leaving space for Solar PV, transport energyefficiency, fuel-switching – coal to gas, LandUse and Forestry (JI only) and expandedEnergy Efficiency
* PCF prefers to pay on delivery for emissions reductionsCarbon Financing v.s. UnderlyingFinancingTOTAL PROJECT COST =UNDERLYING FINANCING (LEASTCOST OPTION TO ATTAIN EQUALBENEFIT OTHER THANENVIRONMENTAL BENEFIT IN THESETTING ) + CARBON FINANCINGCARBON FINANCINGUNDERLYINGFINANCING• Carbon financing isdefined as <strong>the</strong> financingto attain emissionreductions which wouldnot o<strong>the</strong>rwise realized in<strong>the</strong> absence of <strong>the</strong>project (compared with<strong>the</strong> least cost option in<strong>the</strong> setting)• PCF funds* 1 a part ofcarbon financing
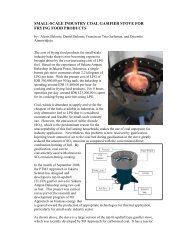
PCF In Brazil• Letter of intent to PLANTAR to buy emissionsreductions– from sustainable charcoal to displace imported coke and– to upgrade charcoal-making technology to reduce GHGemissions and local pollution• In negotiations to purchase emissions reductions fromsmall-scale power generation from wood and cropwaste operations• Require independently certified sustainable forestryfor wood waste/charcoal operations
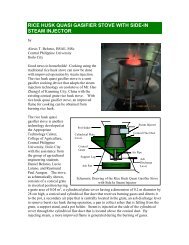
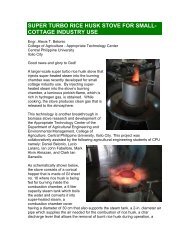
Traditional<strong>Brazilian</strong>Brick<strong>Beehive</strong> <strong>Kiln</strong>Used in about90% of<strong>Brazilian</strong>CharcoaloperationsEfficiency:About 4m3wood for1m3 Charcoal
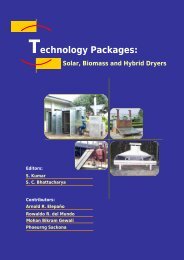
Improved <strong>Brazilian</strong> Brick <strong>Kiln</strong>: < 2m3 wood to 1m3 Charcoal
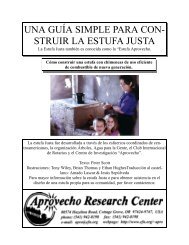
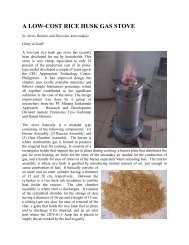
<strong>Advanced</strong> <strong>Brazilian</strong> <strong>Beehive</strong> <strong>Kiln</strong>Collects Tars and Pyrolytic Oils in smoke –minimizes local air pollution. Efficiency: Better than2m3 Wood per m3 charcoal
Annexes
PCF Project Selectionand Portfolio CriteriaGeneric: Adhering to UNFCCC, Bank standards, wi<strong>the</strong>mphasis on renewable energy projects• Broad balance between CDM and JI• Not less than 2% or more than 10% of Fund’s assets• Not more than 20% in <strong>the</strong> same host country• Not more than 10% in forest-based sinks (only in EITs)• Emphasis on renewable energy technology and efficiency(3:2 ratio)• No more than 25% in any one technology
Impact of lack of transferability• Draft text required designating Annex Idestination of ERs irrevocably at time ofregistration of projects by Host Country• Impact would be to eliminate:– secondary market outside of domestic regimes;– arbitrage between domestic regimes when Ers arecertified and transferred to investors– ‘pooling’ investment and‘bundling’ projects (forspreading risk and/or reducing transaction cost)– much small-country, small project ER trade
Development Finance & CDMEligibility• Blending concessional and ODA funds and carbonfinance should not render <strong>the</strong> project ineligible as aCDM project– And separate this from <strong>the</strong> quite different issue ofwhe<strong>the</strong>r emission reductions can be acquired with ODA• Carbon finance will gradually displace and free upODA for o<strong>the</strong>r socially beneficial developmentapplications such as health & education
Host Country CommitteeMembersJoined/Signed MOUs•Latvia•CzechRepublic•Argentina•CostaRica•Guatemala•Brazil•Mexico•El Salvador•Guyana•Uruguay•Colombia•Togo•Zimbabwe•Uganda•Morocco•Nicaragua•Honduras•Peru•Senegal•Burkina Faso•IndiaJoining soon throughendorsing Projects•Belarus•Bulgaria•Chile•Jamaica
Project identificationand preparationBaseline Study as part ofFeasibility Study“EnsuringEnvironmentalCredibility”3-4 weeks effortCost: $20,000Preparation of Monitoringand Verification ProtocolValidation processand opinion4-5 weeks effortCost: $40,0004 weeksCost: $30,000Total Front-End of PCF ProjectCycle Costs of ~ $150-200k beingsum of “Baseline and ValidationProcess” plus unique CDManalysis and dialogue+negotiationsNegotiation of CarbonPurchase AgreementProjectapproval
Convention Objectives and DevelopmentContext• DesertificationConvention• BiodiversityConvention• Climate ChangeConvention• Mitigate desertification,Sustainable development,integrated NRM• conservation, sustainable use,benefit sharing– eradicate poverty (Art.20.4)– focus on environmentallyvulnerable incl. Aris-semi-arid• “common but differentiatedresponsibilities” to mitigateclimate change– poverty eradication comes first(art. 7)– sustainable management ofsinks..incl. Biomass, forests,terrestial ecosystems– meet special needs of arid/semiaridand <strong>the</strong> prone to drought anddesertification
Example of possible Soil Carbonincrement under improved management(over 7-10 years)Pasture Savanna A. gayanus/ S.capitataDepth cmCt ha -1Ct ha -1Ct ha -10-20 64 71 7 (+or-)2.0 **20-100 123 166 44 (+or-)9.7 ***Total 187 237 51 (+or-)11.4 ***%>20 cm 86.0Yield, net gain of C and percentage of <strong>the</strong> net gain below <strong>the</strong> plow layer(20 cm) in an introduced pasture compared with native savanna atMatazul Farm on <strong>the</strong> eastern plains of Colombia