Climate change research at the Met Office Hadley Centre - JULES
Climate change research at the Met Office Hadley Centre - JULES Climate change research at the Met Office Hadley Centre - JULES
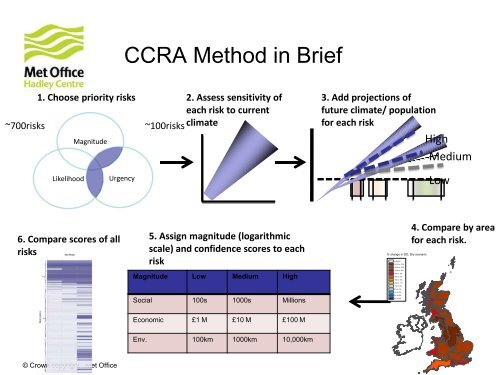
CCRA Method in Brief1. Choose priority risks 2. Assess sensitivity ofeach risk to current~700risks~100risks climateMagnitude3. Add projections offuture climate/ populationfor each riskHighMediumLikelihoodUrgencyLow6. Compare scores of allrisks5. Assign magnitude (logarithmicscale) and confidence scores to eachriskMagnitude Low Medium HighSocial 100s 1000s Millions% change in DO, Dry scenariounknown-20% to -16%-16% to -12%-12% to -8%-8% to -6%-6% to -4%-4% to -2%-2% to -1%-1% to 0%0% to 1%1% to 2%2% to 4%4% to 6%4. Compare by areafor each risk.Economic £1 M £10 M £100 MEnv. 100km 1000km 10,000km© Crown copyright Met Office
© Crown copyright Met OfficeHow can JULES contribute to currentIPCC and next CCRA?• Both IPCC and CCRA take a fragmented, sectorfocussedapproach• Often the user-focussed impacts work done quickly tocustomer timescales not scientific ones!• Need for a robust, scientifically-proven tool that can beeasily and rapidly applied• Individual sectors (food, water, energy, etc) generallyexamined independently of each other (so inconsistent)• Real world more integrated• Physical interdependencies• Socio-economic interdependencies• As a process-based model of terrestrial systems, JULEScan be a framework for accounting for physicalinterdependencies• Very little work done on detection and attribution ofimpacts
- Page 1 and 2: Using JULES for impacts assessment
- Page 3 and 4: United Nations FrameworkConvention
- Page 5 and 6: AR5 WG2 structure© Crown copyright
- Page 7 and 8: Human settlements, industry andinfr
- Page 9 and 10: Regional aspects© Crown copyright
- Page 11: CCRA Sectors and themesSECTORS• A
- Page 15 and 16: © Crown copyright Met OfficeCO 2 r
- Page 17 and 18: Different predictionsusing hydrolog
- Page 19 and 20: Proposed work for AR5 with JULES:im
- Page 21 and 22: Other priorities• Remember JULES
CCRA <strong>Met</strong>hod in Brief1. Choose priority risks 2. Assess sensitivity ofeach risk to current~700risks~100risks clim<strong>at</strong>eMagnitude3. Add projections offuture clim<strong>at</strong>e/ popul<strong>at</strong>ionfor each riskHighMediumLikelihoodUrgencyLow6. Compare scores of allrisks5. Assign magnitude (logarithmicscale) and confidence scores to eachriskMagnitude Low Medium HighSocial 100s 1000s Millions% <strong>change</strong> in DO, Dry scenariounknown-20% to -16%-16% to -12%-12% to -8%-8% to -6%-6% to -4%-4% to -2%-2% to -1%-1% to 0%0% to 1%1% to 2%2% to 4%4% to 6%4. Compare by areafor each risk.Economic £1 M £10 M £100 MEnv. 100km 1000km 10,000km© Crown copyright <strong>Met</strong> <strong>Office</strong>


