Part II consists of a separate question and answer book.
Part II consists of a separate question and answer book.
Part II consists of a separate question and answer book.
- No tags were found...

Create successful ePaper yourself
Turn your PDF publications into a flip-book with our unique Google optimized e-Paper software.
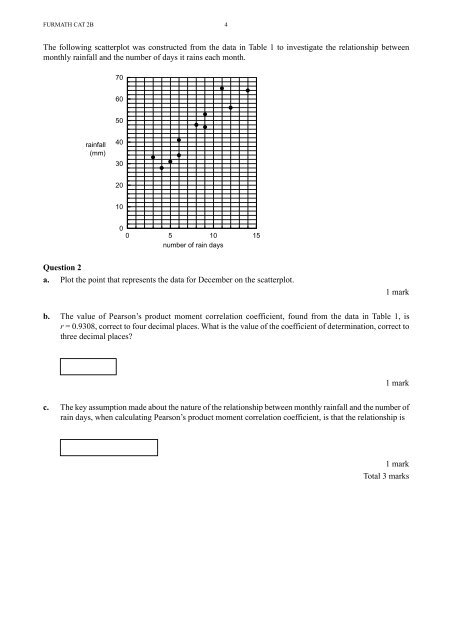
FURMATH CAT 2B 4The following scatterplot was constructed from the data in Table 1 to investigate the relationship betweenmonthly rainfall <strong>and</strong> the number <strong>of</strong> days it rains each month.706050rainfall(mm)4030201000 5 10 15number <strong>of</strong> rain daysQuestion 2a. Plot the point that represents the data for December on the scatterplot.1 markb. The value <strong>of</strong> Pearson’s product moment correlation coefficient, found from the data in Table 1, isr = 0.9308, correct to four decimal places. What is the value <strong>of</strong> the coefficient <strong>of</strong> determination, correct tothree decimal places?1 markc. The key assumption made about the nature <strong>of</strong> the relationship between monthly rainfall <strong>and</strong> the number <strong>of</strong>rain days, when calculating Pearson’s product moment correlation coefficient, is that the relationship is1 markTotal 3 marks