Proteins and Peptides Purifications Guide - Hplc.eu
Proteins and Peptides Purifications Guide - Hplc.eu
Proteins and Peptides Purifications Guide - Hplc.eu
- No tags were found...

Create successful ePaper yourself
Turn your PDF publications into a flip-book with our unique Google optimized e-Paper software.
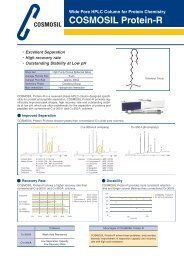
A <strong>Guide</strong> to the Analysis<strong>and</strong> Purification of<strong>Proteins</strong> <strong>and</strong> <strong>Peptides</strong> byReversed-Phase HPLCHPLC ColumnsDavid Carr
Your decision has lasting effects.Choose wisely.HPLC ColumnsUltra Inert Base-Deactivated HPLC ColumnsFor Performance, Selectivity<strong>and</strong> Guaranteed ReproducibilityACE performanceguarantee✓If ACE does not outperform your existing column (of equivalent phase,particle size <strong>and</strong> dimensions), send in your comparative data within 60days <strong>and</strong> keep the ACE column FREE OF CHARGE.
ContentsA <strong>Guide</strong> to the Analysis <strong>and</strong> Purification of <strong>Proteins</strong><strong>and</strong> <strong>Peptides</strong> by Reversed-Phase HPLCTable of ContentsIntroductionMechanism of protein/peptide retentionColumn characteristicsMobile phaseDetectionEffect of temperatureReversed-phase HPLC-MSPeptide mappingProtein oxidationProtein deamidationDisulphide bond determinationProtein/Peptide purifi cationProteomicsReferencesAppendix: Column characteristicsAppendix: Amino Acid CharateristicsPages2 - 34 - 56 - 1112 - 181920 - 2122 - 2526 - 3132 - 3334 - 3637 - 3940 - 4546 - 4950-535455 - 60
IntroductionReversed-phase HPLC has become an essential tool in the separation <strong>and</strong> analysis ofproteins <strong>and</strong> peptides. It is widely used in the biotechnology industry to characterizeprotein therap<strong>eu</strong>tic products <strong>and</strong> to analyze these for product identity <strong>and</strong> impurities.Reversed-phase HPLC plays a vital role in the separation of peptides from digestedproteomes prior to protein identification by mass spectrometry. It is also used topurify many proteins <strong>and</strong> peptides during investigative studies <strong>and</strong> is used for largescale purification of protein therap<strong>eu</strong>tic drugs.Reversed-phase HPLC has found a central role in protein studies because of itsversatility, sensitive detection <strong>and</strong> its ability to work together with techniques such asmass spectrometry. Most of all, however, reversed-phase HPLC is widely usedbecause of its ability to separate proteins of nearly identical structure. As illustratedby the separation of bovine, human <strong>and</strong> porcine insulin variants (Figure 1), reversedphaseHPLC is able to separate very similar proteins. Bovine <strong>and</strong> human insulindiffer by only three amino acids <strong>and</strong> are well separated. Bovine insulin has analanine at residue 8 <strong>and</strong> a valine at residue 10 on the insulin ‘a’ chain <strong>and</strong> an alanineat residue 30 of the ‘b’ chain. Human insulin has a threonine at residue 8 <strong>and</strong> anisol<strong>eu</strong>cine at residue 10 on the ‘a’ chain <strong>and</strong> a threonine at residue 30 of the ‘b’Figure 1 Separation ofclosely related insulinvariants by RP-HPLCConditionsColumn: ACE 5 C18,4.6 x 250mmEluent: 29.3 - 31.7% ACN in0.1% TFA over 16 min at 1.0mL/minSample: bovine, human <strong>and</strong>porcine insulinUV absorbance215 nmBovineInsulinHumanInsulinPorcineInsulin8 10 12 14 16 18MinutesPage 2www.ace-hplc.com
Introductionchain. Porcine <strong>and</strong> human insulin differ by just one amino acid (porcine has analanine at residue 30 of the ‘b’ chain; human insulin has a threonine at that position)<strong>and</strong> are baseline resolved. In another example rabbit insulin was separated fromhuman insulin even though they differ by one amino acid, threonine in place ofserine (Reference 1).The high resolving capability of reversed-phase HPLC extends to peptides as well.In Figure 2, two peptides are shown to be well resolved although differing by onlya single amino acid, serine versus threonine.It is this high resolution capability that is the foundation for the widespread use ofreversed-phase HPLC for the separation of proteins <strong>and</strong> peptides.Figure 2. Separation of closely related peptides by RP-HPLC. Two decapeptides differby a single amino acid, a serine in one case <strong>and</strong> a threonine in the other.ConditionsColumn: C18 wide pore,4.6 x 250 mmEluent:A. 0.1% TFA in waterB. 0.08% TFA in ACNGradient: 0 - 35% B over73 min(Reference 2)AQSVPWGISRAQTVPWGISR40 45 50 55 60 65 minswww.ace-hplc.comPage 3
Mechanism of Protein/Peptide RetentionIn reversed-phase HPLC theparticle surface is veryhydrophobic due to thechemical attachment ofhydrocarbon groups to thesurface (wavy red lines inFigure 3). <strong>Proteins</strong> areretained by the adsorption ofa face of the protein (termedthe “hydrophobic foot”) to thehydrophobic surface (Figure3). Since proteins are largecompared to the thickness ofthe hydrophobic surface, onlyFigure 3. The relatively large protein molecule isadsorbed onto the hydrophobic surface by meansof the hydrophobic effecta portion of the protein adsorbs to the hydrophobic surface. Much of the protein liesabove the surface <strong>and</strong> is in contact with the mobile phase. The net interaction causedby this hydrophobic adsorption is very strong resulting in the protein remainingadsorbed to the surface (Figure 4A) until a specific concentration of organic solventis reached, at which time the protein desorbs from the surface <strong>and</strong> elutes from thecolumn (Figure 4B). Although there is some interaction with the surface as theprotein moves down the column after the initial adsorption/desorption, furtherinteractions are minor <strong>and</strong> do not contribute to separation. Separation isaccomplished by the single adsorption/desorption process. The concentration ofFigure 4. <strong>Proteins</strong> entering thecolumn adsorb to the hydrophobicsurface near the top of the column (A)<strong>and</strong> remain adsorbed until the organicmodifi er concentration reaches aspecifi c concentration, when theprotein desorbs from the surface (B).ABPage 4www.ace-hplc.com
Mechanism of Protein/Peptide Retentionorganic modifier required to desorb theprotein is highly specific <strong>and</strong> is a function ofthe size of the hydrophobic foot. For furtherdetails see Reference 3.The adsorption/desorption retentionmechanism leads to protein retentionbehaviour that is different than with smallmolecules in reversed-phase HPLC. Whilesmall molecules change retention slowlywith changes in organic solventconcentration (Figure 5, biphenyl), theretention of proteins changes abruptly oncethe required concentration of organic solventis reached, resulting in a rapid change inretention (Figure 5, proteins). This results inRetention<strong>Proteins</strong>(red, blue,green)Biphenyl(black)0 20 40 60 80Percent organicFigure 5. Retention versus organicsolvent concentrationthe sharp peaks usually seen with proteins <strong>and</strong> peptides (Figure 6A). The largechange in retention with small changes in organic solvent concentration means thatisocratic elution is seldom useful with proteins because peaks become broad <strong>and</strong>small changes in organic solvent concentration result in large changes in proteinretention (Figure 6B).Figure 6.A. <strong>Peptides</strong> <strong>and</strong> proteins elute with sharp peaks during gradient elution.B. With isocratic elution protein peaks, in this case lysozyme, are broad <strong>and</strong> smallchanges in organic solvent result in large changes in retention.AB42% ACN with 0.1% TFA40% ACN with 0.1% TFA39% ACN with0.1% TFA0 30 60 min0 10 20 minwww.ace-hplc.comPage 5
Column CharacteristicsParticles. <strong>Proteins</strong> <strong>and</strong> peptides are separated by interacting with thehydrophobic surface of particles packed in columns. The particles in thecolumn are usually made of silica because silica is physically robust,it is stable under most solvent conditions (except at pH greaterthan 6.5) <strong>and</strong> silica can be made into spherical particles of various sizeswith pores of different diameters.Silica purity. The purity of the silica used in HPLC columns is important inseparation performance. Metal ion impurities cause peak tailing <strong>and</strong> loss ofresolution as shown in Figure 7A (0.01 <strong>and</strong> 0.005% TFA). Silica with metalimpurities (Figure 7A) requires the use of high concentrations of an ion-pair reagent,Figure 7. Silica purity affects peptide peak shape, especially at low concentrations of ionpairingreagent. High purity silica can be used at much lower concentrations of ion-pairingreagent than silica of lower purity.A. Lower purity silica:Vydac C18 , 4.6 x 250 mm0.1% TFAB. High purity silica:ACE 5 C18 , 4.6 x 250 mm0 10 20 min0 10 20 min0.01% TFA0 10 20 min0 10 20 min0.005% TFA0 10 20 30 min0 10 20 minEluent: Gradient 10 - 55% ACN in 37.5 min with TFA as indicatedPage 6www.ace-hplc.com
Column Characteristicstrifluoroacetic acid (TFA), to maintain good peak shape. The use of lowconcentrations of TFA results in poor peak shape <strong>and</strong> loss of resolution. With highpurity silica (Figure 7B), TFA concentrations as low as 0.005% result in goodpeptide peak shape. This is especially important in LC-MS because TFA causes asignal reduction when using the electrospray interface. Low concentrations of TFAresult in better detection signal in LC-MS (see pages 22 - 25)Pore Diameter. Using small pore (~ 100 angstrom) silica normally used in reversedphaseHPLC results in inferior protein separations. Wide pore silica (~ 300 angstromdiameter) gives much better separations of proteins (Reference 4). As illustrated inFigure 8, proteins cannot enter small pores, leaving only the very small exteriorsurface for separations to occur. Wide pore silica allows proteins <strong>and</strong> even largerpeptides to enter the pore <strong>and</strong> fully interact with the surface, thus resulting in betterpeak shape <strong>and</strong> resolution. Wide pore silicas are universally used today for proteinseparations. Small peptides, such as those resulting from protease digests, can enterthe pores of small pore silica <strong>and</strong> interact with the surface <strong>and</strong> therefore small poresilicas may be used for separating protein digests. However wide pore silicas alsoseparate peptides well <strong>and</strong> result in different selectivity <strong>and</strong> resolution.Figure 8. Small pore (~ 100angstrom) particles commonly usedin reversed-phase HPLC (left) donot permit most proteins to enter thepores, thus limiting surfaceinteraction. Particles with wide(~300 angstrom) pores (right) allowproteins to enter <strong>and</strong> interact withthe hydrophobic surface. 100angstrompores300angstromporeswww.ace-hplc.comPage 7
Column CharacteristicsHydrophobic surface. The silica ismodified with a hydrocarbonmolecule in order to create ahydrophobic surface. A chlorosilanewith an attached hydrocarbon chain,such as octadecylchlorosilane, isreacted with the silica (the surfaceof which consists of polar silanolgroups) to attach the hydrocarbon tothe silica surface (Figure 9). Theorganosilane molecules do not reactwith every silanol on the silicasurface because of steric hindrance<strong>and</strong> a significant number of polarFigure 9. The hydrophobic surface isformed by the chemicalattachment of hydrophobiclig<strong>and</strong>s to the silica surfaceby means of anorganochlorosilane.silanols remain on the surface. Aprocess called “end-capping” whereby a small organosilane is subsequently reactedwith the silica surface, further reduces the number of polar silanol groups.Choosing the separation surface. The chemistry used to modify the silica surfaceallows various organic groups to be attached to the silica. The most commonmodification is attachment of a linear, aliphatic eighteen carbon chain resulting in a“C18” or ODS type column (Figure 10A). As shown, the organochlorosilane reactswith many of the silanols, but not all. This creates a fairly thick layer of hydrocarbonon the surface. It is to this thick hydrocarbon layer that proteins <strong>and</strong> peptides adsorb.The C18 column is particularly useful for the separation of peptides less than 2-3,000daltons <strong>and</strong> is usually the column of choice for the separation of peptides resultingfrom protease digestion of proteins (see pages 26 - 31) as well as the separation ofnatural <strong>and</strong> synthetic peptides. A less hydrophobic phase results from the attachmentof butyl (C4) groups to the silica surface (Figure 10B). The butyl phase is mostsuitable for protein separations but can also be used to separate large or hydrophobicpeptides.Page 8www.ace-hplc.com
Column Characteristics<strong>Proteins</strong> can be separatedwith a C18 column,however some proteinshave poor peak shape ortailing peaks on C18columns <strong>and</strong> C4 columnsare recommended forprotein separations.Other columns used forpolypeptide separationsinclude phenyl phases(Reference 6), which aresimilar to C4 columns inhydrophobicity, <strong>and</strong> polarembedded or polarendcapped columnswhich enhance polarinteractions betweenpeptides <strong>and</strong> the particlesurface. This may resultin different selectivity forpeptides.Figure 10.A. C18 hydrophobic phase isbest suited to separationof peptides smallerthan ~ 2000-3000daltonsB. C4 hydrophobic phase isbest suited toseparation ofpeptides greaterthan ~ 3000daltons <strong>and</strong>proteinsPeptide selectivity. Column selectivity for peptides is affected by the nature <strong>and</strong>characteristics of the bonded phase as well as the underlying silica surface. Differentreversed-phase columns may offer different peptide selectivity. In particular: The amount of phase (“carbon load”) on the silica affects selectivity. When lesshydrocarbon is attached to the surface (lower carbon load), polar silanols mayaffect the separation more than on columns with higher carbon load, thusresulting in different selectivity. Different manufacturing processes yield silica with different properties, which canaffect peptide selectivity.www.ace-hplc.comPage 9
Column CharacteristicsColumn Diameter. The st<strong>and</strong>ard diameter of analytical HPLC columns is 4.6 mm.These columns are best run at flow rates of ~1 ml/min. Smaller bore columns arecommercially available <strong>and</strong> are used for specific reasons <strong>and</strong> purposes. Narrow borecolumns (~2 mm i.d.) are run at flow rates of ~ 200 microlitres/min <strong>and</strong> thus use lesssolvent than 4.6 mm i.d. analytical columns. Narrow bore columns also exhibit aboutfive times the sensitivity of st<strong>and</strong>ard analytical columns. This is because the amountof solvent passing through the detector per minute is lower, resulting in a higherconcentration of protein or peptide in the peak. Concentration dependent detectors,such as the UV detector <strong>and</strong> electrospray mass spectrometer, show greater sensitivitywith smaller bore columns.Microbore columns operate at flow rates of ~50 microlitres/minutes <strong>and</strong> thereforetheir use results in even better sensitivity, about 50 times that of an analyticalcolumn. Finally, capillary columns operating at 1 - 50 microlitres/minute flowrates exhibit even higher relative sensitivity, about 200 times the sensitivity of ananalytical column. Microbore <strong>and</strong> capillary columns, however, require specializedinstruments because of the flow rates being used <strong>and</strong> the greater significance ofextra-column dead volume. Much greater care must be taken in the use of very smallbore columns. Column characteristics are summarized in Figure 13 <strong>and</strong> also in theAppendix. See Reference 5 for details regarding the use of small bore columns.Figure 13.Characteristics ofcolumns of differentdiametersColumn type Analytical Narrow Bore Microbore CapillaryDiameter 4.6 mm 2.0 mm 1.0 mm < 1 mmFlow rate ~ 1 ml/min ~ 200L/min ~ 50 L/min 5 - 50 L/minRelative sensitivity 1 5 50 200www.ace-hplc.comPage 11
Mobile Phase<strong>Proteins</strong> are desorbedfrom the hydrophobicsurface with an organicsolvent (Figure 14).When, during thesolvent gradient, theamount of organicsolvent reaches a preciseconcentration which isunique to each protein,the protein desorbs fromthe hydrophobic surface<strong>and</strong> continues down thecolumn <strong>and</strong> elutes fromthe column.Figure 14. <strong>Proteins</strong> are desorbed from the hydrophobicsurface when the organic modifi er concentration reaches aspecifi c value.Acetonitrile. The organic solvent most commonly used in polypeptide reversedphasechromatography is acetonitrile. Acetonitrile is used because it: Is volatile <strong>and</strong> easily removed from the sample. Has low viscosity <strong>and</strong> thus low back pressure. Is quite transparent to low wavelength UV light. Has a long history of successful separations.Isopropanol. Isopropanol plays a particular role in polypeptide chromatography.While seldom used as the sole organic modifier because of its high viscosity (<strong>and</strong>consequent high back pressure), it is useful to improve recovery of somepolypeptides, particularly very hydrophobic proteins. In such cases isopropanol isadded at a constant concentration of 1 - 5 percent to enhance recovery or elution ofhydrophobic polypeptides.Other organic modifiers. Organic modifiers such as methanol or ethanol areseldom used except for very hydrophobic proteins (Reference 7). Ethanol is alsoused for large scale process purification of proteins because of its low toxicity.Page 12www.ace-hplc.com
Mobile PhaseGradient elution. Polypeptides are almost always eluted using a solvent gradientwhere the relative concentration of organic solvent is slowly increased during theseparation. <strong>Proteins</strong> <strong>and</strong> peptides elute when the concentration of the organicmodifier rises to the precise concentration required for desorption. As illustrated inFigure 15, the slower the rate of change of organic modifier concentration (thegradient slope), the better the resolution of these protein subunits. In this example aslope of 0.25% per minute resulted in significantly improved resolution compared toa slope of 0.5% per minute.Figure 1 (Page 2) showsthe separation of insulinvariants which wereseparated with a solventchange of 0.15% perminute. A gradient slopeas low as 0.05% per minutemay be used for maximumresolution.A reduction of thegradient slope toimprove resolution mustbe tempered with theneed for keepinganalysis time as short aspossible. However,adjusting the gradientslope is important inoptimizing resolution ofproteins <strong>and</strong> peptides.Figure 15. Reducing the rate of change of organic solventin the gradient generally improves resolution.A. cytochrome c subunitsB. Re-chromatography of a fraction collected from themiddle of chromatogram A.Column: C4 wide pore, 4.6 x 250 mm(Reference 8)A. 25 - 50% ACN, 50 minslope = 0.5%B. 35 - 45% ACN, 40 minslope = 0.25%www.ace-hplc.comPage 13
Mobile Phase<strong>Peptides</strong> sometimes exhibit a peculiar behaviour as the gradient slope is decreased(Figure 16). Instead of improving resolution as expected, resolution is sometimesreduced leading to coelution <strong>and</strong>, sometimes, even a reversal of elution order. Inthe example in Figure 16, peptides 11 <strong>and</strong> 12 are best separated with a 45 minutegradient. When the gradient time is extended to 90 minutes, resolution betweenpeptides 11 <strong>and</strong> 12 decreases <strong>and</strong>, with a gradient of 160 minutes, the two peptidescoelute. This retention behaviour is due to effects of the peptide-surface interaction,the cause of which is not well understood. It is, therefore, important whendeveloping peptide separations, particularly when separating protease digestsamples, to observe changes in resolution as the gradient slope is decreased. Ifresolution decreases instead of increasing then the slope must be carefullyoptimized to maximize overall resolution.Figure 16. Resolution between peptides sometimes decreases as the rate of changein the solvent concentration decreases (gradient time is increased). This can lead toreduced resolution or coelution, as exemplifi ed by peptides 11 <strong>and</strong> 12 in the peptide mapof human growth hormone. In some cases peptides may even reverse elution order.(Reference 10)Sample. Tryptic digest of human growth hormone. Shown is a part of the peptide map.45 min 90 min 160 min11 12 111211 + 12Column: C18 wide pore, 4.6 x 150 mmEluent: Gradient: 0 - 60% ACN over time as indicated with 0.1% TFA in the aqueoussolvent <strong>and</strong> 0.08% TFA in the organic solvent forming the gradient.Page 14www.ace-hplc.com
Mobile PhaseThe reversed-phase chromatography of proteins <strong>and</strong> peptides requires a reagent,called an “ion-pair”, added to the mobile phase in order to achieve good peak shape.It is believed that metal impurities on the silica surface are responsible for poorprotein/peptide peak shape in the absence of an ion-pair reagent.Trifluoroacetic acid. The most commonly used ion-pair reagent is trifluoroaceticacid (TFA). TFA added to the mobile phase at a concentration of ~0.1% results ingood peak shape on most columns (Figure 17). Lowering the concentration of TFAimproves LC-MS detection sensitivity (see pages 22 - 25) but may result in poorpeak shape on silica columnsbecause of impurities on the silicasurface (Figure 17B). High puritysilica columns, however, can be usedat very low concentrations of TFA(Figure 17A - 0.01% TFA).The TFA concentration mayaffect peptide selectivity. InFigure 17A (high purity silica), twopeptides coelute with a TFAconcentration of 0.1% but areresolved with a TFA concentrationof 0.01%. (In Figure 17B - lowerpurity silica - the two peptidesremain unresolved). Generally,varying the concentration of TFAfrom 0.2% to 0.01% may improvethe selectivity of peptide separationson high purity silicas. Theconcentration of TFA may also beincreased to solubilize hydrophobicproteins or peptides, however somecolumns may not be stable at TFAconcentrations higher than 0.1%.Figure 17. The effect of TFA concentrationson peak shape <strong>and</strong> selectivityA. ACE 5 C18 - 300High purity silica1 & 21230.1% TFA3 1 & 2 30.01% TFAB. Vydac 218TPLower purity silica1 & 2Eluent: Gradient 20 - 32% ACN in 15 min withTFA as indicatedSample. 1. Angiotensin II 2. Angiotensin III3. Angiotensin I3www.ace-hplc.comPage 15
Mobile PhaseThe effect of pH on peptide retention. Reversed-phase mobile phases used forpeptide separations are generally adjusted to low pH, whether using TFA, phosphoricacid or other ion-pair reagents. At low pH, carboxylic acid groups - the carboxyterminal group <strong>and</strong> the side chains of aspartic <strong>and</strong> glutamic acid - will be protonated<strong>and</strong> only slightly polar. Increasing the mobile phase pH to 6 -7 will cause thecarboxylic acid groups to ionize, making the peptide less hydrophobic. This reducesthe retention of all peptides, but particularly affects peptides containing aspartic orglutamic acid (Figure 19). The retention of aspartic <strong>and</strong> glutamic acid containingpeptides will be reduced more than other peptides, thus changing selectivity.Although increasing the mobile phase pH for peptide separations is not usedfrequently, it can be useful in certain cases (see page 36 for an example).Figure 19. The pH of the mobilephase affects peptide retention,particularly of those containingacidic amino acid residues(aspartic <strong>and</strong> glutamic acids).ConditionsColumn: ACE 5 C18-300 , 4.6 x250 mmEluent:A. Gradient 20 - 32% ACN in 15min with 0.1% TFA, pH 2B. Gradient 20 - 32% ACN in 15min with 10mM NH 4OAc, pH 7Sample.1. Angiotensin II2. Angiotensin III3. Angiotensin IA. 0.1% TFA, pH 2.01&233B. 10 mM NH 4OAc, pH 7.01 20 2 4 6 8 10 12 14 minwww.ace-hplc.comPage 17
Mobile PhaseFlow rate. The mobile phase flow rate has little effect on reversed-phase HPLCresolution. As illustrated in Figure 20, the resolution of peptides from a tryptic mapis about the same when using flow rates of 0.5, 1.0 or 2.0 ml/min. The gradientvolume however, must be constant in order to maintain the resolution. This requiresreducing the gradient time as the flow rate is increased. The system pressureincreases as the flow rate is increased <strong>and</strong> pressure may limit the flow rate that can b<strong>eu</strong>sed. Higher flow rates also decrease detection sensitivity slightly but may increasesolubility of large or hydrophobic proteins.Figure 20. The mobilephase fl ow rate has littleeffect on peptide resolution.The total gradient volumemust be held constant asfl ow rate is changed in orderto maintain resolution.ConditionsColumn: C18 small pore,4.6 x 250 mmEluent: 10 - 50%acetonitrile with 0.1%TFA over time <strong>and</strong> withfl ow rate as indicatedSample. tryptic digest of-lactoglobulin2 ml/min, 20 min0 2.5 5 7.5 10 12.5 min1 ml/min, 40 min0 5 10 15 20 25 min0.5 ml/min, 80 min0 10 20 30 40 50 minPage 18www.ace-hplc.com
DetectionWhen separating polypeptides by reversed-phase HPLC, detection is normally byUV absorption at 214-215 nm. The peptidebond absorbs well in this wavelength range<strong>and</strong> provides the most sensitive detection forpolypeptides of all types.One concern when using the low UV regionfor detection is absorbance by the mobilephase. Acetonitrile does not absorb UV lightat 215 nm, however TFA absorbs slightlyin this region. During gradient elution, theincreasing concentration of organic solventcauses the dielectric constant of the solutionto change which results in a shift in theabsorbance spectrum of TFA in the low UVregion. This absorbance shift results in anupward drift of the baseline as illustrated in Figure 21. It is particularly noticeablewhen sensitive detection is required. As an example, peptide maps will often displayan increasing baseline(Figure 22). A commonpractice to avoid thisbaseline shift is to reducethe TFA concentration inthe organic solventrelative to the aqueoussolvent. If 0.1% TFA isadded to the aqueoussolvent, then 0.08-0.09%TFA is added to theorganic solvent. Thisresults in a flatterbaseline during peptidemap elution.Figure 21. The increasingconcentration of acetonitrile duringa gradient changes the dielectricconstant of the mobile phase whichresults in an increasing baseline dueto a shift in the absorbance spectrumof TFA. (Reference 11)UV absorbance0 10 20 30 40 50 60 70Percentage acetonitrileFigure 22. A baseline shift may be seen in a peptide mapdue to the change in TFA absorbance as the organicsolvent concentration increases.www.ace-hplc.comPage 19
Effect of TemperatureColumn <strong>and</strong> mobile phase temperature canaffect peptide separations in two ways.Retention is reduced slightly with increasedtemperature. However, more importantly, therelative retention (selectivity) of peptide pairsdepends on the temperature. Changes inselectivity with temperature affects resolution<strong>and</strong> temperature can be an important factor inoptimizing the separation of a series ofpeptides, such as those produced during theprotease digestion of a protein. The separationof a series of synthetic peptides as a functionof temperature is shown in Figure 23. Peptideretention decreased slightly as the temperaturewas increased but, more importantly,resolution between peptide pairs changed withthe changes in temperature.Figure 23. Increasing thetemperature reduces the retentionof peptides. More importantly, thetemperature affects the relativeretention or selectivity, which affectsresolution18 O C21 O C25 O CIt is therefore important to control thetemperature of column <strong>and</strong> mobile phasewhen separating peptides. Temperature is alsoan important variable to optimize whendeveloping peptide separations, particularlyseparations of peptide maps.10 20 30 40 50 minConditionsColumn: C8, 2.1 x 150 mmMobile phase: Gradient from 0 to30% acetonitrile in 0.05% TFA over60 minutesSample: synthetic helical <strong>and</strong>nonhelical peptides (Reference 12)The separation of peptides in a peptide mapcan be significantly affected by temperature as shown in Figure 24. In this exampleof the separation of peptides from the tryptic digest of human growth hormone,raising the temperature of the column not only affects peptide selectivity but can alsocause a reversal on elution order. <strong>Peptides</strong> 7 <strong>and</strong> 8 are much better resolved at highertemperatures. <strong>Peptides</strong> 11 - 13 are best resolved at 40 O C <strong>and</strong> raising the temperatureto 60 O C causes peptides 11 <strong>and</strong> 12 to nearly co-elute. <strong>Peptides</strong> 14 <strong>and</strong> 15 are wellresolved at 20 O C with peptide 15 eluting first. Raising the temperature to 40 O CPage 20www.ace-hplc.com
Effect of TemperatureFigure 24. The relative retentionof peptides from the digestion ofa protein is often signifi cantlyaffected by the temperature.ConditionsColumn: C8 wide pore, 4.6 x150 mmMobile phase: Complexgradient from 0 to 60%acetonitrile in 0.1% TFA over60 minutesSample:Tryptic map of human growthhormone(Reference 13)7778 20 O C.1310 9 11 12158860 O C.11+12 15131415 20 25 30 min1440 O C.11 12 131510 91410 9causes peptide 14 to elute before peptide 15. Raising the temperature to 60 O Cimproves resolution between 14 <strong>and</strong> 15. Clearly, the column temperature can have asignificant effect on resolution in apeptide map.Protein resolution is less affected bytemperature than peptide resolution,however protein peak shape <strong>and</strong>recovery is generally improved athigher temperatures, especially forlarge or hydrophobic proteins.Monoclonal antibodies chromatographwith poor peak shape at ambienttemperatures but peak shape improvesconsiderably when highertemperatures are used (Figure 25).Large or hydrophobic proteins oftenchromatograph best at elevatedtemperatures.www.ace-hplc.comFigure 25. The effect of temperature on theRP-HPLC chromatography of a recombinantmonoclonal antibody. (Reference 14)70 o C55 o C35 o C15 20 25 30 40 45 minConditionsColumn: C8 wide pore, 3.5 micron,4.6 x 150 mmMobile phase: Complex gradient:20-90% ACN with 0.1% TFA.Sample:Recombinant monoclonal antibodyPage 21
Reversed-Phase HPLC - MSThe combination of reversed-phase HPLC <strong>and</strong> mass spectrometry (MS) provides apowerful tool for protein/peptide analysis. Mass spectrometry interfaces withreversed-phase HPLC by means of the electrospray ion source, developed in the1980s by John Fenn <strong>and</strong> colleagues. The benefits of using mass spectrometry on-lineafter chromatography include: MS is a very sensitive detection technique. MS provides the molecular weight of separated peptides/proteins. MS can specifically detect proteins or peptides by mass. Fragmentation information can help identify peptides. MS separates <strong>and</strong> measures based on charge <strong>and</strong> mass <strong>and</strong> is, therefore,“orthogonal” to reversed-phase, which separates by hydrophobicity.HPLC-MS is widely used for the analysis of peptide maps, providing an orthogonalmeans of peptide detection (Reference 15). As illustrated in Figure 26, a total ionmass chromatogram parallels the UV chromatogram, however the peaks are ofdifferent magnitude because of orthogonal detection. Peaks that appear small by UVdetection may, in fact, appear more significant by MS (Figure 26, see *).Figure 26. Separationsof peptide maps can bemonitored by both UVdetection <strong>and</strong> massspectrometry. Peak heightis a function of thedetection method <strong>and</strong>differs signifi cantlybetween UV <strong>and</strong> MStraces. Especially notethe pair of peptidesmarked by the *. Theseappear to be small byUV detection but appearmuch more signifi cant byMS. (Reference 16)MS Total Ion TraceUV 215 nm Trace**Page 22www.ace-hplc.com
Reversed-Phase HPLC - MSBy measuring the molecular weight of the peptide(s) present in each of the peaks,mass spectrometry provides useful information that assists in identifying the peaksseparated by RP-HPLC. Since mass spectrometry is orthogonal to RP-HPLC, MSalso confirms the purity of each peak or shows that two or more peptides are coeluting<strong>and</strong> reports their molecular weights. Figure 27 illustrates this for three peaksin a peptide map. Peak A, which elutes early in the separation, is a 439 daltontetrapeptide. Peak B is a glycopeptide, with an attached oligosaccharide or glycan.This is confirmed by the presence in the MS spectrum of Peak B of ions of m/z 204<strong>and</strong> 366, which are indicative of glycosylation. Peak C is a disulphide-linkeddipeptide - two peptides connected by a disulphide bond. The peptide is shown to bein four ions: +1, +2, +3 <strong>and</strong> +4. A +4 ion is only possible with dipeptides that havetwo amino termini <strong>and</strong> two basic amino acids.Figure 27. Combining the separation power of reversed-phase with a second dimensionof mass spectrometry provides considerable information on peptide maps.(Reference 18)A. This peak is identified as a small peptide by MS.B. The peak detected is identifi ed as a glycan (sugar) containing peptide.C. This peak is a dipeptide, two peptides connected by a disulfide bond.A 204 m/z B +3C439 m/z +2366 m/z+4 +1minwww.ace-hplc.comPage 23
Reversed-Phase HPLC - MSTwo important aspects of HPLC-MSare the optimum flow rate of theelectrospray interface <strong>and</strong> the effect oftrifluoroacetic acid on peptideionization.Figure 28. The Red line indicates theresponse versus fl ow rate of the basicelectrospray interface. The Blue lineindicates the same response for thepn<strong>eu</strong>matic-assisted electrospray.The signal from a basic electrospraydrops off rapidly above 5 - 10microlitre/minute flow (Figure 28).This is incompatible with the flowrates used with st<strong>and</strong>ard analyticalHPLC columns. Commercialelectrosprays now provide a highshear flow of nitrogen gas parallel tothe electrospray (“pn<strong>eu</strong>matic-assistedelectrospray”) which boosts the optimal flow region of the electrospray to 200 - 500microlitre/minute (Reference 19). This is still below the optimum flow rate normallyused with st<strong>and</strong>ard analytical columns, consequently, scientists today generally usenarrowbore columns (~2 mm i.d.) atflow rates of 200 - 300 microlitre/minute when using HPLC-MS.As shown in Figure 29, the presenceof TFA in the mobile phase flowinginto the electrospray results indecreased signal for proteins <strong>and</strong>peptides. This is due to the verystrong interaction between TFA <strong>and</strong>polypeptides, effectively n<strong>eu</strong>tralizingthe polypeptide.Basic ESIPn<strong>eu</strong>maticassistedESI1 10 100 1000L/minFigure 29. TFA is shown to substantiallyreduce the signal from peptides when usingthe electrospray interface. (Reference 17)0.2% TFA No TFAPage 24www.ace-hplc.com
Reversed-Phase HPLC - MSThere are two approaches to correct thereduction of signal due to the TFA: Ignore the loss of signal. Often sufficientsignal remains to obtain useful data evenwith the reduction in signal. In such casesthe signal loss can be ignored. When the signal loss is too great, the bestsolution is to use high purity silicacolumns with reduced TFAconcentrations. High purity columns canbe used with very low concentrations ofTFA <strong>and</strong> still maintain peak shape (Figure30). Using high purity silica columnsresults in good signal response <strong>and</strong> goodpeak shape.Other options include the use of formic acid inplace of TFA or the replacement, post-column,of the TFA with acetic or propionic acid(Reference 17). Formic acid, however, does notgive as good a peak shape as TFA or as gooda separation, so performance is compromised.This is acceptable in proteomic applicationsbut not in the analysis of protein therap<strong>eu</strong>ticdrugs. Replacement of the TFA post-column iscumbersome <strong>and</strong> causes the loss of resolution.Figure 30. High purity silica can b<strong>eu</strong>sed with very low concentrationsof trifl uoroacetic acid <strong>and</strong> maintainpeptide peak shape.A. 0.1% TFA0 10 20 minB. 0.01% TFA0 10 20 minC. 0.005% TFA0 10 20 minColumn: ACE 5 C18, 4.6 x 250 mm(high purity silica)Eluent: Gradient 10 - 55% ACN in37.5 min with TFA as indicatedwww.ace-hplc.comPage 25
Peptide MappingReversed-phase HPLC has become a st<strong>and</strong>ard method in the analysis <strong>and</strong>characterization of proteins, especially of therap<strong>eu</strong>tic drug products. As a resultof high resolving power <strong>and</strong> good detection sensitivity, reversed-phase analysis isable to provide a great deal of information about proteins. <strong>Proteins</strong> are sometimesanalyzed as intact molecules, however, more often, the protein is broken in piecesby cleaving the backbone at specific amino acid residues using protease enzymes.The resulting peptide fragments are then analyzed by reversed-phase HPLC. Thistechnique, called peptide mapping, is a st<strong>and</strong>ard approach to the analysis of proteins.Much information about a protein can be obtained by reversed-phase analysis of thepeptide fragments of the protein. Comparison of the peptide map of an expressed protein with that of a referencest<strong>and</strong>ard protein can ensure genetic purity <strong>and</strong> expression accuracy. Peptidemaps are often used as an identity analysis tool for protein therap<strong>eu</strong>tic drugs. Peptide maps allow the determination of protein degradation products such asdeamidated asparagine <strong>and</strong> oxidized methionine. Peptide maps can determine or verify disulphide bond linkages which arerequired to ensure tertiary structure <strong>and</strong> therap<strong>eu</strong>tic efficacy. Peptide maps can help determine the sites of glycosylation (addition ofcarbohydrate entities) as well as opening the door to detailed identification ofthe oligosaccharide attached. Peptide maps performed with mass spectrometry detection provide an advancedmeans of protein identification, peptide sequencing <strong>and</strong> data confirmation.Protease digests are also used in the identification <strong>and</strong> quantitation of proteins instudying biological proteomes (Reference 20).Page 26www.ace-hplc.com
Peptide MappingThere are a number of protease enzymes which cleave the backbone of proteins,usually at specific amino acid residues. These include:ProteaseTrypsinLys-CS. aur<strong>eu</strong>s V8Asp-NSpecificityCleaves at the C-terminusof lysine <strong>and</strong> arginineCleaves at the C-terminusof lysineCleaves at C-terminus ofacidic amino acids glutamic<strong>and</strong> aspartic acid.Cleaves at the N-terminusof aspartic acidCharacteristicsProduces on average onepeptide for every 10-12 aminoacids. Trypsin is the mostcommonly used protease.Produces 60-70% as manypeptides from a protein astrypsin. The advantage ofLys-C is that it remains activein concentrations of urea ashigh as ~4 M.Provides complementaryinformation to trypsin.Provides complementaryinformation to trypsin.Trypsin is the most commonly used enzyme to cleave proteins (protease). There arefive steps in the digestion of proteins by trypsin: (Note: an excellent review of trypticdigestion is found in Reference 21)1. Denaturation. <strong>Proteins</strong> must be denatured to be digested in reasonable time.<strong>Proteins</strong> are denatured by incubation in a chaotropic reagent such as 6Mguanidine HCl or 8M urea buffered at n<strong>eu</strong>tral pH (~ 7.5) for ~30 minutes atelevated temperature (37 O C).2. Reduction of disulphide bonds. Disulphide bonds prevent completedenaturation of a protein. The disulphide bonds in a protein being digested ar<strong>eu</strong>sually reduced during the denaturation step by the addition of a reducing agentsuch as dithiothreitol (DTT) at a concentration of ~20 mM.www.ace-hplc.comPage 27
Peptide Mapping3. Carboxymethylation of free cysteines. If the reduced cysteines remain freethey are likely to reform disulphide bonds which are incorrect. To avoid this, freecysteines are methylated by the addition of a reagent such as iodoacetic acid at aconcentration of ~ 60mM <strong>and</strong> incubated at 37 O C for thirty minutes. The reactionis quenched with 100 mM DTT.4. Removal of salt. Digestion cannot proceed in the presence of urea or guanidinebecause trypsin (a protein) will itself be denatured <strong>and</strong> lose enzyme activity. Th<strong>eu</strong>rea or guanidine must be removed or reduced below 1M concentration by ionexchange or dialysis.5. Trypsin digestion. After salt removal the protein is dissolved in a buffer, eitherTris or ammonium carbonate at pH 7.5 - 8.5 (the pH of maximal activity fortrypsin), one part trypsin is added to 20-100 parts of the protein being digested<strong>and</strong> the protein is incubated at temperatures from subambient to 37 O C.Subambient temperatures require incubation times as long as sixteen hours.Digestion at 37 O C is complete in 1 - 4 hours, depending on the protein. If thetime, temperature or relative concentration of trypsin is too low, digestion willbe incomplete <strong>and</strong> potential cleavages may not occur, resulting in larger peptideswith internal lysine or arginine. If the time, temperature or concentration oftrypsin is too high then trypsin may digest itself, producing “auto-lysis” products,that is peptides from trypsin, confusing interpretation. A common practice is toperform a digestion omitting the protein but including the trypsin. The resultingsample is chromatographed under the same conditions as the full protein digest,thus revealing the extent of trypsin autolysis as well as the location of any trypsinpeptides in the peptide map. Digestion time, temperature <strong>and</strong> relativeconcentrations of trypsin <strong>and</strong> protein are optimized in developing a trypticdigestion protocol.When peptide maps are to be used to determine the location of disulphide bonds,a protein must be digested without reducing the disulphide bonds. Many proteins,however, digest very slowly if the disulphide bonds are not reduced. In caseswhere digestion is slow or poor in the absence of a reducing agent, then Lys-Cmay be used in place of trypsin <strong>and</strong> the digestion performed in 4M urea toPage 28www.ace-hplc.com
Peptide Mappingmaintain the protein denatured during digestion. Surfactants that are sometimesused to maintain proteins in solution during digestion degrade chromatographicresolution <strong>and</strong> should be avoided.See Reference 22 for an example of a peptide map of a monoclonal antibody.Analysis of tryptic digestion. The peptides from a protein digestion are analyzedby reversed-phase HPLC using a mobile phase containing TFA (see Pages 15 - 17)<strong>and</strong> with a gradient starting at about five percent acetonitrile (starting concentrationsof acetonitrile of less than five percent may result in irreproducible chromatographyof early eluting peptides) <strong>and</strong> increasing to 70 percent acetonitrile (See Figure 31).The length of the gradient time depends on the size of the protein being digested.Large proteins produce more peptide fragments than small proteins <strong>and</strong> requirelonger gradient times to separate all of the fragments. The peptides from smallproteins (less than ~20kd) can usually be separated in 45 - 60 minutes. Largerproteins (20-50kd) require longer gradient times of 60 - 120 minutes. The largestproteins (>50kd) require gradient times of 120 - 180 minutes. The flow rate is set at1 - 2 ml/minute with the temperature adjusted to give the best resolution (See Pages20 - 21). The column used is generally C18 reversed-phase. Columns with 100angstrom or 300 angstrom pores may be used <strong>and</strong> will often differ in selectivity.Figure 31. Peptide map of bovine serum albuminColumn: ACE 5 C18-300 wide pore, 4.6 x 150 mmMobile phase: Complex gradient from 4% - 70% ACN over 120 minutes,with 0.1% TFA in both solvents.0 20 40 60 80 100Minuteswww.ace-hplc.comPage 29
Peptide MappingProtein modifications result in changes in peptide retention. If a protein ischanged in any way due to translational or expression errors, degradation(deamidation, oxidation) or process variation, the change will be reflected in one ormore of the peptide fragments. Due to the sensitivity of reversed-phase interactionswith peptides, any changes in a peptide result in a change in the retention time of thatpeptide. In the example in Figure 32, two decapeptides that differ by one amino acid- a threonine in one <strong>and</strong> a serine in the other - are separated by reversed-phase HPLC.Not only is the difference only a single amino acid, but both of the amino acids arehydroxy amino acids <strong>and</strong> they differ by the addition of a methyl group on thethreonine side chain. This illustrates that any change to a protein will be reflected ina change in a peptide which leads to a shift in the retention of that peptide. Theessence of peptide mapping is the ability of reversed-phase HPLC to resolve peptideswith minor differences.Figure 32. Separation of closely related peptides by RP-HPLC. Two decapeptides differby a single amino acid, a serine in one case <strong>and</strong> a threonine in the other.ConditionsColumn: C18 wide pore,4.6 x 250 mmEluent:A. 0.1% TFA in waterB. 0.08% TFA in ACNGradient: 0 - 35% B over73 min(Reference 2)serAQSVPWGISRAQTVPWGISRthr40 45 50 55 60 65 minsPage 30www.ace-hplc.com
Peptide MappingComparison of the peptide map of test sample with the peptide map of areference protein. Peptide maps provide much information about proteins. Acommon practice is to compare the peptide map of a test protein with the peptidemap of a reference protein. In Figure 33, the peptide map of methionyl humangrowth hormone (as expressed in E. Coli) is compared with the peptide map of nativehuman growth hormone (lacking the methionine). The met-hGH peptide elutes laterthan the non-met hGH peptide because methionine is hydrophobic. In this examplethe second map is inverted for ease of comparison. In some cases a mixture of thetwo digestion mixtures is chromatographed in order to confirm minor changes <strong>and</strong>ensure that analytical artifacts are not responsible for changes in the peptide map.Peptide map comparisons reveal changes <strong>and</strong> modifications to proteins such asgenetic changes, mis-translations, protein degradations (deamidation, oxidation) <strong>and</strong>changes in post-translational modifications.Figure 33. Comparison of peptide maps of native Met-hGH <strong>and</strong> hGH lacking the terminalmethionine. (Reference 24)Conditions:Column: C18 wide pore, 4.6 x 150 mmMobile phase: Gradient from 0 - 70% ACN with 0.1% TFA in each solvent.Peptide map of Met-hGHN-terminal peptidewith metPeptide map of hGHN-terminal peptidelacking met0 10 20 30 40 50Minuteswww.ace-hplc.comPage 31
Protein OxidationWhen a protein experiences oxidizingconditions, although several aminoacids may be affected, the most likelyamino acid to be oxidized ismethionine, which is converted tomethionine sulphoxide (Figure 34). Theoxidation of a methionine residuedepends on its location in the protein. Amethionine buried in the interior of aprotein is not likely to be oxidized.Figure 34. Methionine is converted tomethionine sulphoxide under oxidizingconditions. (See References 23, 25, 30)Methionine side chains near the surface <strong>and</strong> in contact with the solvent are mostlikely to be oxidized. Oxidizing conditions include heat, the presence of transitionmetals <strong>and</strong> the presence of oxygen in the solution. Like deamidation, methionineoxidation may lead to a loss or reduction of biological activity or, in some cases,have no affect on biological activity. This depends on the location of the methioninein the protein. However, the presence of a methionine sulphoxide indicates that theprotein has experienced oxidizing conditions <strong>and</strong>, therefore, methionine oxidation isan indictor of the protein having experienced stress conditions.Figure 35. Reversed-phaseseparation of mono- <strong>and</strong> di-oxidizedrecombinant coagulation factor VIIafrom the native protein.ConditionsColumn: C4 wide pore, 4.6 x250 mmMobile phase: Gradient from37 - 47% acetonitrile in 0.1%TFA over 30 minutes.Sample: Recombinantcoagulation factor VIIapartically oxidized withhydrogen peroxide.(Reference 31)rCF VIIa, met298, met 306dioxidizedrCF VIIa, met298 oxidizedrCF VIIa, met306 oxidizedrCF VIIaPage 32www.ace-hplc.com
Protein OxidationProtein therap<strong>eu</strong>tic drugs are routinely monitored for oxidation both because of thepossible effects on biological activity <strong>and</strong> as an indicator. The oxidation of amethionine causes a decrease in the hydrophobicity of a protein <strong>and</strong> consequently anoxidized protein will elute before the native protein in reversed-phase HPLC asillustrated in Figure 35. Recombinant coagulation factor VIIa (rCF VIIa) waspartially oxidized with hydrogen peroxide <strong>and</strong> the solution analyzed by reversedphaseHPLC. The dioxidized protein (two oxidized methionine residues) elutes first.The two variants with a single oxidized methionine elute next followed by the nativeprotein. Good resolution was seen between all four species. The remarkableseparation is that between the two singly oxidized protein variants. These each haveone oxidized methionine <strong>and</strong> differ only in which methionine is oxidized.Methionine oxidation is usually monitored using a peptide map. As shown in Figure36, peptides containing oxidized methionine elute significantly earlier than peptideswith native methionine. T2 met ox elutes well before the native T2 tryptic fragment<strong>and</strong> T11 met ox elutes well before T11 native, making identification <strong>and</strong> monitoringeasy.Figure 36. Peptide maps ofpartially oxidized humangrowth hormone.ConditionsColumn: C18 wide pore,4.6 x 250 mmMobile phase: Gradientfrom 0 to 40% acetonitrilein 0.1% TFA over 120minutes.(Reference 32)met125 oxidized hGHT11 Met OXmet14 oxidized hGHT2 Met OXT11NativeT2 Native0 20 40 60 80 100 120 minwww.ace-hplc.comPage 33
Protein DeamidationWhen subjected to either hightemperatures or high pH, proteinsoften degrade. The most likelychemical degradation to occurunder stressed conditions is theconversion of the amide side chainof asparagine to either aspartic acidor isoaspartic acid (Figure 37).Many proteins lose biologicalactivity when an asparagine isdeamidated although the biologicalactivity of some proteins is not affected. Even when deamidation does not cause areduction of biological activity, deamidation acts as an indicator of protein exposureto adverse conditions. The likelihood of deamidation of a specific asparagine residuedepends on its location within the tertiary structure of the protein. The onlyasparagine residues that will deamidate are those near the surface with access to thesolvent. Adjacent amino acid residues also affect the rate of deamidation. Glycinelocated next to the asparagine greatly increases the likelihood of deamidation. Largehydrophobic aminoacids such as l<strong>eu</strong>cine<strong>and</strong> isol<strong>eu</strong>cine nextto the asparaginereduce the rate ofdeamidation.Since deamidationmay affectbiological activity<strong>and</strong> indicatesexposure to adverseconditions, it iscommon practice tomonitor proteinFigure 37. Asparagine is converted toasparatic acid by exposure of the side chain tohigh temperature <strong>and</strong>/or high pH. (References23, 25, 26)Figure 38. Reversed-phase assay for deamidation ofhuman growth hormone (Reference 27)ConditionsColumn: C4 wide pore,4.6 x 250 mmMobile phase: 29%Isopropanol, 71% 10mM Tris-HCl, pH 7.5deamidatedproductsNativehGH0 5 10 15 20 minPage 34www.ace-hplc.com
Protein Deamidationtherap<strong>eu</strong>tic drugs for asparagine deamidation. This is commonly done usingreversed-phase HPLC. An assay measuring deamidation of human growth hormoneby the reversed-phase chromatography of the intact protein molecule is shown inFigure 38. This assay is run at pH 7.5 so that the aspartic acid resulting fromdeamidation is ionized. This makes the deamidated growth hormone lesshydrophobic than the native protein, causing it to elute before the native protein.A more common approach for determining deamidation is by the retention ofasparagine/aspartic acid containing peptides in a peptide map. In peptide mapsrun at pH ~2, a deamidated peptide containing aspartic acid will be slightly morehydrophobic than the native asparagine-containing peptide <strong>and</strong> thus elutes slightlylater than the native peptide as illustrated in Figure 39. The deamidated peptide iseasily identified <strong>and</strong> measured, providing a good method for measurement ofdeamidation.Figure 39. Peptide map of partially deamidated ribonucleaseConditionsColumn: C18 wide pore, 4.6 x 250 mmMobile phase: Complex gradient from 5% ACN in 0.1% TFA to 38%acetonitrile in 0.1% TFA over 100 minutes. (Reference 28)Partially deamidatedribonucleasenativepeptidedeamidatedpeptide0 20 40 60 80 100 minwww.ace-hplc.comPage 35
Protein DeamidationSometimes a deamidated peptide is either poorly separated from the native peptide orcoelutes with another peptide in the map. If resolution is insufficient, the peptidemap can be run at elevated pH. As shown in Figure 40, a deamidated peptide that ispoorly resolved at low pH can be well separated from the native peptide by using apH of 6.5. In the low pH peptide map of partially deamidated human growthhormone (Figure 40A) the deamidated peptide elutes slightly later than the nativepeptide but is not resolved from another peptide in the map. The peptide peaks werecollected <strong>and</strong> re-chromatographed at higher pH (pH 6.5). The aspartic acid in thedeamidated peptide is ionized at higher pH <strong>and</strong> the deamidated peptide elutes wellbefore the native, asparagine-containing peptide (Figure 40B).Figure 40. Separation of a deamidated peptide from a native peptide in a peptide map ofpartially deamidated human growth hormone. (Reference 29)A. Peptide map of partially deamidated hGH at pH 2 (0.1% TFA)B. Re-chromatography of fractions collected in A containing the native peptide (top) <strong>and</strong>deamidated peptide (bottom) chromatographed at pH 6.5Column: C4 wide pore, 4.6 x 250 mmA. Mobile phase: Gradient withACN in 0.1% TFA, pH 2.0B. Mobile phase: Gradient with ACNin 30 mM NaPhosphate, pH 6.5pH 2nativepeptidedeamidatedpeptidepH 6.5nativepeptidedeamidatedpeptide20 30 40 50 min0 10 20 30 minPage 36www.ace-hplc.com
Disulphide Bond Determination<strong>Proteins</strong> rely on correct disulphidebonding to maintain tertiary structure<strong>and</strong> biological activity. If disulphidebonds are reduced or switched, a proteinwill lose native tertiary structure <strong>and</strong>will not be biologically active. HPLCretention depends on the size of aprotein’s “hydrophobic foot” (Figure41), which is affected by the tertiarystructure. Changes in disulphide bondingusually increase the size of the “hydrophobicfoot”, which causes an increasein reversed-phase HPLC retention of theprotein. In Figure 42, native interl<strong>eu</strong>kinFigure 41. Protein retention depends onthe size of the “hydrophobic foot”.Reduced disulphide bonds allow theprotein structure to partially denature,which enlarges the “hydrophobic foot” <strong>and</strong>increases reversed-phase retention.II eluted significantly earlier than reduced interl<strong>eu</strong>kin II due to the change in tertiarystructure when the disulphide bonds were reduced.Figure 42. The “hydrophobic foot” of interl<strong>eu</strong>kin II enlarges with the reductionof disulphide bonds, resulting in increased retention in reversed-phase HPLC,ConditionsColumn: C18 wide pore, 4.6 x 250 mmMobile phase: Gradient from 44.5to 50.8% ACN over 90 minutes at2 ml/minSample: Interl<strong>eu</strong>kin II muteins(Reference 33)Native IL2Reduced IL2 withoxidized metReduced IL2www.ace-hplc.comPage 37
Disulphide Bond DeterminationFigure 43. Separation of insulin-like growth factor with normal disulphide linkages <strong>and</strong>with switched disulphide bonds. (Reference 26)ABrIGF,normaldisulphidebondsrIGF,switcheddisulphidebondsConditionsColumn: C4 wide pore, 4.6 x 250 mm0 10 20 30minutesMobile phase: Gradient from 20 to 38% acetonitrile:isopropanol (88:12) in 0.1% TFAover 27 minutes. (Reference 34)Even small changes in disulphide bonding can have sufficient effect on thehydrophobic foot to change retention. Native insulin-like growth factor (IGF) hasdisulphide bonds between Cys52 <strong>and</strong> Cys47 <strong>and</strong> between Cys48 <strong>and</strong> Cys6 (Figure43A RED). After being subjected to 36 hours of air oxidation, the disulphide bondsswitched to between Cys52 <strong>and</strong> Cys48 <strong>and</strong> between Cys47 <strong>and</strong> Cys6 (Figure 43ABLUE) in some of the IGF protein molecules. Insulin-like growth factor with theswitched disulphide bonds elutes later than the native protein (Figure 43), indicatingan increase in the size of the hydrophobic foot. Reversed-phase chromatography of anative protein will often reveal changes in disulphide bonding or tertiary structure bya change in reversed-phase retention.Page 38www.ace-hplc.com
Disulphide Bond DeterminationIf the disulphide bonds are not reduced during the protease digestion of a protein (byomitting the DTT <strong>and</strong> carboxymethylation steps), then the peptide map will containdisulphide linked dipeptides. Comparing a non-reduced map with a normal peptidemap with reduced disulphide bonds, allows determination of the location of thedisulphide bonds. Interl<strong>eu</strong>kin II was digested under both reducing <strong>and</strong> non-reducingconditions <strong>and</strong> the peptide maps of both digestions were run by RP-HPLC (Figure44). In Figure 44A the peptide labelled T7+T10 is a disulphide linked dipeptide. Thepeptide map produced with disulphide reduction (Figure 44B) reveals two peptideswhich appear as T7 <strong>and</strong> T10. This confirms that the disulphide bond is between thesetwo peptides. Monitoring all of the peptides in the protein digest allows assignment<strong>and</strong>/or confirmation of all of the disulphide bonds in the protein. If two cysteines arepresent in a tryptic peptide, then an alternative protease must be used to determinewhich cysteine is involved in the disulphide bond.Peptide mapping coupled with mass spectrometry is often used to determine thelocation <strong>and</strong> state of disulphide bonds (Reference 35).Figure 44. Comparison of peptide maps of interl<strong>eu</strong>kin II with disulphide bonds intact (A)<strong>and</strong> reduced (B). (Reference 36)ConditionsColumn: C18 wide pore, 4.6 x250 mmMobile phase: Complex gradientfrom 5 to 80% acetonitrile in0.1% TFA over 99 minutesSample:A. Peptide map of interl<strong>eu</strong>kin IIdigested under conditionsleaving the disulphide bondsintact.B. Peptide map of interl<strong>eu</strong>kin IIdigested under conditions whichreduced the disulphide bonds.AB30 35 40 minwww.ace-hplc.comPage 39
Protein/Peptide PurificationReversed-phase HPLC is an effective tool for the purification of proteins <strong>and</strong>peptides. Target proteins/peptides can often be resolved from impurities by reversedphaseHPLC, collected as fractions <strong>and</strong> the fractions used for further studies, foranalysis by orthogonal analytical techniques or even for use as a therap<strong>eu</strong>tic drug.When analyzing proteins/peptides the goal in developing chromatographic conditionsis to optimize RESOLUTION <strong>and</strong> TIME. When separating proteins/peptides withpreparative chromatography, developing chromatographic conditions involvesoptimizing three parameters (see Figure 45): Yield is the amount of purified target protein/peptide that is obtained from eachchromatography step. Higher yields result in more practical purification processes<strong>and</strong> lower costs. Purity indicates the extent to which impurities have been removed from thedesired product. Higher purity results in better data from subsequent analysis or aproduct with few impurities. Throughput is a measure of how much material is purified in a preparative cycle.High throughput means more material for study or analysis or more drugsubstance for pharmac<strong>eu</strong>tical use at a given cost <strong>and</strong> time.Since the goals of preparative purification differ from those of analyticalchromatography, separation conditions are optimized differently.Figure 45. For preparative purifi cationof proteins or peptides the separationconditions are optimized by fi nding themost practical balance of yield, purity<strong>and</strong> throughputYieldThroughputPurityPage 40www.ace-hplc.com
Protein/Peptide PurificationSample loading. In analytical chromatography, small samples are loaded onto thecolumn to ensure that the amount of sample loaded does not affect resolution. If theamount of sample loaded is too high, peaks will become broader <strong>and</strong> resolution willbe reduced. The amount of sample that can be loaded onto the column without b<strong>and</strong>broadening occurring (the “sample capacity”) depends on the size of the column(See Appendix for a list of column dimensions <strong>and</strong> sample capacity). Whenpurifying a protein/peptide preparatively it is common practice to exceed the samplecapacity, that is to “overload” the column, in order to increase yield <strong>and</strong> throughput(Figure 46). As much as 10 - 50 times the sample capacity can be loaded onto acolumn if some loss of resolution is acceptable (Appendix, Maximum PracticalLoad). Although the peaks in Figure 46 are broadened due to column overload, peakshape remains fairly good, indicating that significant overload can increase yieldwhile preserving purity, although some loss of the target protein/peptide isunavoidable.The peaks in Figure 47 are similarly broadened due to sample overload.Fraction collection, analysis <strong>and</strong> pooling. When a column is overloaded, it iscommon to discard the beginning <strong>and</strong> end of the peak. In Figure 46 the centre ofthe peak indicated by the red area is collected. The leading <strong>and</strong> trailing edges arediscarded. This avoids collecting poorly resolved impurities <strong>and</strong> results in increasedpurity <strong>and</strong> decreased yield. In preparative chromatography several fractions arecollected across the peak of interest <strong>and</strong> these are analyzed for impurities. Based onFigure 46. In an example ofpeptide purifi cation,preparative separationinvolves overloading thecolumn with sample in orderto increase yield. Resolutionis reduced <strong>and</strong> thebeginning <strong>and</strong> end of apeak must be discardedin order to optimize purity,even though yield is slightlyreduced.AnalyticalSeparationPreparativeseparation“overloaded”peakswww.ace-hplc.comPage 41
Protein/Peptide Purificationthe analytical results, fractions with little or no impurities are pooled together whilethose fractions near the beginning <strong>and</strong> end of a peak which contain significantimpurities are discarded. Choosing which fractions to pool <strong>and</strong> which to discard is amatter of balancing purity <strong>and</strong> yield.For instance, an “analytical” column of 4.6 x 250 mm dimensions can be used topurify small amounts of polypeptide, up to about 200 micrograms, without loss ofresolution. However, in order to improve yield <strong>and</strong> throughput as much as 10milligrams can be purified on a column of these dimensions with some loss of purityor with some loss of yield. Careful selection of the portion of the peak to collectresults in an optimum balance between purity <strong>and</strong> yield.Although most of the focus in preparative chromatography is on sample mass,sample volumes may also be large in preparative chromatography. Although sampleloops <strong>and</strong> injectors may be used, much higher volumes of sample can be injected by“pumping” the sample onto the column. The inlet line of the pump is placed in thesample container <strong>and</strong> the sample is loaded onto the column by the elution pumpitself. Very large volumes of sample can be loaded in this manner if loaded at loworganic solvent concentration (generally the sample is loaded in an aqueous media)<strong>and</strong> the target protein/peptide is eluted with a gradient of increasing organic solvent.Adsorbent particle size. While five micron particles are most commonly used foranalytical chromatography, preparative chromatography often uses adsorbents withlarger particle sizes. Particularly when loading the column with a sample in excess ofthe sample capacity (overloading the column) column efficiency is of less importancethan in analytical chromatography. Columns packed with large particles separateproteins <strong>and</strong> peptides as well as columns packed with small particles if the columnis overloaded. Consequently adsorbents of 10 micron <strong>and</strong> higher are often used forpreparative chromatography. The distribution of particle sizes is often greater as well.Rather than very narrow particle size ranges of 0.5 micron or less, forpreparative chromatography larger particle size ranges such as 10 - 15 micron arecommon. Larger particles are preferred for preparative chromatography because ofreduced back pressure <strong>and</strong> lower cost.Page 42www.ace-hplc.com
Protein/Peptide PurificationColumn diameter. Small bore columns (less than 2 mm diameter) are rarely usedfor purification purposes because of very low sample capacity (Appendix). Smallscale laboratory purification may be accomplished on narrow bore (~2 mm diameter)<strong>and</strong> analytical (4.6 mm diameter) columns. The chromatography conditions used forsuch small scale preparative separations are typically the same as those used foranalytical separations. Where larger amounts of protein/peptide are needed, columnsof 10 mm <strong>and</strong> 22 mm diameter are used. As much as 1 mg of protein or peptidecan be purified on a 10 mm column <strong>and</strong> 5 mg can be purified on a 22 mm column.Even more protein/peptide can be purified if column overload is acceptable, up to 50mg on a 10 mm column <strong>and</strong> 200 mg on a 22 mm column. For purification of largeramounts of protein or peptide, larger diameter columns of 50 mm, 100 mm or evengreater are used. As much as 5 grams have been reported to be purified on columnsof 50 mm diameter.Column Length. Preparative columns tend to be relatively short compared toanalytical columns. This is because total column volume is more important thanlength in preparative chromatography, particularly for proteins. Columns withdiameters as large as 60 cm <strong>and</strong> lengths of 12-15 cm (“pancake” columns) have beenused for large scale purification of protein therap<strong>eu</strong>tic drugs (Reference 37). Columndimensions are optimized for practicality rather than efficiency because columnsare generally overloaded in preparative chromatography <strong>and</strong> efficiency is much lessimportant than yield, purity <strong>and</strong> throughput.Mobile phase components. As in analytical chromatography, acetonitrilecontaining TFA is commonly used for small scale purification using columns up to10 or 22 mm diameter. Larger scale purification often employs solvents such asethanol in place of the acetonitrile <strong>and</strong> acetic acid in place of the TFA. Whileresolution is reduced using these mobile phases, they are more practical for largescale use <strong>and</strong> the loss in resolution is parallel with the loss of resolution inherent inoverloading of columns.References 38, 39 <strong>and</strong> 40 describe general conditions <strong>and</strong> sample loading forpreparative chromatography of proteins <strong>and</strong> peptides.www.ace-hplc.comPage 43
Protein/Peptide PurificationProtein denaturation. It is commonly thought that reversed-phase chromatographydenatures proteins <strong>and</strong> thus the eluting protein does not represent the native protein<strong>and</strong> may not be biologically active. Although reversed-phase HPLC does occur underconditions that can denature proteins, native, biologically active proteins can beobtained after reversed-phase chromatography. The organic solvent may weakenhydrophobic forces, causing some loss of the tertiary structure of the protein. Thehydrophobic surface of the adsorbent also tends to cause some unfolding of aprotein. Protein unfolding, however, is usually slow compared with chromatographictimes <strong>and</strong> proteins may only be slightly denatured during reversed-phasechromatography. Since disulphide bonds continue to hold the protein in a globularform <strong>and</strong> unfolding is only partial, a protein eluting from a reversed-phase columncan often be restored to its native form by incubating the eluted protein in anappropriate refolding buffer <strong>and</strong> allowing the native structure to reform. There aremany examples which show that reversed-phase HPLC is capable of producingpurified protein with native tertiary structure <strong>and</strong> biological activity. Reference 41describes the reversed-phase purification of trypsin, which retains activity <strong>and</strong> issubsequently used for tryptic digestions of proteins. Recombinant erythropoetin, acommercially successful protein therap<strong>eu</strong>tic, employs reversed-phase HPLC as partof the isolation of the protein drug from its cell culture expression system (Reference42). Granulocyte stimulating factor, another commercial protein therap<strong>eu</strong>tic, ispurified using reversed-phase HPLC (References 43, 44). Recombinant humaninsulin has also been purified in active form using reversed-phase HPLC (Reference45).Purification example. Figure 47 shows an example of the purification of asynthetic peptide, gonadotropin releasing hormone (GnRH) antagonist. Thispurification procedure was developed by:❏ Establishing elution conditions on an analytical (4.6 x 250 mm) column.❏ Loading 1.2 grams of a synthetic peptide mixture on a 50 x 300 mm column <strong>and</strong>eluting based on the conditions established in the first step (Figure 47)❏ Fractions collected across the GnRH antagonist peak were collected <strong>and</strong> analyzedby the analytical method <strong>and</strong> pooled for maximum yield <strong>and</strong> purity.Page 44www.ace-hplc.com
Protein/Peptide Purification❏ Fractions were desalted by re-chromatography on a reversed-phase column usingacetonitrile <strong>and</strong> trifluoroacetic acid as the eluting solvent.❏ Final fractions were pooled for maximum yield <strong>and</strong> purityFrom this single chromatographic purification step, 128 mg of purified peptide werecollected from a reaction mixture of 1.2 gm. The purification used the same organicsolvent used in analytical separations, acetonitrile, but used triethylammoniumphosphate in place of trifluoroacetic acid. The peaks are broadened due to the columnoverload <strong>and</strong> the chromatogram is not as well resolved as analytical chromatograms.However the peaks remain fairly compact <strong>and</strong> the eluent containing the targetpeptide, GnRH, is easily collected.Figure 47. Purifi cation of 128 mg of a synthetic peptide, gonadotropinreleasing hormone. Note that the column is signifi cantly overloaded, causingthe peaks to be very broad.GnRH0 20 40 60 minConditionsColumn: C18 wide pore, 15 - 20 micron particle diameter, 50 x 300 mm.Mobile phase: Gradient of acetonitrile <strong>and</strong> water containing triethylammonium phosphate.Sample:Gonadotropin releasing hormone(Reference 37)www.ace-hplc.comPage 45
ProteomicsProteomics is the identification <strong>and</strong> quantitation ofcellular proteins in order to underst<strong>and</strong> biologicalchanges, disease states <strong>and</strong> to develop biomarkersfor diseases <strong>and</strong> targets for therap<strong>eu</strong>tic drugs.Mammalian cells contain as many as 30,000 -40,000 proteins if one counts modified versions ofone basic protein as one protein. If the variouslymodified proteins are each counted individually, thenumber of proteins is well over 100,000. The abundance or concentration of differentproteins in a cell can vary by several orders of magnitude. Any change to a cellularsystem, such as ageing, becoming diseased or being treated with a therap<strong>eu</strong>tic drug,will cause a change in the relative abundance or expression of one or more of theseproteins. Proteomics seeks to identify each protein in a cellular system <strong>and</strong> toidentify <strong>and</strong> monitor changes to the protein such as modifications to the protein itself(post-translational modifications) or changes in its relative concentration. If a certainevent causes a protein abundance to increase we say that the protein is up-regulatedby the event. If an event causes the protein abundance to decrease we say that theprotein has been down-regulated. Protein abundances may be changed significantlywhen affected by cellular changes <strong>and</strong> changes in protein abundance are signals ofthe changing event.Post-translation modifications (PTMs) are changes to a protein after it has beensynthesized by the cell. PTMs include the addition of oligosaccharide chains(glycosylation), modification of the N-terminus of a protein with an alkyl group suchas acetate (acetylation, etc), attachment of a phosphate group to a serine, threonine ortyrosine (phosphorylation) <strong>and</strong> similar events. PTMs such as phosphorylation arelargely temporary <strong>and</strong> are used by the cell to transmit messages within the cell <strong>and</strong>through the cell walls. PTMs such as glycosylation are structural <strong>and</strong> often affectprotein folding, interactions with other molecules <strong>and</strong> interaction with cell walls. Allof these represent the dynamics which occur within a living cell.Page 46www.ace-hplc.com
ProteomicsA proteome represents all of the proteins present in a cell or in any sample beingstudied. A complete cellular proteome can consist of as many as 40,000 individualproteins with up to 10 - 20 different modified forms <strong>and</strong> varying in abundance byseveral orders of magnitude.The goals of proteomics are clearly enormous, requiringthe most powerful of separation <strong>and</strong> analysis techniques.Electrophoresis. In orderto identify <strong>and</strong>/or quantitateproteins, individual proteinsmust be separated from otherproteins as much as possible.For a great many years theprimary means of separatingintact proteins was by gelelectrophoresis. Twodimensional gelelectrophoresis (2DGE)separates proteins first bytheir isoelectric point <strong>and</strong>then by size (see Figure 48).2DGE of entire cellproteomes is extremelycomplex <strong>and</strong>, whileFigure 48. Two-dimensional gel electrophoresis is ableto separate as many as 2000 - 3000 individual proteinsEach spot represents one or more proteins.Separation in thevertical directionis by size (SDS-PAGE). Smallerproteins move tothe bottom of thegel while largerproteins remainnear the top)Separation in the horizontal direction isby isoelectric point, related to charge.separating as many as 2000 - 3000 proteins, many proteins are either not separatedfrom each other or are not visible on the gel because of low abundance. 2DGEremains a powerful tool for protein separation. It is a well developed technique withmany experienced users, is capable of high resolution <strong>and</strong> can provide quantitationof many proteins. Its limitations are that it requires a lot of manual effort <strong>and</strong> is timeconsuming, it primarily measures more abundant proteins <strong>and</strong> has difficultymeasuring some important proteins such as membrane bound proteins.www.ace-hplc.comPage 47
ProteomicsChromatography. Chromatographic techniques have developed into powerfulseparation techniques, capable of separating large numbers of proteins <strong>and</strong>peptides. Any given chromatography technique by itself, however, will still be able toseparate only a small fraction of cellular proteins. As a result, combiningchromatography techniques has become a widespread method for protein separationsfor proteomic analysis.Two dimensional chromatography. Following a pattern long used in proteinpurification, John Yates <strong>and</strong>colleagues (Reference 20) Figure 49. Multidimensional Protein Identifi cationTechnology (MudPIT) consists of an initial fractionationdeveloped a technique for of a protease digestion of an entire proteome by ionproteomic analysis called exchange chromatography followed by a lengthyreversed-phase separation of the peptides from eachMultidimensional Proteinfraction of the ion exchange separation. NarrowIdentification Technique capillaries are packed with ion exchange beads <strong>and</strong>(MudPIT). In this techniquethe proteins in a proteome arereversed-phase beads <strong>and</strong> the eluent from thechromatography is directed into an electrospray massspectrometer.first digested into relativelysmall peptides using proteaseenzymes including trypsin.These peptides are thenIon Exchange Reversed-phasefractionated by ion-exchange chromatography by increasing the salt concentrationin steps. In each step, the salt concentration is raised slightly <strong>and</strong> the least stronglybound peptides are eluted onto reversed-phase beads. An acetonitrile gradient is run,eluting the peptides by hydrophobicity (Reference 20). In the MudPIT approach theion-exchange <strong>and</strong> reversed-phase beads are packed into a narrow capillary insequence <strong>and</strong> the eluent from the reversed-phase section is directed into anelectrospray mass spectrometer (Figure 49). This is repeated multiple times producingvery significant separation of the peptides from the proteomic digest (Figure 50).The advantage of two-dimensional chromatography of peptides from digestedproteomes is that breaking proteins into peptides allows separation <strong>and</strong> identificationof proteins that are missed by gel electrophoresis, such as hydrophobic, membraneboundproteins <strong>and</strong> low abundance proteins. The disadvantage is that information onPage 48www.ace-hplc.com
ProteomicsFigure 50. In Multidimensional Protein Identifi cation Technology (MudPIT) each stepincrease in the salt concentration elutes peptides onto the reversed-phase portion of thecolumn <strong>and</strong> an acetonitrile gradient is run, separating the peptides by hydrophobicity.(Reference 20)IX Step 1 IX Step 4 IX Step 7IX Step 10 IX Step 13 IX Step 16PTMs is usually lost in the MudPIT approach. Also, many more peptides are formedthan there are proteins, on average 20 - 50 peptides per protein, which must beseparated.More recent advances have used affinity chromatography, immobilized metal affinity<strong>and</strong> lecithin affinity chromatography to further isolate sub-fractions of peptides eitherprior to ion-exchange separation or at later stages.Protein identification. <strong>Proteins</strong> separated by gel electrophoresis are generallydigested with proteases (trypsin in most cases) <strong>and</strong> the resulting peptides areanalyzed by MALDI mass spectrometry <strong>and</strong> identified by reference to proteindatabases.<strong>Peptides</strong> separated by MudPIT <strong>and</strong> related approaches are directed to an electrospraymass spectrometer <strong>and</strong> the peptides identified by MS <strong>and</strong> MS/MS with the use ofprotein databases. When a few peptides from a given protein are identified, theprotein itself can be identified.www.ace-hplc.comPage 49
ReferencesIntroduction1 Reversed-Phase High Performance Liquid Chromatography of Insulins from DifferentSpecies, J. Rivier <strong>and</strong> R. McClintock, J. Chrom. 268, 112-119 (1983)2 Peptide Mapping of Subtilisins as a Practical Tool for Locating Protein Sequence Errorsduring Extensive Protein Engineering Projects, T. Christianson <strong>and</strong> C. Paech,Anal. Biochem. 223, 119-129 (1994)3 Retention Model for <strong>Proteins</strong> in Reversed-Phase Liquid Chromatography, X. Geng <strong>and</strong>F.E. Regnier, J. Chrom. 296, 15-30 (1984)Columns4 The Importance of Silica Type for Reverse-Phase Protein Separations, J.D. Pearson, N.T.Lin <strong>and</strong> F.E. Regnier, Anal. Biochem. 124, 217-230 (1982)5 Analysis of peptide mixtures by capillary high performance liquid chromatography:A practical guide to small-scale separations, M.T. Davis <strong>and</strong> T.D. Lee, Protein Science 1,935-944 (1992)6 Microscale Structure Analysis of a High Molecular Weight Hydrophobic MembraneGlycoprotein Fraction with Platelet-Derived Growth Factor-Dependent Kinase Activity,P. Tempst, D. Woo, D.B. Teplow, R. Aebersold, L.E. Hood <strong>and</strong> S.B.H. Kent, J. Chrom. 359,403-412 (1986).Analytical Conditions7 Purification of Integral Plasma Membrane <strong>Proteins</strong> by Reverse-Phase HighPerformance Liquid Chromatography, M.R. Sussman, Anal. Biochem. 169, 395-399(1988)8 Subunit Analysis of Bovine Cytochrome c Oxidase by Reverse-Phase High PerformanceLiquid Chromatography, N. C. Robinson, M.D. Dale <strong>and</strong> L.H. Talbert, Arch. of Biochem.<strong>and</strong> Biophys. 281(2), 239-244 (1990)9 Separation <strong>and</strong> Purification of S49 Mouse Lymphoma Histones by Reversed-Phase HighPerformance Liquid Chromatography, M.C. McCroskey, V.E. Groppi <strong>and</strong> J.D. Pearson,Anal. Biochem. 169, 427-432 (1987)10 Computer simulation as a tool for the rapid optimization of the high-performanceliquid chromatographic separation of a tryptic digest of human growth hormone,R.C. Chloupek, W.S. Hancock <strong>and</strong> L.R. Snyder, J. Chrom. 594, 65 - 73 (1992)11 Increasing the Sensitivity of UV Detection in Protein <strong>and</strong> Peptide Separations whenusing TFA-Acetonitrile Gradients, G. Winkler, LC/GC 5(12), 1044-1045 (1987)Page 50www.ace-hplc.com
References12 Temperature selectivity effects in reversed-phase liquid chromatography dueto conformation differences between helical <strong>and</strong> non-helical peptides, Y. Chen,C. T. Mant <strong>and</strong> R. S. Hodges, J. Chrom 1010, 45-61 (2003)13 Temperature as a variable in reversed-phase high-performance liquidchromatographic separations of peptide <strong>and</strong> protein samples. I. Optimizing theseparation of a growth hormone tryptic digest, W.S. Hancock, R.C. Chloupek,J.J. Kirkl<strong>and</strong> <strong>and</strong> L.R. Snyder, J. Chrom. 686, 31-43 (1994)14 Development of an Analytical reversed-phase high-performance liquidchromatography - electrospray ionization mass spectrometry method forcharacterization of recombinant antibodies, T.M. Dillon, P.V. Bondarenko <strong>and</strong>M.S. Ricci, J. Chrom.A 1053, 299 - 305 (2004)HPLC - Mass Spectrometry15 Evaluation of Genetic Stability of Recombinant Human Factor VIII by PeptideMapping <strong>and</strong> On-line Mass Spectrometric Analysis, M.J. Besman <strong>and</strong> D. Shiba,Pharm. Research 14(8), 1092 - 1098 (1997)16 Application of capillary electrophoresis, high-performance liquidchromatography, on-line electrospray mass spectrometry <strong>and</strong> matrix-assistedlaser desorption ionization-time of flight mass spectrometry to thecharacterization of single-chain plasminogen activator, A. Apffel, J. Chakel, S.Udiavar, W. Hancock, C. Souders, E. Pungor, Jr., J. Chrom. A. 717, 41 - 60 (1995)17 Enhanced sensitivity for peptide mapping with electrospray liquidchromatography-mass spectrometry in the presence of signal suppression dueto trifluoroacetic acid-containing mobile phases , A. Apffel, S. Fischer, G.Goldberg, P.C. Goodley <strong>and</strong> F. Kuhlmann, J. Chrom. A. 712, 177 - 190 (1995)18 Overview of Protein <strong>and</strong> Peptide Analysis by Mass Spectrometry, Section16.1.14 in Current Protocols in Protein Science, published by John Wiley & Sons19 High-flow ion spray liquid chromatography/mass spectrometry, G. Hopfgartner,T. Wachs, K. Bean, <strong>and</strong> J. Henion., Anal. Chem. 65, 439 - 446 (1993).20 Direct Analysis of Protein Complexes Using Mass Spectrometry, A. Link, J. Eng,D. Schieltz, E. Carmack, G. Mize, B. Garvik, <strong>and</strong> J. Yates III., Nature Biotech. 17,676-682 (1999)www.ace-hplc.comPage 51
ReferencesApplications21 Sample Preparation for Peptide Mapping - A Pharmac<strong>eu</strong>tical Quality ControlPerspective, N. Lundell <strong>and</strong> T. Schreitmuller , Anal. Biochem. 266, 31- 47 (1999)22 Rapid analytical tryptic mapping of a recombinant chimeric monoclonal antibody <strong>and</strong>method validation challenges, K. Kannan, M.G. Mulkerrin, M. Zhang, R. Gray, T.Steinharter, K. Sewerin, R. Baffi, R. Harris <strong>and</strong> C. Karunatililake, J. Pharm. <strong>and</strong> Biomed.Analysis 16, 631 - 640 (1997)23 Stability of <strong>Peptides</strong> <strong>and</strong> <strong>Proteins</strong>, C. Schoneich, M.J. Hageman <strong>and</strong> R.T. Borchardt, inControlled Drug Delivery, 205 - 228 (1997), publisher American Chemical Society24 The Role of Quality Control in Biotechnology: An Analytical Perspective, R.L. Garnick,N.J. Solli <strong>and</strong> P.A. Papa, Anal. Chem. 60, 2546-2557 (1988)25 Chemical Instability of <strong>Proteins</strong>, S. Li, C. Schoneich <strong>and</strong> R. Borchardt, Pharmac<strong>eu</strong>ticalNews 2(5), 12 - 16 (1995)26 Deamidation of asparagine <strong>and</strong> glutamine residues in proteins <strong>and</strong> peptides: structuraldeterminants <strong>and</strong> analytical methodology, R. Bischoff <strong>and</strong> H.V.J. Kolbe, J. Chrom. B.662, 261 - 278 (1994)27 A Reversed-Phase High-Performance Liquid Chromatographic Method forCharacterization of Biosynthetic Human Growth Hormone, R.M. Riggin, G.K. Dorulla<strong>and</strong> D.J. Miner, Anal. Biochem. 167, 199 - 209 (1987)28 Selective Deamidation of Ribonuclease A, A. D. Donato, M.A. Ciardiello, M. de Nigris,R. Piccoli, L Mazzarella <strong>and</strong> G. D’Alessio., J. Biological Chem. 268, 4745 - 4751 (1993)29 Formation of Isoaspartate at Two Distinct Sites during in Vitro Aging of HumanGrowth Hormone, B.A. Johnson, J.M. Shirokawa, W.S. Hancock, M.W. Spellman, L.J.Basa <strong>and</strong> D.W. Aswad, J. Biological Chem.. 264, 14262 - 14271 (1989)30 Chemical Instability of Protein Pharmac<strong>eu</strong>ticals: Mechanisms of Oxidation <strong>and</strong>Strategies for Stabilization, S. Li, C. Schoneich <strong>and</strong> R. Borchardt, Biotechnology <strong>and</strong>Bioengineering 48, 490 - 509 (1995)31 Characterization of Methionine Sulfoxide Derivatives of Recombinant CoagulationFactor VIIa, T. Kornfelt <strong>and</strong> L. Palm, WCBP II Conference (1998), Poster P-1104T32 Separation of Oxidized Human Growth Hormone Variants by Reversed-Phase HighPerformance Liquid Chromatography, G. Teshima <strong>and</strong> E. Canova-Davis, J. Chrom. 625,207 - 215 (1992)33 Model of Protein Conformation in the Reversed-Phase Separation of Interl<strong>eu</strong>kin-2Muteins, M. Kunitani <strong>and</strong> D. Johnson, J. Chrom. 371, 313-333 (1986)34 Oxidative Refolding of Insulin-like Growth Factor 1 Yields Two Products of SimilarThermodynamic Stability: A Bifurcating Protein-Folding Pathway, J. Miller, et.al.,Biochem. 32, 5203-5213 (1993)Page 52www.ace-hplc.com
References35 Strategies for Locating Disulfide Bonds in a Monoclonal Antibody via MassSpectrometry, R. Mhatre, J. Woodard <strong>and</strong> C. Zeng., Rapid Comm. in Mass Spec. 13, 2503-2510 (1999)36 Reversed-Phase Chromatography of Interl<strong>eu</strong>kin-2 Muteins, M. Kunitani, P.A. Hirtzer,D. Johnson, R. Halenback, A. Boosman <strong>and</strong> K. Koths, J. Chrom. 359, 391 - 402 (1986)Protein/Peptide Purification37 Reversed-Phase High Performance Liquid Chromatography: Preparative Purification ofSynthetic <strong>Peptides</strong>, J. Rivier, R. McClintock, R. Galyean, <strong>and</strong> H. Anderson, J. Chrom. 288,303-328 (1984)38 Practical Aspects of Preparative Reversed-Phase Chromatography of Synthetic <strong>Peptides</strong>,C.A. Hoeger, R. Galyean, R.A. McClintock <strong>and</strong> J.E. Rivier, in HPLC of <strong>Peptides</strong> <strong>and</strong><strong>Proteins</strong>: Separation, Analysis <strong>and</strong> Conformation, Pages 753-764.39 Process Purification of Polypeptides <strong>and</strong> <strong>Proteins</strong> by Reversed-Phase ColumnChromatography: Misconceptions <strong>and</strong> Reality, P. Lu, C.D. Carr, P. Chadwick, M. Li <strong>and</strong>K. Harrison., BioPharm 14 (9), 28 - 35 (2001)40 Factors affecting the separation <strong>and</strong> loading capacity of proteins in preparative gradientelution high-performance liquid chromatography, Y-B. Yang, K. Harrison, D. Carr <strong>and</strong> G.Guiochon, J. Chrom. 590, 35-47 (1992)41 A Simple <strong>and</strong> Rapid Purification of Commercial Trypsin <strong>and</strong> Chymotrypsin byReversed-Phase High-Performance Liquid Chromatography, K. Titani, T. Sasagawa,K. Resing <strong>and</strong> K.A. Walsh, Anal. Biochem. 123, 408-412 (1982)42 Erythropoetin purification, Por-Hsiung <strong>and</strong> T. Strickl<strong>and</strong>, U.S. Patent No. 0466701643 Expression, Purification <strong>and</strong> Characterization of Recombinant Murine Granulocyte-Macrophage Colony-Stimulating Factor <strong>and</strong> Bovine Interl<strong>eu</strong>kin-2 From Yeast, V. Price,D. Mochizuki, C.J. March, D. Cosman, M.C. Deeley, R. Klinke, W. Clevenger, S. Gillis, P.Baker <strong>and</strong> D. Urdal, Gene 55, 287-293 (1987)44 Production of Recombinant Human Colony Stimulating Factors in Yeast, S. Gillis,D. Urdal, W. Clevenger, R. Klinke, H. Sassenfeld, V. Price <strong>and</strong> D. Cosman, Behring InstituteResearch Communications 83, 1-7 (1988)45 Production Scale Purification of Biosynthetic Human Insulin By Reversed-PhaseHigh-Performance Liquid Chromatography, E.P. Kroeff, R.A. Owens, E.L. Campbell,R.D. Johnson <strong>and</strong> H.I. Marks, J. Chrom. 461, 45-61 (1989)www.ace-hplc.comPage 53
Appendix: Column CharacteristicsColumnDiameter(mm)TypicalFlow Rate(ml/min)SampleCapacity(g)MaximumPracticalLoadCapillary0.0750.150.300.500.000250.0010.0050.010.10.212----Microbore1.00.0510-Narrow Bore2.10.250-Analytical4.61.020010 mgSemi-Preparative105.01 mg50 mgPreparative21.210-305 mg200 mgFlow Rates can be varied by a factor of 2 without loss of resolutionSample Capacity is the amount of polypeptide that can bechromatographed without loss of resolutionMaximum Practical Sample Load is the maximum amount ofpolypeptide that can be purifi ed with reasonable yield <strong>and</strong> purityPage 54www.ace-hplc.com
Appendix: Amino Acid CharacteristicsAmino acids are amphoteric, meaning that they contain both an acidic group(carboxylic acid) <strong>and</strong> a basic group (primary amine). These, however, are condensedwith leading <strong>and</strong> following residuesin a peptide bond. A series of aminoacids connected via peptide bondsform a polypeptide backbone. Thecharacteristics of a protein/peptideare determined by the side chainsattached to the amino acid core.These are described <strong>and</strong> theirfunctions outlined in this appendix.The name, three letter abbreviation<strong>and</strong> single letter code are included.WhiterepresentsHydrogenBlue representsNitrogenRed representsOxygenGreyrepresentsCarbonSide chain ofamino acidresidueAmino AcidAlanineAlaACharacteristicsType: HydrophobicFunction: The side chain consists of amethyl group, which is hydrophobic.As with other hydrophobic amino acids,alanine assists with forming <strong>and</strong>maintaining tertiary structure.StructureArginineArgRType: BasicFunction: The side chain has threenitrogens closely grouped, making Arg themost basic amino acid with a pK of ~12.5.Arginine forms electrostatic complexes withaspartic or glutamic acid (salt bridges),strengthening tertiary structure.It also interacts with acidic groupsbeing bound to a protein, suchas the phosphate groups of nucleic acids.www.ace-hplc.comPage 55
Appendix: Amino Acid CharacteristicsAmino AcidAsparagineAsnNAspartic AcidAspDCysteineCysCCharacteristicsType: Slightly polarFunction: Asparagine isdistinguished as being the primarylocation for deamidation <strong>and</strong> forbeing the point of attachment ofglycans (oligosaccharides).Type: AcidicFunction: Aspartic acid has a pK of~4 <strong>and</strong> interacts with basicamino acids forming electrostaticcomplexes (salt bridges). Asp isalso the binding site for positivelycharged groups such as metal ions,required by many proteins to befunctional.Type: Slightly polar(sulphur-containing)Function: Cysteine plays a majorrole in protein tertiary structure byreacting with other cysteine sidechains <strong>and</strong> forming a covalentlinkage (disulphide bond) betweendifferent parts of a polypeptidechain.StructureGlutamineGlnQPage 56Type: Slightly polarFunction: Glutamine does notdeamidate as easily as asparagine<strong>and</strong> therefore is rarely a site ofdeamidation.www.ace-hplc.com
Appendix: Amino Acid CharacteristicsAmino AcidGlutamic AcidGluECharacteristicsType: AcidicFunction: Glutamic acid has apK slightly greater than 4 <strong>and</strong>interacts with basic amino acidsforming electrostatic complexes(salt bridges). Glu is also thebinding site for positively chargedgroups such as metal ionsrequired by many proteins to befunctional.StructureGlycineGlyGType: N<strong>eu</strong>tralFunction: Glycine is very smallwith a side chain of only ahydrogen. It is a n<strong>eu</strong>tral extenderwithin the backbone.HistidineHisHType: BasicFunction: The side chain isslightly basic with a pK of 6-7.Histidine can bind acids butbinding depends on theenvironmental pH.Isol<strong>eu</strong>cineIleIType: HydrophobicFunction: As with otherhydrophobic amino acids,isol<strong>eu</strong>cine residues assist withforming <strong>and</strong> maintaining tertiarystructure.www.ace-hplc.comPage 57
Appendix: Amino Acid CharacteristicsAmino AcidL<strong>eu</strong>cineL<strong>eu</strong>LLysineLysKMethionineMetMCharacteristicsType: HydrophobicFunction: As with other hydrophobicamino acids, l<strong>eu</strong>cine assists withforming <strong>and</strong> maintaining tertiarystructure.Type: BasicFunction: The side chain is a primaryamine <strong>and</strong> has a pK of ~10.5. Lysineforms electrostatic complexes withaspartic or glutamic acid (salt bridges),strengthening tertiary structure.It also interacts with acidic groupsbeing bound to a protein, suchas the phosphate groups ofnucleic acids.Type: Slightly hydrophobic(sulphur-containing)Function: Methionine is the mostlikely amino acid to be oxidized. It actsas an indicator of oxidation.Methionine oxidation may also affectbiological activity.StructurePhenylalaninePheFPage 58Type: Hydrophobic <strong>and</strong> aromatic.Function: As with other hydrophobicamino acids, phenylalanine assistswith forming <strong>and</strong> maintaining tertiarystructure. Being aromatic, it is alsoa useful detection target by UV lightabsorption.www.ace-hplc.com
Appendix: Amino Acid CharacteristicsAmino AcidCharacteristicsStructureProlineProPType: Slightly hydrophobicFunction: Proline is unique in that itshydrophobic side chain is connected to theamino terminus. This creates a strain in thepolypeptide backbone, tending to bend thebackbone. This is a structural characteristicassisting in the formation of tertiary structure.SerineSerSType: Polar (hydroxy)Function: Serine is able to hydrogen bondwith other residues or parts of the protein. Italso can hydrogen bond with other proteinsor bound groups. Serine is also a site ofphosphorylation on cellular proteins.ThreonineThrTTyrosineTyrYType: Polar (hydroxy)Function: Threonine is able to hydrogenbond with other residues or parts of theprotein. It also can hydrogen bond with otherproteins or bound groups. Threonine is alsoa site of phosphorylation on cellular proteins.Type: Polar (hydroxy) <strong>and</strong> aromaticFunction: Tyrosine is able to hydrogen bondwith other residues or parts of the protein. Italso can hydrogen bond with other proteinsor bound groups. Tyrosine is also a site ofphosphorylation on cellular proteins.Tyrosine is aromatic <strong>and</strong> provides aUV absorption site.www.ace-hplc.comPage 59
Appendix: Amino Acid CharacteristicsAmino AcidTryptophanTrpWCharacteristicsType: Hydrophobic <strong>and</strong> aromaticFunction: Tryptophan has a multi-ringsystem <strong>and</strong> can hydrogen bond toa small extent. It is aromatic <strong>and</strong>provides a site of UV light absorption.Tryptophan also has a slight naturalfl uorescence.StructureValineValVType: HydrophobicFunction: The side chain of valine is ahydrophobic isopropyl group. As with otherhydrophobic amino acids, valine assists informing <strong>and</strong> maintaining tertiary structure.Abundance of individual amino acids. Hydrophobic amino acids are critical informing tertiary structure <strong>and</strong> are often found at the core of a protein. They representapproximately 50% of the amino acids in a protein. Polar amino acids have manyimportant structural <strong>and</strong> functional purposes. They are quite abundant. The leastabundant amino acids are methionine, histidine, cysteine <strong>and</strong> tryptophan.Percentage Abundance108642grey = hydrophobicred = acidicgreen = hydroxyblue = basicblack = aromaticwhite = amideyellow = sulphur0Page 60L<strong>eu</strong> Ala Ser Gly Val Glu Lys Ile Thr Asp Arg Pro Asn Phe Gln Tyr Met His Cys TrpAmino Acidwww.ace-hplc.com
About the author. David Carr is a graduate of the University of California,Berkeley <strong>and</strong> carried out graduate work at the University of California, San Diego.He began working in high-performance liquid chromatography in 1971, early in thedevelopment of that field. For many years he was the Technical <strong>and</strong> MarketingDirector of Vydac, a company well known for the manufacture of columns for thereversed-phase HPLC separation of proteins <strong>and</strong> peptides. During this time heconsulted with early biotechnology companies such as Genentech, Amgen <strong>and</strong>Immunex in the development of analytical methods for protein analysis <strong>and</strong>characterization. He also assisted in developing preparative purification methods forprotein therap<strong>eu</strong>tic drugs. He currently is a principal in the training company,Bioanalytical Technologies, which specializes in training courses for thebiotechnology <strong>and</strong> pharmac<strong>eu</strong>tical fields. He teaches a one day class on“Fundamentals of Protein Chemistry” <strong>and</strong> a popular three day course on“The Analysis <strong>and</strong> Characterization of Protein Therap<strong>eu</strong>tic Drugs”. Furtherinformation on these <strong>and</strong> other courses taught by David may be found on theBioanalytical Technologies website: www.bioanalyticaltech.com. David may becontacted by e-mail at carr@bioanalyticaltech.com.
A <strong>Guide</strong> to the Analysis <strong>and</strong> Purification of <strong>Proteins</strong><strong>and</strong> <strong>Peptides</strong> by Reversed-Phase HPLCwww.ace-hplc.comACE ® products are available throughour international network of distributorsHPLC ColumnsAdvanced Chromatography Technologies, 1 Berry Street, Aberdeen, Scotl<strong>and</strong>. AB25 1HFTel: +44 (0) 1224 704554 Fax: +44 (0) 1224 841301 info@ace-hplc.com www.ace-hplc.com