

2006 The top 800 UK & 1250 Global companies by R&D investment
2006 The top 800 UK & 1250 Global companies by R&D investment
2006 The top 800 UK & 1250 Global companies by R&D investment
- No tags were found...

You also want an ePaper? Increase the reach of your titles
YUMPU automatically turns print PDFs into web optimized ePapers that Google loves.
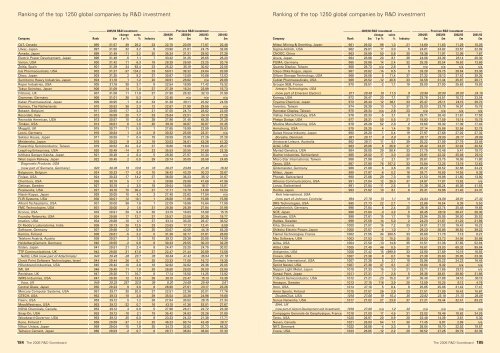
Ranking of the <strong>top</strong> <strong>1250</strong> global <strong>companies</strong> <strong>by</strong> R&D <strong>investment</strong>Ranking of the <strong>top</strong> <strong>1250</strong> global <strong>companies</strong> <strong>by</strong> R&D <strong>investment</strong>—–––––—— 2005/06 R&D <strong>investment</strong> —–––––—— ——––––––—– Previous R&D <strong>investment</strong> ——––––––—–change sales 2004/05 2003/04 2002/03 2001/02Company Rank £m 1 yr % % Industry £m £m £m £mQLT, Canada 895 31.57 39 26.2 33 22.75 20.09 17.87 20.48Ulvac, Japan 897 31.50 32 3.2 8 23.90 21.61 24.75 32.06Amada, Japan 898 31.49 -11 3.2 20 35.34 31.31 29.92 27.28Electric Power Development, Japan 898 31.49 -5 1.1 7 33.32 31.25 28.65 26.20Varian, USA 900 31.42 11 6.3 18 28.39 26.59 23.25 20.76Zeltia, Spain 901 31.39 24 63.4 33 25.22 35.19 30.62 22.06Isis Pharmaceuticals, USA 902 31.37 -37 134.2 33 50.01 39.32 24.64 20.99Disco, Japan 903 31.35 2 9.2 37 30.87 13.09 10.66 12.03Sumitomo Heavy Industries, Japan 904 31.18 1 1.2 20 30.91 28.62 n/a 29.88Roper Industries, USA 905 31.16 38 3.7 8 22.54 18.99 17.42 15.32Tokyo Seimitsu, Japan 906 31.09 14 7.4 37 27.29 16.24 23.99 15.73Filtronic, <strong>UK</strong> 907 31.08 11 11.8 37 27.90 28.32 32.13 31.98Grammer, Germany 908 31.01 38 5.3 2 22.45 n/a n/a n/aKaken Pharmaceutical, Japan 909 30.95 -1 8.4 33 31.39 28.11 25.92 24.56Numico, <strong>The</strong> Netherlands 910 30.92 36 2.3 12 22.67 21.99 29.55 n/aBekaert, Belgium 911 30.90 -17 2.3 21 37.05 24.74 28.62 23.08Recordati, Italy 912 30.89 20 7.7 33 25.64 22.51 24.13 21.26Reynolds American, USA 913 30.87 10 0.6 38 27.96 31.45 48.35 37.28Timken, USA 914 30.81 6 1.0 20 29.18 30.87 30.87 31.45Meggitt, <strong>UK</strong> 915 30.77 11 5.0 1 27.65 19.99 22.99 25.63Leoni, Germany 916 30.64 1 2.9 8 30.32 25.06 22.31 n/aSekisui House, Japan 917 30.55 7 0.4 19 28.59 25.95 27.26 37.28Meidensha, Japan 918 30.53 -9 3.3 16 33.53 34.61 43.26 41.32Powerchip Semiconductor, Taiwan 919 30.52 64 3.2 37 18.60 19.66 19.04 28.27Leapfrog Enterprises, USA 920 30.49 -14 8.1 23 35.53 33.55 31.69 22.35Ishihara Sangyo Kaisha, Japan 921 30.48 4 6.4 5 29.30 27.97 31.34 n/aWest Japan Railway, Japan 922 30.45 2 0.5 39 29.74 30.05 26.58 24.65Diagnostic Products, USA(now part of Siemens, Germany) 923 30.35 15 10.8 18 26.37 23.69 21.45 18.32Belgacom, Belgium 924 30.23 -17 0.8 10 36.42 43.29 30.23 33.67Finisar, USA 924 30.23 -17 14.2 37 36.58 36.23 35.12 31.67Chemtura, USA 926 30.19 5 1.7 5 28.88 29.98 47.69 47.96Getinge, Sweden 927 30.18 4 3.5 18 29.04 18.88 18.17 15.91Pixelworks, USA 927 30.18 70 30.2 37 17.71 13.79 14.98 10.54Nissin Kogyo, Japan 929 30.05 10 4.3 2 27.40 22.62 17.54 n/aFLIR Systems, USA 930 30.01 12 10.1 1 26.68 17.86 15.66 15.86Alliant Techsystems, USA 931 30.00 36 1.6 1 22.09 16.86 15.64 11.99FMC Technologies, USA 931 30.00 2 1.6 31 29.36 26.39 27.84 31.98Kronos, USA 933 29.91 29 9.9 35 23.15 18.83 16.98 15.15Foundry Networks, USA 934 29.88 17 12.7 37 25.57 23.58 20.35 19.77Imation, USA 934 29.88 -10 4.1 37 33.14 33.20 29.47 36.52Dr Reddy's Laboratories, India 936 29.73 26 12.5 33 23.63 17.13 12.41 6.59Software, Germany 937 29.68 -12 9.9 35 33.67 40.06 44.18 45.28Kemira, Finland 938 29.61 -5 2.2 5 31.26 32.77 31.61 26.80Telekom Austria, Austria 939 29.57 2 1.0 10 29.12 29.38 20.85 14.99HeidelbergCement, Germany 940 29.55 -2 0.6 6 30.23 29.55 30.23 32.29Ibiden, Japan 941 29.51 21 2.4 8 24.47 25.25 24.75 30.02TTP Communications, <strong>UK</strong> 942 29.50 31 47.6 37 22.47 21.44 20.89 13.58NetIQ, USA (now part of Attachmate) 943 29.45 -26 23.7 35 39.64 41.42 35.54 21.18Check Point Software Technologies, Israel 944 29.44 26 8.7 35 23.33 17.08 16.72 19.35Hillenbrand Industries, USA 945 29.42 -10 2.6 18 32.62 32.62 29.36 25.05IMI, <strong>UK</strong> 946 29.40 11 1.9 20 26.60 28.00 28.00 23.80Renishaw, <strong>UK</strong> 947 29.30 71 16.7 8 17.14 15.50 14.25 13.92WMS Industries, USA 947 29.30 12 13.0 39 26.10 23.47 15.13 10.38Voca, <strong>UK</strong> 949 29.25 257 32.8 36 8.20 24.68 29.49 3.61Central Glass, Japan 950 29.23 9 3.0 6 26.90 27.61 23.17 23.26Mercury Computer Systems, USA 951 29.17 30 20.0 37 22.51 22.36 20.01 17.76GTECH, USA 952 29.13 -18 3.8 39 35.54 33.39 24.96 19.68Fiserv, USA 953 29.12 5 1.2 36 27.84 30.52 26.15 21.34MeadWestvaco, USA 953 29.12 -32 0.7 16 43.10 41.36 53.01 27.67NOVA Chemicals, Canada 953 29.12 4 0.9 5 27.96 26.21 22.72 23.30Snap-On, USA 953 29.12 -18 2.1 19 35.42 34.83 33.26 31.80Woodward Governor, USA 953 29.12 25 6.0 8 23.33 24.23 21.38 17.71Kone, Finland † 958 29.09 -37 1.2 20 46.23 60.74 43.49 28.17Nihon Unisys, Japan 959 29.04 -15 1.9 35 34.13 32.62 31.73 49.32Taiheiyo Cement, Japan 960 29.03 -2 0.7 6 29.71 36.84 36.84 37.33—–––––—— 2005/06 R&D <strong>investment</strong> —–––––—— ——––––––—– Previous R&D <strong>investment</strong> ——––––––—–change sales 2004/05 2003/04 2002/03 2001/02Company Rank £m 1 yr % % Industry £m £m £m £mMitsui Mining & Smelting, Japan 961 29.02 99 1.3 21 14.60 11.63 11.29 10.28Sigma-Aldrich, USA 962 29.01 17 3.0 5 24.81 24.82 23.57 22.09CNOOC, China 963 28.99 50 0.6 30 19.38 11.97 12.08 7.87Aruze, Japan 964 28.96 20 8.1 39 24.06 23.39 23.14 29.30PUMA, Germany 965 28.86 14 2.4 32 25.35 20.54 16.63 13.66Quanta Display, Taiwan 966 28.73 n/a 2.6 8 n/a n/a n/a n/aTokyo Ohka Kogyo, Japan 967 28.62 -14 6.5 5 33.28 29.75 28.64 23.38Silicon Storage Technology, USA 968 28.56 5 11.4 37 27.32 25.13 27.42 29.35Cubist Pharmaceuticals, USA 969 28.52 -12 40.6 33 32.58 31.44 25.87 28.71Groupe SEB, France 970 28.51 -2 1.7 19 29.00 27.90 25.63 19.93Artesyn Technologies, USA(now part of Emerson Electric) 971 28.48 19 11.5 8 23.96 20.00 20.00 24.16Komag, USA 972 28.47 20 7.1 37 23.76 24.51 10.72 23.04Toyama Chemical, Japan 973 28.44 12 36.1 33 25.47 25.11 24.15 29.70Inventec, Taiwan 974 28.39 13 1.0 37 25.03 23.78 16.91 15.76Hannstar Display, Taiwan 975 28.34 n/a 2.6 23 n/a n/a n/a n/aVishay Intertechnology, USA 976 28.33 -5 2.1 8 29.71 26.43 21.61 17.58Phelps Dodge, USA 977 28.31 50 0.5 21 18.93 17.59 15.14 15.79Modine Manufacturing, USA 978 28.28 52 2.8 2 18.64 18.30 17.39 17.40Armstrong, USA 979 28.25 4 1.4 19 27.14 25.86 32.56 32.79Daiwa House Industry, Japan 980 28.20 1 0.4 19 27.97 27.68 27.02 27.32Borealis, Denmark 981 28.17 0 0.9 5 28.17 29.55 28.17 28.86Aristocrat Leisure, Australia 982 28.11 11 5.1 39 25.22 27.09 27.79 23.48Actel, USA 983 28.06 6 26.9 37 26.42 23.07 22.92 20.52Myriad Genetics, USA 984 28.05 29 58.4 33 21.75 10.46 5.41 19.70Bucher Industries, Switzerland 985 28.02 17 3.3 20 23.91 22.32 25.06 25.10Micro-Star International, Taiwan 986 27.98 -2 2.1 37 28.61 23.75 16.08 11.80Tanox, USA 987 27.90 76 107.2 33 15.84 12.25 13.19 12.63Gildemeister, Germany 988 27.89 6 3.6 20 26.22 28.52 32.66 34.22Mitsui, Japan 989 27.87 -6 0.2 16 29.71 16.85 14.55 8.38Phonak, Switzerland 990 27.86 29 7.3 18 21.53 19.98 21.60 13.90Atheros Communications, USA 991 27.84 12 26.0 37 24.87 17.87 13.62 n/aLonza, Switzerland 991 27.84 -11 2.5 5 31.38 36.24 45.08 41.55Horiba, Japan 993 27.82 10 6.1 8 25.31 19.96 21.40 24.37York International, USA(now part of Johnson Controls) 994 27.78 13 1.1 16 24.64 24.58 26.91 27.32DRS Technologies, USA 995 27.73 22 2.7 1 22.66 16.54 8.39 5.53Jungheinrich, Germany 996 27.64 6 2.4 20 26.18 22.74 20.48 19.65NOF, Japan 996 27.64 -3 4.2 5 28.45 28.19 26.47 28.30Steelcase, USA 998 27.61 15 1.7 19 23.94 25.05 26.50 35.53Haldex, Sweden 999 27.59 14 5.0 2 24.23 21.67 21.23 21.96Krka, Slovenia 1000 27.57 15 7.2 33 24.01 21.02 19.43 16.23Shikoku Electric Power, Japan 1000 27.57 -6 1.0 7 29.23 30.85 36.62 39.22Flamel Technologies, France 1002 27.55 34 200.5 33 20.60 11.78 7.13 6.21Msc Software, USA 1003 27.53 12 15.5 35 24.53 23.73 24.08 20.86Ariba, USA 1004 27.50 -13 14.6 35 31.51 31.36 37.65 52.94Alltel, USA 1005 27.49 46 0.5 27 18.81 33.03 69.32 99.84Antigenics, USA 1006 27.42 15 >999.9 33 23.90 27.69 10.19 16.55Crown, USA 1007 27.38 0 0.7 16 27.38 25.63 25.05 23.30Dentsply International, USA 1007 27.38 5 2.7 18 25.98 25.22 24.23 16.48Sprint Nextel, USA 1007 27.38 47 0.1 27 18.64 9.32 n/a n/aNippon Light Metal, Japan 1010 27.33 15 1.0 21 23.71 21.85 23.13 n/aKansai Paint, Japan 1011 27.31 -7 2.8 5 29.38 28.61 29.80 31.98TriQuint Semiconductor, USA 1012 27.21 -23 15.3 37 35.40 37.88 34.10 30.18Hexagon, Sweden 1013 27.15 116 3.9 20 12.59 10.25 8.12 4.76Itron, USA 1014 27.10 5 8.4 8 25.85 25.06 21.42 17.47Amer Sports, Finland 1015 27.07 26 2.9 23 21.51 21.09 16.42 15.67DoubleClick, USA 1016 27.06 19 15.4 35 22.82 23.18 31.13 26.09Sonus Networks, USA 1017 27.02 27 23.8 37 21.21 19.44 32.41 63.23BAA, <strong>UK</strong>(now part of Airport Development and Investment) 1018 27.00 n/a 1.2 22 n/a n/a n/a n/aCompagnie Generale de Geophysique, France 1018 27.00 17 4.5 31 23.02 18.48 18.62 24.26Terex, USA 1020 26.97 20 0.9 20 22.48 14.39 3.61 5.30Nexen, Canada 1021 26.93 54 1.1 30 17.45 9.97 2.99 n/aNKT, Denmark 1022 26.88 -4 3.3 8 28.04 18.70 22.02 19.81Crane, USA 1023 26.85 -12 2.2 20 30.52 27.26 26.79 32.39184 <strong>The</strong> <strong>2006</strong> R&D Scoreboard<strong>The</strong> <strong>2006</strong> R&D Scoreboard 185


