

2006 The top 800 UK & 1250 Global companies by R&D investment
2006 The top 800 UK & 1250 Global companies by R&D investment
2006 The top 800 UK & 1250 Global companies by R&D investment
- No tags were found...

You also want an ePaper? Increase the reach of your titles
YUMPU automatically turns print PDFs into web optimized ePapers that Google loves.
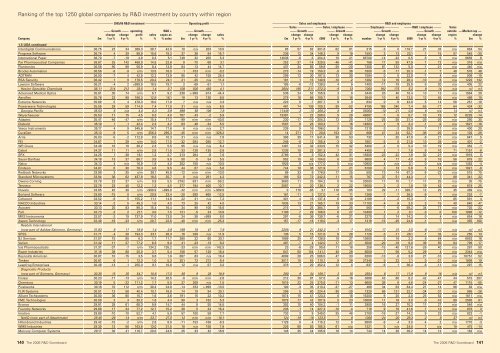
Ranking of the <strong>top</strong> <strong>1250</strong> global <strong>companies</strong> <strong>by</strong> R&D <strong>investment</strong> <strong>by</strong> country within region–––––––––––––––––– 2005/06 R&D <strong>investment</strong> –––––––––––––––––– ——–—–– Operating profit ——–—–– ––––––––––––––––– Sales and employees ––––––––––––––––– ————––—–––—— R&D and employees ——–—––——––––—–––––––––– Sales –––––––––– ––––– Sales / employee ––––– ––––––––– Employees ––––––––– ––––– R&D / employee ––––– Sales––––– Growth ––––– operating R&D + ––––– Growth ––––– ––––– Growth ––––– –––––– Growth ––––– ––––– Growth ––––– –––––– Growth ––––– outside –––Market cap –––change change profit sales capex as change change sales change change change change change change change change region changeCompany £m 1 yr % 4 yr % % % % sales £m 1 yr % 4 yr % % £m 1 yr % 4 yr % £000 1 yr % 4 yr % number 1 yr % 4 yr % £000 1 yr % 4 yr % % £m %1.5 USA continuedInterdigital Communications 36.75 23 34 369.3 38.7 42.0 10 n/a 203 10.5 95 57 82 301.6 62 81 315 -3 0 116.7 27 33 n/a 884 54Progress Software 36.74 4 29 98.9 15.6 18.3 37 38 94 15.7 236 12 34 148.2 9 19 1593 3 13 23.1 1 15 57 545 -20International Paper 36.70 -7 -19 4.9 0.3 5.1 749 32 205 5.3 14036 -6 -5 204.3 10 21 68700 -14 -22 0.5 8 5 n/a 9659 8Par Pharmaceutical Companies 36.67 25 142 466.0 14.5 22.6 8 -70 -88 3.1 252 -37 -14 329.5 -46 -41 766 17 50 47.9 7 72 n/a 316 n/aPlantronics 36.58 85 88 56.9 8.4 13.9 64 -13 44 14.7 437 34 85 59.9 -28 -20 7300 87 132 5.0 -1 -21 n/a 440 n/aBrooks Automation 36.56 -6 -9 n/m 13.5 16.0 -1 -103 n/m -0.2 270 -14 19 150.3 -9 36 1<strong>800</strong> -5 -17 20.3 -1 7 48 578 46ADTRAN 36.50 -7 4 42.9 12.2 13.9 85 42 155 28.4 299 13 30 187.5 13 30 1594 0 0 22.9 -7 4 n/a 909 -19RSA Security 36.42 1 9 176.5 20.2 24.1 21 -25 n/a 11.4 181 1 15 140.9 -10 -2 1282 12 16 28.4 -10 -6 n/a 1220 132Lawson Software 36.21 -4 2 >999.9 18.5 19.7 2 -69 -61 1.1 195 -8 -12 139.5 4 9 1400 -11 -19 25.9 8 20 n/a 405 22Hexion Specialty Chemicals 36.11 214 212 33.5 1.4 3.7 108 500 483 4.1 2604 165 211 372.0 -9 13 7000 192 175 5.2 8 14 n/a n/l n/lAdvanced Medical Optics 35.91 35 74 n/m 6.7 9.2 -238 >-999 -914 -44.4 536 24 52 155.9 3 0 3440 20 46 10.4 13 13 n/a 1964 29Aeroflex 35.76 23 99 196.3 12.8 16.1 18 13 130 6.5 279 16 68 105.7 5 18 2640 10 40 13.5 12 45 n/a 469 19Extreme Networks 35.69 5 4 478.3 16.0 17.8 7 n/a n/a 3.3 223 9 -7 267.7 9 3 834 0 -9 42.8 5 14 56 251 -18Powerwave Technologies 35.55 29 59 114.0 7.4 11.0 31 n/a n/a 6.5 481 74 136 100.2 -39 -52 4795 186 340 7.4 -55 -71 64 434 -32Georgia-Pacific 35.53 -5 n/a 4.0 0.3 3.9 898 58 106 7.8 11449 -3 -13 208.2 8 8 55000 -10 -21 0.6 6 n/a 14 n/l n/lWeyerhaeuser 35.53 11 15 4.5 0.3 4.0 787 -43 -2 5.9 13397 1 22 268.5 9 29 49887 -7 -5 0.7 19 19 12 8228 -14Adaptec 35.47 -46 -47 n/m 15.4 17.2 -99 n/m n/m -43.0 230 -17 -10 204.3 13 25 1128 -26 -28 31.4 -28 -26 n/a 280 30Diebold 35.19 1 -1 42.4 2.3 4.2 83 -48 -34 5.5 1507 9 26 103.2 7 16 14603 2 9 2.4 -1 -9 n/a 1621 -18Veeco Instruments 35.17 4 9 545.6 14.7 17.6 6 n/a n/a 2.7 239 5 16 196.0 9 19 1219 -3 -2 28.9 7 11 n/a 400 20CuraGen 35.13 -9 5 n/m 256.3 296.3 -45 n/m n/m -326.2 14 271 71 20.6 153 37 666 47 24 52.7 -38 -25 n/a 102 -29Arris 35.03 -5 -2 112.9 8.8 10.3 31 n/a n/a 7.8 396 39 17 541.4 38 53 732 1 -25 47.9 -6 21 n/a 647 5FEI 34.87 7 29 n/m 14.0 17.5 -32 -284 -280 -12.7 249 -8 12 155.4 -3 12 1601 -5 0 21.8 13 28 n/a 401 -2WR Grace 34.48 16 19 36.2 2.3 5.5 95 n/a n/a 6.4 1497 14 32 233.9 15 32 6400 -2 0 5.4 18 19 n/a 352 -1Cabot 34.37 11 11 n/m 2.8 11.5 -33 -128 -135 -2.6 1238 10 22 281.3 7 21 4400 2 1 7.8 9 10 71 1151 -6SPX 34.25 1 -38 16.1 1.2 2.7 213 284 -8 7.6 2788 9 3 152.4 42 31 18300 -23 -22 1.9 32 -21 n/a 1916 0Sauer-Danfoss 34.18 13 37 68.7 3.8 9.9 50 -5 54 5.5 902 10 43 104.8 6 23 8600 4 17 4.0 9 18 56 679 22Nalco 34.13 4 n/a 16.9 1.8 4.0 202 150 n/a 10.5 1929 9 n/a 177.0 5 n/a 10900 4 n/a 3.1 0 n/a n/a 1453 -4Emdeon 34.07 8 30 78.3 4.6 9.5 44 67 n/a 5.8 744 10 36 121.9 7 21 6100 3 13 5.6 5 14 n/a 1921 -9Redback Networks 33.98 3 -35 n/m 38.1 45.8 -12 n/m n/m -13.0 89 33 6 176.8 17 25 505 13 -14 67.3 -9 -22 n/a 515 75Standard Microsystems 33.94 36 62 437.8 18.3 25.7 8 n/a 291 4.2 186 53 73 242.3 11 15 767 37 51 44.3 -1 7 88 341 22Owens Corning 33.78 23 37 n/m 0.9 5.5 -2182 -931 n/m -59.2 3683 11 25 184.2 0 14 20000 11 10 1.7 11 25 n/a 35 -75Tenneco 33.78 23 40 12.2 1.3 4.5 277 184 400 10.7 2587 5 20 136.1 2 22 19000 3 -2 1.8 19 42 n/a 619 25Nuvelo 33.65 45 36 n/m >999.9 >999.9 -42 n/m n/m >-999.9 0 178 -96 3.1 116 -95 103 29 -11 326.7 12 29 35 489 n/aBorland Software 33.60 -15 0 n/m 20.8 23.4 -20 -285 -665 -12.5 161 -11 3 127.0 -4 11 1269 -7 -7 26.5 -9 7 n/a 252 -7Coherent 33.52 -8 5 155.2 11.1 14.6 22 31 n/a 7.2 301 4 16 137.4 6 18 2189 -1 -2 15.3 -7 7 65 591 4NACCO Industries 33.14 -2 5 45.3 1.8 4.0 73 25 42 4.0 1839 13 21 165.7 19 33 11100 -4 -9 3.0 3 15 40 640 47Avocent 33.13 25 83 98.3 15.4 16.4 34 98 106 15.6 215 1 25 384.7 8 25 560 -7 -6 59.2 34 77 n/a 725 -22Pall 32.73 -2 2 27.1 3.0 7.5 121 -5 24 10.9 1108 7 29 106.5 6 27 10400 1 2 3.1 -3 0 100 1898 -12MKS Instruments 32.57 -2 19 137.9 11.0 13.0 24 -38 >999 8.0 297 -8 36 130.7 -6 21 2270 -2 14 14.3 0 4 n/a 654 16Aspen Technology 32.49 -16 -23 n/m 20.7 22.6 -40 n/m n/m -25.3 157 -17 -16 119.0 -3 17 1319 -15 -29 24.6 -1 7 n/a 355 160Reebok International(now part of Adidas-Salomon, Germany) 31.83 8 17 18.9 1.4 2.9 169 15 47 7.6 2205 9 21 242.2 -7 -7 9102 17 31 3.5 -8 -11 n/a n/l n/lSPSS 31.71 -4 20 194.3 23.1 26.3 16 339 n/a 11.9 138 5 15 121.8 9 28 1129 -3 -11 28.1 -1 32 n/a 255 13BJ Services 31.57 15 85 8.3 1.7 11.7 380 22 60 20.1 1889 25 47 138.9 18 27 13600 6 16 2.3 8 64 n/a 6852 16Varian 31.42 11 27 77.2 6.3 9.0 41 -23 -13 8.2 497 -7 4 142.0 17 27 3500 -20 -18 9.0 39 55 64 799 17Isis Pharmaceuticals 31.37 -37 -7 n/m 134.2 135.2 -33 n/m n/m -142.5 23 -6 -29 90.6 11 18 258 -15 -40 121.6 -26 40 n/a 281 50Roper Industries 31.16 38 68 20.0 3.7 5.4 156 57 126 18.4 847 50 104 141.1 40 29 6000 7 56 5.2 29 4 n/a 2344 n/aReynolds American 30.87 10 -15 3.5 0.6 1.9 887 63 n/a 18.4 4809 28 25 586.5 47 33 8200 -13 -6 3.8 27 -10 n/a 10751 52Timken 30.81 6 1 12.3 1.0 5.3 251 73 272 8.4 3011 15 55 110.1 9 28 27345 5 23 1.1 0 -21 n/a 1808 19Leapfrog Enterprises 30.49 -14 -1 255.3 8.1 10.6 12 n/a -57 3.2 378 1 20 452.2 12 4 837 -9 1 36.4 -6 -11 n/a 297 15Diagnostic Products(now part of Siemens, Germany) 30.35 15 35 54.7 10.8 17.5 56 9 28 19.8 280 9 34 109.7 2 15 2554 6 17 11.9 8 16 n/a n/l n/lFinisar 30.23 -17 -13 n/m 14.2 20.5 -6 n/m n/m -2.8 212 30 87 57.5 -9 16 3688 43 60 8.2 -42 -47 44 515 207Chemtura 30.19 5 -22 111.2 1.7 5.0 27 209 n/a 1.5 1819 22 25 275.6 -11 13 6600 38 8 4.6 -24 -27 47 1115 -55Pixelworks 30.18 70 112 n/m 30.2 34.8 -14 -183 >-999 -13.5 100 -3 35 213.2 -27 -27 469 34 83 64.4 27 14 96 62 n/aFLIR Systems 30.01 12 58 40.4 10.1 16.8 74 19 94 25.1 296 5 60 224.4 -38 -29 1320 69 131 22.7 -34 -31 n/a 965 -26Alliant Techsystems 30.00 36 80 15.7 1.6 3.6 191 15 22 10.2 1874 15 41 123.3 6 18 15200 9 20 2.0 25 52 n/a 1611 n/aFMC Technologies 30.00 2 4 30.2 1.6 4.4 99 3 162 5.3 1879 17 42 187.9 5 23 10000 11 16 3.0 -8 -10 69 2585 61Kronos 29.91 29 61 68.3 9.9 14.7 44 8 55 14.5 302 15 40 104.2 -1 11 2900 16 27 10.3 11 27 n/a 546 n/aFoundry Networks 29.88 17 34 77.2 12.7 15.2 39 5 34 16.4 235 -1 14 327.2 -10 -4 719 9 19 41.6 7 13 n/a 876 3Imation 29.88 -10 -10 52.7 4.1 5.8 57 100 59 7.7 733 3 9 349.0 25 48 2100 -18 -27 14.2 9 23 n/a 822 -1NetIQ (now part of Attachmate) 29.45 -26 -14 n/m 23.7 27.5 -12 n/m n/m -10.1 124 -19 -16 123.5 7 6 1006 -24 -20 29.3 -2 8 37 n/l n/lHillenbrand Industries 29.42 -10 -2 n/m 2.6 8.9 -71 -153 -166 -6.3 1129 6 -4 115.2 12 0 9<strong>800</strong> -6 -4 3.0 -4 2 n/a 1770 -3WMS Industries 29.30 12 56 163.8 13.0 31.5 18 n/a 158 7.9 226 69 83 185.3 61 n/a 1221 5 n/a 24.0 7 n/a 19 475 -14Mercury Computer Systems 29.17 30 41 118.7 20.0 24.6 25 33 42 16.9 146 35 44 195.9 18 14 744 14 26 39.2 14 12 n/a 162 n/a140 <strong>The</strong> <strong>2006</strong> R&D Scoreboard<strong>The</strong> <strong>2006</strong> R&D Scoreboard 141


