

2006 The top 800 UK & 1250 Global companies by R&D investment
2006 The top 800 UK & 1250 Global companies by R&D investment
2006 The top 800 UK & 1250 Global companies by R&D investment
- No tags were found...

You also want an ePaper? Increase the reach of your titles
YUMPU automatically turns print PDFs into web optimized ePapers that Google loves.
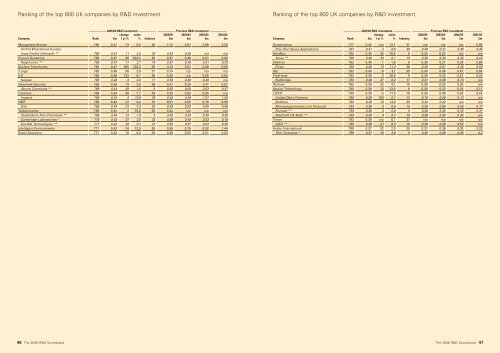
Ranking of the <strong>top</strong> <strong>800</strong> <strong>UK</strong> <strong>companies</strong> <strong>by</strong> R&D <strong>investment</strong>Ranking of the <strong>top</strong> <strong>800</strong> <strong>UK</strong> <strong>companies</strong> <strong>by</strong> R&D <strong>investment</strong>—–––––—— 2005/06 R&D <strong>investment</strong> —–––––—— ——––––––—– Previous R&D <strong>investment</strong> ——––––––—–change sales 2004/05 2003/04 2002/03 2001/02Company Rank £m 1 yr % % Industry £m £m £m £mManganese Bronze 760 0.47 -73 0.5 20 1.74 4.07 3.88 2.20Orchid Biosciences Europe(now Orchid Cellmark) ** 760 0.47 11 3.3 33 0.42 0.35 n/a n/aPursuit Dynamics 760 0.47 26 522.2 20 0.37 0.46 0.61 0.90Respironics ** 760 0.47 -17 2.7 18 0.57 0.46 0.51 0.33Surface Transforms 760 0.47 285 183.3 20 0.12 0.61 0.08 0.052 ergo 765 0.46 -38 2.0 27 0.74 n/a n/a n/aILX 765 0.46 133 6.7 36 0.20 n/a 0.05 0.84Naiglan 765 0.46 -9 0.2 17 0.50 0.46 0.46 n/aNewmark Security 765 0.46 13 3.8 36 0.41 0.34 0.17 0.07Akcros Chemicals ** 769 0.44 -29 1.5 5 0.63 0.64 0.53 0.37Cytomyx 769 0.44 88 7.7 33 0.23 0.02 0.05 n/aImparta 769 0.44 5 13.8 36 0.42 0.46 1.07 1.09NMT 769 0.44 -12 n/a 18 0.51 0.53 0.76 0.58Sira 769 0.44 -31 4.3 20 0.63 0.92 0.95 0.88Telephonetics 769 0.44 2 10.0 35 0.44 n/a n/a n/aTessenderlo Fine Chemicals ** 769 0.44 12 1.6 5 0.40 0.43 0.35 0.39Cambridge Laboratories * 776 0.43 -37 2.5 33 0.69 0.46 0.53 0.19Eco-Bat Technologies ** 777 0.42 -20 0.1 21 0.52 0.57 0.54 0.49Intelligent Environments 777 0.42 -24 13.5 35 0.55 0.79 0.92 1.44Retail Decisions 777 0.42 10 0.8 35 0.38 0.52 0.01 0.03—–––––—— 2005/06 R&D <strong>investment</strong> —–––––—— ——––––––—– Previous R&D <strong>investment</strong> ——––––––—–change sales 2004/05 2003/04 2002/03 2001/02Company Rank £m 1 yr % % Industry £m £m £m £mSynchronica 777 0.42 n/a 13.7 37 n/a n/a n/a 0.09Pole Star Space Applications 781 0.41 2 8.8 35 0.40 0.41 0.38 0.30AeroBox 782 0.40 34 76.5 5 0.30 0.20 n/a n/aAlcan ** 782 0.40 33 0.1 16 0.30 0.20 0.30 0.20Elektron 782 0.40 1 1.8 8 0.39 0.27 0.38 0.69Flytxt 782 0.40 13 11.4 36 0.35 0.61 0.45 0.56GB 782 0.40 -8 3.1 35 0.44 0.48 0.47 0.84PipeHawk 782 0.40 0 28.9 8 0.40 0.43 0.61 0.45Redbridge 782 0.40 27 0.2 17 0.31 0.38 0.73 n/aRedrow 782 0.40 33 0.1 19 0.30 0.20 0.30 n/aAppian Technology 790 0.39 13 13.5 8 0.35 0.23 0.24 0.11LiDCO 790 0.39 -4 11.3 18 0.40 0.48 0.30 0.44United Dairy Farmers 790 0.39 155 0.1 12 0.15 0.28 0.13 n/aBoltblue 793 0.38 -15 14.0 35 0.44 0.42 n/a n/aMoneysupermarket.com Financial 793 0.38 0 0.6 15 0.38 0.69 0.56 0.17Ronseal ** 793 0.38 0 0.8 5 0.38 0.35 0.33 0.31Steinhoff <strong>UK</strong> Beds ** 793 0.38 4 0.7 19 0.36 0.32 0.34 n/aTower 793 0.38 n/a 6.7 37 n/a n/a n/a n/aUGG ** 793 0.38 -21 0.3 16 0.48 0.48 0.52 n/aHydro International 799 0.37 22 2.0 20 0.31 0.36 0.20 0.20Thor Overseas * 799 0.37 -16 3.6 5 0.45 0.39 0.35 0.246 <strong>The</strong> <strong>2006</strong> R&D Scoreboard<strong>The</strong> <strong>2006</strong> R&D Scoreboard 47


