

2006 The top 800 UK & 1250 Global companies by R&D investment
2006 The top 800 UK & 1250 Global companies by R&D investment
2006 The top 800 UK & 1250 Global companies by R&D investment
- No tags were found...

Create successful ePaper yourself
Turn your PDF publications into a flip-book with our unique Google optimized e-Paper software.
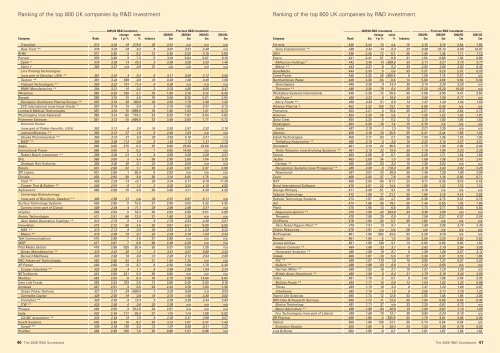
Ranking of the <strong>top</strong> <strong>800</strong> <strong>UK</strong> <strong>companies</strong> <strong>by</strong> R&D <strong>investment</strong>Ranking of the <strong>top</strong> <strong>800</strong> <strong>UK</strong> <strong>companies</strong> <strong>by</strong> R&D <strong>investment</strong>—–––––—— 2005/06 R&D <strong>investment</strong> —–––––—— ——––––––—– Previous R&D <strong>investment</strong> ——––––––—–change sales 2004/05 2003/04 2002/03 2001/02Company Rank £m 1 yr % % Industry £m £m £m £mTransitive 374 3.34 19 275.6 35 2.81 n/a n/a n/aDow Trent ** 376 3.32 -16 6.2 5 3.97 3.61 2.46 n/aRHM 377 3.30 -3 0.2 12 3.40 3.20 4.10 2.80Porvair 378 3.29 3 7.3 5 3.18 5.84 5.87 5.15Zytek * 379 3.28 14 40.3 2 2.88 3.08 3.20 1.48Vetco † 380 3.27 n/a 0.9 31 n/a n/a n/a n/aLinx Printing Technologies(now part of Danaher, USA) ** 381 3.24 4 6.2 8 3.11 3.06 3.12 2.56Textron ** 381 3.24 559 0.8 16 0.49 1.06 0.45 1.56Videojet Technologies ** 383 3.22 791 11.4 8 0.36 n/a n/a n/aBMW Manufacturing ** 384 3.21 -15 0.2 2 3.76 4.85 8.05 2.47Whatman 385 3.20 100 2.7 18 1.60 2.18 5.12 6.40Bespak 386 3.18 -10 4.0 18 3.56 6.35 5.51 3.65Dainippon Sumitomo Pharma Europe ** 387 3.16 25 100.0 33 2.52 1.75 1.30 1.22EVC International (now Ineos Vinyls) * 387 3.16 15 0.4 5 2.75 1.65 2.47 4.12Lombard Medical Technologies 387 3.16 76 >999.9 18 1.80 1.03 1.47 0.74Pharmagene (now Asterand) 390 3.14 -62 116.2 33 8.20 7.87 8.54 4.62Proteome Sciences 391 3.13 -10 >999.9 33 3.48 3.55 1.77 0.72Domnick Hunter(now part of Parker Hannifin, USA) 392 3.12 6 2.0 16 2.93 2.97 2.32 2.10JohnsonDiversey ** 392 3.12 27 1.8 5 2.46 1.03 n/a n/aOtsuka Pharmaceutical ** 394 3.10 -31 4.9 33 4.52 5.10 3.41 n/aBASF ** 395 3.08 112 0.9 5 1.45 1.72 1.41 1.73Aegis 396 3.00 275 0.3 25 0.80 25.80 24.50 23.20International Power 396 3.00 0 0.2 7 3.00 14.00 n/a n/aRobert Bosch Investment ** 396 3.00 -21 1.3 6 3.80 3.30 2.29 2.31SHL 396 3.00 3 4.4 36 2.90 2.60 1.84 3.10Strategic Rail Authority 396 3.00 50 0.1 22 2.00 5.00 n/a n/aRotork 401 2.96 22 1.7 20 2.43 2.07 2.37 2.06SPI Lasers 401 2.96 1 85.4 8 2.93 n/a n/a n/aChristie 403 2.92 39 3.8 36 2.10 2.05 1.75 n/aTotal ** 403 2.92 -13 999.9 7 3.30 0.69 n/a 0.03Carmelite Capital 429 2.50 -19 0.8 15 3.10 1.50 2.30 3.00Crompton ** 429 2.50 -5 12.4 5 2.63 2.39 2.44 2.63ITW ** 429 2.50 6 0.6 20 2.36 n/a n/a n/aPhoqus 429 2.50 -3 912.8 33 2.57 n/a n/a n/abede 433 2.49 117 36.3 37 1.15 1.14 1.08 0.92CA-MC Acquisition ** 434 2.48 12 7.5 8 2.20 2.47 2.98 3.07Kewill Systems 435 2.46 16 9.2 35 2.13 1.87 2.47 7.40Cargill ** 436 2.45 130 0.2 12 1.07 0.56 0.41 1.23PlusNet 436 2.45 156 7.0 35 0.96 1.01 0.66 n/a—–––––—— 2005/06 R&D <strong>investment</strong> —–––––—— ——––––––—– Previous R&D <strong>investment</strong> ——––––––—–change sales 2004/05 2003/04 2002/03 2001/02Company Rank £m 1 yr % % Industry £m £m £m £mFerraris 438 2.43 13 4.4 18 2.15 2.10 2.54 1.95Sony Entertainment ** 439 2.42 -74 0.3 23 9.38 22.14 0.60 10.01XKO 439 2.42 72 8.7 35 1.40 1.36 1.17 1.13Expro 441 2.41 57 0.8 31 1.54 0.68 1.32 0.98ReNeuron Holdings * 442 2.40 13 >999.9 33 2.11 3.21 3.70 3.77Merck ** 443 2.37 -6 5.2 33 2.52 2.85 2.82 6.32GeneMedix 444 2.33 5 n/a 33 2.21 3.23 2.01 0.78Ceres Power 445 2.32 46 >999.9 8 1.59 1.14 0.57 n/aNorthumbrian Water 446 2.30 -54 0.4 14 5.00 4.92 5.50 5.30Searchspace 446 2.30 8 14.4 35 2.14 2.34 3.20 n/aThomson ** 446 2.30 -79 0.4 25 11.20 15.20 16.00 n/aWorkplace Systems International 449 2.26 -12 29.5 35 2.56 3.98 4.47 3.50BioFocus † 450 2.23 8 18.0 33 2.06 1.58 0.71 n/aKerry Foods ** 450 2.23 51 0.5 12 1.47 1.43 1.54 1.50Alliance Pharma † 452 2.22 159 15.1 33 0.86 0.49 n/a n/aFlomerics 453 2.21 -3 19.4 35 2.27 2.37 2.64 2.75Antonov 454 2.20 76 n/a 2 1.25 1.22 1.02 1.07Dairy Crest 454 2.20 5 0.2 12 2.10 1.80 1.50 1.50Kensington 454 2.20 -19 1.4 15 2.70 n/a n/a n/aJeyes 457 2.19 -1 1.3 19 2.21 1.25 n/a n/aAlterian 458 2.18 -10 20.5 35 2.41 2.44 1.96 1.45Eckoh Technologies 459 2.17 63 2.7 36 1.33 1.36 1.23 1.05Trelleborg Automotive ** 460 2.15 -3 3.5 16 2.22 2.14 2.07 2.51Osmetech 461 2.13 22 36.5 33 1.75 1.38 2.85 2.49Tertio Telecoms (now Evolving Systems) ** 461 2.13 22 15.8 35 1.75 1.85 2.23 2.20Fenner 463 2.09 -9 0.7 20 2.28 1.71 1.84 1.92Jazztel 463 2.09 34 1.3 10 1.56 1.38 2.42 2.47Certegy ** 465 2.08 53 3.2 15 1.36 3.52 n/a n/aRecognition Systems (now Protagona) ** 465 2.08 -5 178.3 35 2.18 2.43 2.82 2.25Newchurch 467 2.07 42 36.8 35 1.46 1.35 1.88 2.95Corin 468 2.05 37 7.9 18 1.49 1.19 0.90 0.71NXT 469 2.04 -60 61.7 23 5.11 6.35 6.19 5.43Bond International Software 470 2.01 22 14.4 35 1.65 1.22 1.15 1.10George Wimpey 471 2.00 -51 0.1 19 4.10 n/a n/a n/aTadpole Technology 472 1.98 17 21.7 35 1.69 2.16 4.42 3.92Robotic Technology Systems 473 1.97 -63 4.7 36 5.39 4.75 3.31 0.79Ant 474 1.96 40 78.1 35 1.40 0.60 1.03 1.88Planit 475 1.95 13 6.9 35 1.73 0.17 0.63 0.83Sequenom-Gemini ** 475 1.95 -42 834.6 33 3.35 2.05 n/a n/aTennants 475 1.95 25 0.9 5 1.56 0.21 0.01 0.04ClinPhone 478 1.94 20 5.7 35 1.62 n/a n/a n/aAkzo Nobel Nippon Paint ** 479 1.91 13 8.1 5 1.69 2.95 2.74 2.48Zincox Resources 479 1.91 n/a n/a 26 n/a n/a n/a n/aBioProgress 481 1.90 582 43.0 33 0.28 0.18 n/a n/aRenold 481 1.90 -5 1.0 20 2.00 2.20 2.50 2.50United Utilities 481 1.90 138 0.1 14 0.80 0.80 0.80 1.50Alstom Controls ** 484 1.89 -33 3.1 8 2.82 2.10 2.94 3.85Honeywell Analytics ** 485 1.88 19 9.7 8 1.59 1.88 0.67 3.14Intelek 486 1.87 -19 5.3 37 2.30 2.37 2.18 1.85NIC ** 486 1.87 119 1.8 16 0.85 1.37 0.81 0.92Nufarm ** 488 1.86 53 0.9 5 1.22 0.55 n/a n/aHerman Miller ** 489 1.82 16 2.7 19 1.57 1.24 1.29 n/aBritish Alcan Aluminium ** 490 1.80 6 0.4 21 1.70 2.10 3.40 2.90Volex 491 1.79 -2 0.7 8 1.82 1.86 2.48 3.33McCain Foods ** 492 1.77 15 0.6 12 1.54 1.62 1.22 0.86Tritrax 493 1.75 19 3.3 8 1.47 1.23 1.09 0.87Ultraframe 493 1.75 -14 1.8 6 2.05 2.11 1.76 1.22Tepnel Life Sciences 495 1.74 12 12.8 33 1.55 1.08 1.98 2.06DRS Data & Research Services 496 1.72 11 13.8 35 1.54 0.80 0.53 0.30Biotica Technology 497 1.71 37 n/a 33 1.25 0.91 0.73 n/aBayer Agriculture ** 498 1.69 64 20.8 15 1.03 0.87 1.13 1.03Fun Technologies (now part of Liberty) 499 1.66 75 12.1 39 0.95 0.24 0.18 n/aSR Pharma 499 1.66 -2 325.9 33 1.70 3.01 2.46 2.35Vebnet 499 1.66 126 51.1 35 0.73 0.84 0.94 n/aEvolution Studios 502 1.65 8 28.4 23 1.53 1.09 0.79 0.54Low & Bonar 502 1.65 -9 0.7 6 1.81 1.67 1.28 1.8240 <strong>The</strong> <strong>2006</strong> R&D Scoreboard <strong>The</strong> <strong>2006</strong> R&D Scoreboard 41


