

2006 The top 800 UK & 1250 Global companies by R&D investment
2006 The top 800 UK & 1250 Global companies by R&D investment
2006 The top 800 UK & 1250 Global companies by R&D investment
- No tags were found...

Create successful ePaper yourself
Turn your PDF publications into a flip-book with our unique Google optimized e-Paper software.
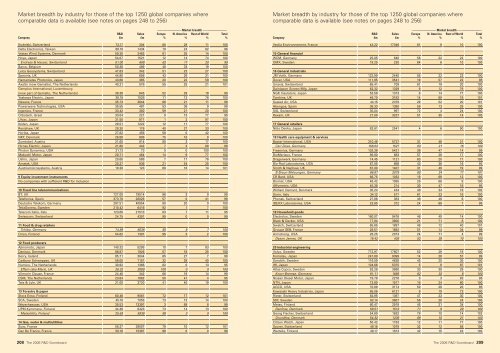
Market breadth <strong>by</strong> industry for those of the <strong>top</strong> <strong>1250</strong> global <strong>companies</strong> wherecomparable data is available (see notes on pages 248 to 256)——––––––––––––— Market breadth ——––––––––––––—R&D Sales Europe N. America Rest of World TotalCompany £m £m % % % %Kudelski, Switzerland 73.17 304 60 29 11 100Delta Electronics, Taiwan 68.19 1434 10 24 62 96Vestas Wind Systems, Denmark 59.30 2462 61 25 14 100Hoya, Japan 54.07 1521 12 14 74 100Endress & Hauser, Switzerland 51.00 608 62 17 20 99Barco, Belgium 50.38 489 48 33 19 100Leica Geosystems, Switzerland 47.63 342 51 22 27 100Spectris, <strong>UK</strong> 44.90 656 43 26 31 100Hamamatsu Photonics, Japan 43.66 365 20 22 58 100Axalto (now Gemalto), <strong>The</strong> Netherlands 40.21 578 55 25 21 101Gemplus International, Luxembourg(now part of Gemalto, <strong>The</strong> Netherlands) 38.38 645 52 29 18 99Yaskawa Electric, Japan 38.19 1528 11 13 76 100Nexans, France 35.73 3844 66 21 11 98Powerwave Technologies, USA 35.55 481 53 36 9 98Ingenico, France 33.42 300 59 21 20 100Orbotech, Israel 33.04 221 9 13 77 99Ulvac, Japan 31.50 971 1 2 97 100Ibiden, Japan 29.51 1222 12 11 77 100Renishaw, <strong>UK</strong> 29.30 176 40 27 33 100Horiba, Japan 27.82 456 58 0 42 100NKT, Denmark 26.88 806 75 16 9 100Zumtobel, Austria 21.65 814 80 3 17 100Hirose Electric, Japan 21.60 442 7 3 89 99Photon Dynamics, USA 21.13 73 0 0 100 100Mabuchi Motor, Japan 20.71 464 14 9 77 100Ushio, Japan 20.60 588 7 17 76 100Ametek, USA 20.27 836 21 54 25 100Austriamicrosystems, Austria 19.38 123 69 18 14 1019 Equity <strong>investment</strong> instrumentsNo <strong>companies</strong> with sufficient R&D for inclusion10 Fixed line telecommunicationsBT, <strong>UK</strong> 727.00 19514 96 3 0 99Telefonica, Spain 373.78 26029 57 0 41 98Deutsche Telekom, Germany 297.51 40954 80 20 0 100TeliaSonera, Sweden 210.42 6416 92 1 7 100Telecom Italia, Italy 123.68 21510 83 1 11 95Swisscom, Switzerland 24.75 4301 99 0 0 9911 Food & drug retailersTchibo, Germany 74.89 6038 85 8 7 100Orion, Finland 54.62 1307 95 3 2 10012 Food producersAjinomoto, Japan 140.32 5295 10 7 83 100Danisco, Denmark 86.87 1926 57 18 25 100Kerry, Ireland 85.71 3044 65 27 7 99Cadbury Schweppes, <strong>UK</strong> 58.00 7157 32 28 40 100Numico, <strong>The</strong> Netherlands 30.92 1366 82 0 13 95Effem (aka Mars), <strong>UK</strong> 26.32 2080 100 0 0 100Vilmorin Clause, France 24.46 342 66 19 14 99CSM, <strong>The</strong> Netherlands 23.84 1882 50 41 4 95Tate & Lyle, <strong>UK</strong> 21.00 3720 41 40 19 10013 Forestry & paperStora Enso, Finland 60.46 9061 72 17 12 101SCA, Sweden 45.16 7055 73 13 14 100Weyerhaeuser, USA 35.53 13397 3 88 8 99UPM-Kymmene, Finland 34.36 6423 73 14 13 100Metsaliitto, Finland 25.63 5939 88 3 9 10014 Gas, water & multiutilitiesSuez, France 58.27 28507 79 10 12 101Gaz De France, France 50.16 15387 98 0 0 98Market breadth <strong>by</strong> industry for those of the <strong>top</strong> <strong>1250</strong> global <strong>companies</strong> wherecomparable data is available (see notes on pages 248 to 256)——––––––––––––— Market breadth ——––––––––––––—R&D Sales Europe N. America Rest of World TotalCompany £m £m % % % %Veolia Environnement, France 43.22 17346 81 9 10 10015 General financialWCM, Germany 25.05 640 56 22 22 100OMX, Sweden 19.25 230 84 6 10 10016 General industrialsJM Voith, Germany 122.99 2440 55 22 23 100Dover, USA 111.95 3541 19 57 22 98Unaxis, Switzerland 65.41 709 61 19 20 100Dainippon Screen Mfg, Japan 62.32 1329 9 12 79 100NGK Insulators, Japan 52.58 1313 9 14 77 100Tomkins, <strong>UK</strong> 46.70 3182 14 69 18 101Sealed Air, USA 44.15 2379 29 52 20 101Abengoa, Spain 38.33 1390 58 13 29 100SIG, Switzerland 35.04 997 72 4 24 100Rexam, <strong>UK</strong> 21.00 3237 51 35 14 10017 General retailersNitto Denko, Japan 82.61 2541 4 6 90 10018 Health care equipment & servicesBaxter International, USA 310.46 5737 31 48 21 100Carl Zeiss, Germany 158.03 1527 63 21 16 100Fresenius, Germany 102.38 5421 38 47 14 99BioMerieux, France 89.80 683 57 26 17 100Dragerwerk, Germany 74.45 1121 63 20 17 100Bio-Rad Laboratories, USA 67.05 688 43 36 16 95Smith & Nephew, <strong>UK</strong> 67.00 1407 31 49 19 99B Braun Melsungen, Germany 66.87 2079 60 24 17 101CR Bard, USA 66.75 1032 19 69 12 100Biomet, USA 46.42 1095 26 66 8 100Affymetrix, USA 45.38 214 30 47 18 95William Demant, Denmark 35.24 434 48 34 18 100Sorin, Italy 34.12 517 61 23 16 100Phonak, Switzerland 27.86 383 48 46 6 100IDEXX Laboratories, USA 23.85 372 24 68 7 9919 Household goodsElectrolux, Sweden 160.07 9476 46 40 14 100Black & Decker, USA 77.94 3<strong>800</strong> 21 71 8 100Swatch, Switzerland 65.85 1897 49 12 40 101Groupe SEB, France 28.51 1692 51 14 34 99Armstrong, USA 28.25 2073 24 71 4 99Dyson James, <strong>UK</strong> 19.42 426 52 38 10 10020 Industrial engineeringVolvo, Sweden 772.97 17607 52 29 19 100Komatsu, Japan 247.80 8399 14 28 57 99Sandvik, Sweden 116.59 4638 45 20 35 100IHI, Japan 104.66 5375 5 9 87 101Atlas Copco, Sweden 92.29 3860 33 38 29 100Knorr-Bremse, Germany 91.11 1885 62 32 6 100Nissan Diesel Motor, Japan 79.78 2276 0 3 93 96NTN, Japan 73.80 1917 16 24 60 100AGCO, USA 70.89 3174 50 28 20 98Kawasaki Heavy Industries, Japan 65.06 6127 8 19 73 100Rieter, Switzerland 63.95 1397 47 23 30 100SKF, Sweden 62.14 3607 56 20 24 100Metso, Finland 60.47 2918 45 21 34 100Danfoss, Denmark 59.51 1512 71 9 20 100Georg Fischer, Switzerland 54.80 1632 78 10 14 102Grundfos, Denmark 54.32 1236 69 10 21 100Citizen Watch, Japan 50.42 1763 12 11 77 100Saurer, Switzerland 49.16 1079 32 12 56 100Wartsila, Finland 48.17 1813 42 15 43 100208 <strong>The</strong> <strong>2006</strong> R&D Scoreboard <strong>The</strong> <strong>2006</strong> R&D Scoreboard 209


