S tatistik fo r M P H : 5 F ra d en 4 . u g es statistik u n d erv isn in g : F ...
S tatistik fo r M P H : 5 F ra d en 4 . u g es statistik u n d erv isn in g : F ...
S tatistik fo r M P H : 5 F ra d en 4 . u g es statistik u n d erv isn in g : F ...

Create successful ePaper yourself
Turn your PDF publications into a flip-book with our unique Google optimized e-Paper software.
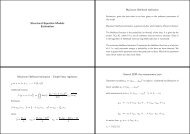
Adjustm<strong>en</strong>t <strong>fo</strong>r con<strong>fo</strong>und<strong>in</strong>g <strong>in</strong> cohort studi<strong>es</strong>:St<strong>ra</strong>tified analysis of <strong>ra</strong>t<strong>es</strong> (and risks)Male stomach cancer cas<strong>es</strong> <strong>in</strong> Cali and Birm<strong>in</strong>gham:CaliBirm<strong>in</strong>ghamAge Popu- Person- No.of Rate per Popu- Person- No.of Rate perlation years cancers 100000 ys. lation years cancers 100000 ys.0-44 524220 2621100 39 1.5 1683600 6734400 79 1.245-64 76304 381520 266 69.7 581500 2326000 1037 44.665+ 22398 111990 315 281.3 291100 1164400 2352 202.0Total 622922 3114610 620 19.9 2556200 10224800 3468 33.9Crude RR = 19.933.9Age-adjustm<strong>en</strong>t?Previously: standardisation.= 0.59 not relevant due to age-con<strong>fo</strong>und<strong>in</strong>g.Now: st<strong>ra</strong>tified (Mantel-Ha<strong>en</strong>szel) analysis.21Mantel-Ha<strong>en</strong>szel analysis.We have a seri<strong>es</strong> (here 3) of tabl<strong>es</strong> of the <strong>fo</strong>rm:Ev<strong>en</strong>ts Person St<strong>ra</strong>tum no. 3years“Risk factor +” a 1 y 1 a 1 = 315 y 1 = 111990“Risk factor −” a 2 y 2 a 2 = 2352 y 2 = 1164400Total a y a = 2667 y = 1276390One table from each st<strong>ra</strong>tum.22