S tatistik fo r M P H : 5 F ra d en 4 . u g es statistik u n d erv isn in g : F ...
S tatistik fo r M P H : 5 F ra d en 4 . u g es statistik u n d erv isn in g : F ...
S tatistik fo r M P H : 5 F ra d en 4 . u g es statistik u n d erv isn in g : F ...

Create successful ePaper yourself
Turn your PDF publications into a flip-book with our unique Google optimized e-Paper software.
Con<strong>fo</strong>und<strong>in</strong>g.Do we always get a fair comparison betwe<strong>en</strong> exposed and non-exposed?Not nec<strong>es</strong>sarily - a <strong>ra</strong>ndomly selected exposed person will (<strong>in</strong> the diag<strong>ra</strong>m below)typically be older than a <strong>ra</strong>ndomly chos<strong>en</strong> non-exposed.This is a problem if age is a risk factor <strong>fo</strong>r the outcome.EXPOSEDYoungNON-EXPOSEDYoungOldOld3Con<strong>fo</strong>und<strong>in</strong>g.A variable C is a pot<strong>en</strong>tial con<strong>fo</strong>under <strong>fo</strong>r the association:E → Oif it is1. related to the exposure:E − C2. an <strong>in</strong>dep<strong>en</strong>d<strong>en</strong>t risk factor <strong>fo</strong>r the outcome:C → O3. not a consequ<strong>en</strong>ce of the exposure (not an “<strong>in</strong>termediate” variable):E → C → OThat is:E − Cց ւO4
Risk of death s<strong>en</strong>t<strong>en</strong>ce:White murderer:722257 = 3.2%Black murderer:592606 = 2.3%⎫RR = 3.2%2.3% = 1.41 ⎬OR = 72·254759·2185 = 1.42 white vs. black⎭ln(OR) = 0.352q1L 1 = 0.352 − 1.96 + 1 + 1 + 1 = 0.003559 2547 72 2185q1L 2 = 0.352 + 1.96 + 1 + 1 + 1 = 0.70159 2547 72 218595% conf. limits: from exp(L 1 ) = 1.00 to exp(L 2 ) = 2.027Possible con<strong>fo</strong>under: <strong>ra</strong>ce of victimS<strong>en</strong>t<strong>en</strong>ceVictim Murderer Death Other TotalBlack White 0 111 111Black 11 2309 2320Total 11 2420 2431White White 72 2074 2146Black 48 238 286Total 120 2312 24328
How do we see if “<strong>ra</strong>ce of victim” is a con<strong>fo</strong>under?(2) S<strong>en</strong>t<strong>en</strong>ceVictim death otherwhite 120 2312black 11 2420(1) MurdererVictim white blackwhite 2146 286black 111 2320OR = 11.41OR = 156.8Sepa<strong>ra</strong>te analys<strong>es</strong> <strong>in</strong> st<strong>ra</strong>ta def<strong>in</strong>ed by con<strong>fo</strong>under:Black victim OR = 0·230911·111= 0White victim OR =(white murderer vs. black murderer)72·23848·2074= 0.1729Comb<strong>in</strong>ed analysis over st<strong>ra</strong>ta(= st<strong>ra</strong>tified analysis)(= the Mantel-Ha<strong>en</strong>szel method)We have a seri<strong>es</strong> (here two!) of two by two tabl<strong>es</strong>: one from eachst<strong>ra</strong>tum.st<strong>ra</strong>tum 1st<strong>ra</strong>tum ka b · · · a bc d · · · c dnnIn each st<strong>ra</strong>tum, we can <strong>es</strong>timate odds <strong>ra</strong>tio bya · db · c = a · d/nb · c/n10
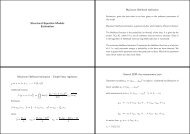
The Mantel-Ha<strong>en</strong>szel <strong>es</strong>timator.A common odds <strong>ra</strong>tio <strong>fo</strong>r all st<strong>ra</strong>ta may be <strong>es</strong>timated by theMantel-Ha<strong>en</strong>szel <strong>es</strong>timator∑ a·d= OR MHn∑ b·cn(weighted ave<strong>ra</strong>ge of sepa<strong>ra</strong>te OR-<strong>es</strong>timat<strong>es</strong>)In the example:OR MH =0·23092431 + 72·238243211·1112431 + 48·20742432= 0.17011The Mantel-Ha<strong>en</strong>szel t<strong>es</strong>t.In each st<strong>ra</strong>tum, we can calculate:OBS<strong>erv</strong>ed = aEXPected = (a+b)(a+c)SD == E(a)√ n(a+b)(c+d)(a+c)(b+d)n 2 (n−1)= SD(a)The comb<strong>in</strong>ed Mantel-Ha<strong>en</strong>szel t<strong>es</strong>t statistic is( ∑ a − ∑ E(a)) 2∑ (SD(a))2= X 2 MH ∼ χ 2 1 under H 0In the example: X 2 MH =((0 + 72) −( 111·11)) 22431 + 2146·1202432111·11·2320·2420(2431) 2·2430 + 120·2146·286·2312(2432) 2·2431= (−34.39)212.32= 96.0, P < 0.001.12
Interpretation:OR MH is an <strong>es</strong>timate of the association betwe<strong>en</strong> exposure (colour ofmurderer) and outcome (use of death s<strong>en</strong>t<strong>en</strong>ce), adjusted <strong>fo</strong>r thecon<strong>fo</strong>under (colour of victim).XMH 2 is a t<strong>es</strong>t statistic <strong>fo</strong>r no association betwe<strong>en</strong> exposure andoutcome, adjusted <strong>fo</strong>r the con<strong>fo</strong>under.Exam<strong>in</strong>ation of con<strong>fo</strong>und<strong>in</strong>gNote that 1. and 2., but NOT 3. can be checked (statistically) on thedata at hand.Degree of con<strong>fo</strong>und<strong>in</strong>g is oft<strong>en</strong> exam<strong>in</strong>ed us<strong>in</strong>g the change <strong>in</strong> <strong>es</strong>timatepr<strong>in</strong>ciple: how differ<strong>en</strong>t are adjusted and unadjusted (“marg<strong>in</strong>al”)<strong>es</strong>timat<strong>es</strong>.Selection of con<strong>fo</strong>unders is oft<strong>en</strong> based on prior knowledge.13Confid<strong>en</strong>ce limits <strong>fo</strong>r common odds <strong>ra</strong>tio1) calculate ln(OR MH ), here: ln(0.170) = −1.7722)calculate L 1 = ln(OR MH ) − 1.96 · SDwhere SD = |ln(OR √ MH)|, X2MHL 2 = ln(OR MH ) + 1.96 · SDhere SD = 1.772 √96.0= 0.181 that is:L 1 = −1.772 − 1.96 · 0.181 = −2.126,L 2 = −1.772 + 1.96 · 0.181 = −1.4183) The d<strong>es</strong>ired 95% confid<strong>en</strong>ce limits are from exp(L 1 ) = 0.119 toexp(L 2 ) = 0.242.Alternative (more complicated) <strong>fo</strong>rmula <strong>fo</strong>r SD on Silva, p.327.14
Exercise:Analyse (us<strong>in</strong>g the Mantel-Ha<strong>en</strong>szel method) the association betwe<strong>en</strong>l<strong>en</strong>gth of pr<strong>en</strong>atal care and neonatal mortality based on the <strong>fo</strong>llow<strong>in</strong>gdata.Is cl<strong>in</strong>ic a con<strong>fo</strong>under <strong>fo</strong>r this association?Mortality among newborns and amount of pr<strong>en</strong>atal care (McNeil, 1996).Cl<strong>in</strong>ic A pr<strong>en</strong>atal care
The “marg<strong>in</strong>al” 2 by 2 table ignor<strong>in</strong>g cl<strong>in</strong>ic ispr<strong>en</strong>atal care
Wh<strong>en</strong> is the st<strong>ra</strong>tified analysis s<strong>en</strong>sible?In the st<strong>ra</strong>tified analysis, we ave<strong>ra</strong>ge the <strong>in</strong>dividual OR’s from th<strong>es</strong>epa<strong>ra</strong>te st<strong>ra</strong>ta.This mak<strong>es</strong> s<strong>en</strong>se if the <strong>in</strong>dividual OR’s are roughly the same <strong>in</strong> allst<strong>ra</strong>ta (tak<strong>in</strong>g the <strong>ra</strong>ndom variation <strong>in</strong>to account).= if there is no <strong>in</strong>te<strong>ra</strong>ction betwe<strong>en</strong> exposure and st<strong>ra</strong>tificationvariable on the outcome= if there is no effect-modification of the st<strong>ra</strong>tification variable onthe relation betwe<strong>en</strong> exposure and outcome19ExampleT<strong>es</strong>ts <strong>fo</strong>r no <strong>in</strong>te<strong>ra</strong>ction existbut go beyond what we can cover <strong>in</strong> this course.Preval<strong>en</strong>ce of myocardial <strong>in</strong>farction by systolic blood pr<strong>es</strong>sure and age (Is<strong>ra</strong>eliIschemic Heart Disease Study, Kahn & Sempos, 1989).Age≥60 MI cas<strong>es</strong> MI negative TotalSBP≥ 140 9 115 124SBP< 140 6 73 79Total 15 188 203 OR=0.95Age
Adjustm<strong>en</strong>t <strong>fo</strong>r con<strong>fo</strong>und<strong>in</strong>g <strong>in</strong> cohort studi<strong>es</strong>:St<strong>ra</strong>tified analysis of <strong>ra</strong>t<strong>es</strong> (and risks)Male stomach cancer cas<strong>es</strong> <strong>in</strong> Cali and Birm<strong>in</strong>gham:CaliBirm<strong>in</strong>ghamAge Popu- Person- No.of Rate per Popu- Person- No.of Rate perlation years cancers 100000 ys. lation years cancers 100000 ys.0-44 524220 2621100 39 1.5 1683600 6734400 79 1.245-64 76304 381520 266 69.7 581500 2326000 1037 44.665+ 22398 111990 315 281.3 291100 1164400 2352 202.0Total 622922 3114610 620 19.9 2556200 10224800 3468 33.9Crude RR = 19.933.9Age-adjustm<strong>en</strong>t?Previously: standardisation.= 0.59 not relevant due to age-con<strong>fo</strong>und<strong>in</strong>g.Now: st<strong>ra</strong>tified (Mantel-Ha<strong>en</strong>szel) analysis.21Mantel-Ha<strong>en</strong>szel analysis.We have a seri<strong>es</strong> (here 3) of tabl<strong>es</strong> of the <strong>fo</strong>rm:Ev<strong>en</strong>ts Person St<strong>ra</strong>tum no. 3years“Risk factor +” a 1 y 1 a 1 = 315 y 1 = 111990“Risk factor −” a 2 y 2 a 2 = 2352 y 2 = 1164400Total a y a = 2667 y = 1276390One table from each st<strong>ra</strong>tum.22
The Mantel-Ha<strong>en</strong>szel <strong>es</strong>timator.In each table, we may <strong>es</strong>timate the <strong>ra</strong>te <strong>ra</strong>tio bya 1 /y 1a 2 /y 2= a 1y 2a 2 y 1= a 1y 2 /ya 2 y 1 /yA common <strong>ra</strong>te <strong>ra</strong>tio <strong>fo</strong>r all st<strong>ra</strong>ta may be <strong>es</strong>timated by theMantel-Ha<strong>en</strong>szel <strong>es</strong>timator (Weighted ave<strong>ra</strong>ge of sepa<strong>ra</strong>teRR-<strong>es</strong>timat<strong>es</strong>):P a1 y 2yP a2 y 1y= RR MH .In example: RR MH =39·67344009355500+ 266·23260002707520+ 315·1164400127639079·26211009355500+ 1037·3815202707520+ 2352·1119901276390= 1.45.23The Mantel-Ha<strong>en</strong>szel t<strong>es</strong>t.In each st<strong>ra</strong>tum, we can calculate:OBS<strong>erv</strong>ed = a 1EXPected = a · y1y= (a 1 + a 2 )y 1 +y 2= E(a 1 )√ √Standard Deviation = a y 1 y 2yy y= (a 1 + a 2 ) 1 y 2(y 1 +y 2 )= SD(a 2 1 )The comb<strong>in</strong>ed Mantel-Ha<strong>en</strong>szel t<strong>es</strong>t statistic is:( ∑ a 1 − ∑ E(a 1 )) 2∑ (SD(a1 )) 2 = X 2 MH ∼ χ 2 1 under H 0y 1X 2 MH =((39 + 266 + 315) −(11826211009355500+ 13033815202707520))111990 2+ 26671276390118 2621100·6734400(9355500)+ 1303 381520·23260002 (2707520)+ 2667 111990·11644002 (1276390) 2= (169.33) 2 /395.00 = 72.59 ∼ χ 2 1, P < 0.001.24
95% confid<strong>en</strong>ce limits <strong>fo</strong>r common <strong>ra</strong>te <strong>ra</strong>tio:1) Calculate ln(RR MH ) = ln(1.45) = 0.3732) Calculate L 1 = ln(RR MH ) − 1.96 · SDand L 2 = ln(RR MH ) + 1.96 · SDHere: SD = |ln(RR √ MH)|= √ 0.373X2MH72.59= 0.044.That is: L 1 = 0.373 − 1.96 · 0.044 = 0.287,L 2 = 0.373 + 1.96 · 0.044 = 0.459.3)The d<strong>es</strong>ired 95% confid<strong>en</strong>ce limits are from exp(L 1 ) = 1.33 toexp(L 2 ) = 1.58.Note: alternative (and more complicated) <strong>fo</strong>rmula <strong>fo</strong>r SD <strong>in</strong> Silva,p.330.25Example:British Doctors cohort study, compar<strong>in</strong>g coronary deaths amongsmokers and non-smokers adjusted <strong>fo</strong>r age (McNeil, 1996)DeathsPerson-yearsAge Group SM Non-SM SM Non-SM RR35-44 32 2 52407 18790 5.7445-54 104 12 43248 10673 2.1455-64 206 28 28612 5710 1.4765-74 186 28 12663 2585 1.3675-84 102 31 5317 1462 0.90Total 630 101 142247 39220 1.72Crude RR = 630/142247101/39220 = 1.72Age-adjustm<strong>en</strong>t not obvious, RR vari<strong>es</strong> among st<strong>ra</strong>ta:Effect-modification/<strong>in</strong>te<strong>ra</strong>ction !?26
27If risks (“person-d<strong>en</strong>om<strong>in</strong>ators”) are used <strong>in</strong>stead of <strong>ra</strong>t<strong>es</strong>(“person-years-d<strong>en</strong>om<strong>in</strong>ators”):Ev<strong>en</strong>ts No-ev<strong>en</strong>ts TotalRisk factor + a c a + cRisk factor − b d b + dExactly the same calculations may be used:Replac<strong>in</strong>g y 1 by a + cand y 2 by b + dSee: Silva, p.329.28
Exercise:Consider the British Doctors Study r<strong>es</strong>trict<strong>in</strong>g att<strong>en</strong>tion to the twoage groups 45-54 and 55-64 and compare smokers and non-smokersadjust<strong>in</strong>g <strong>fo</strong>r age.Data:45-54 Deaths PYRS 55-64 Deaths PYRSSM 104 43248 SM 206 28612Non-SM 12 10673 Non-SM 28 5710116 53921 234 3432229Solution.X 2 MH =RR MH =((104 + 206) −(116 · 4324853921104·1067353921+ 206·57103432212·4324853921+ 28·2861234322+ 234 · 2861234322= 1.66116 · 43248·10673(53921) 2 + 234 · 28612·5710(34322) 2 = 9.42 ∼ χ 2 1, P ∼ 0.002)) 2ln(RR MH ) = 0.509 , SD(ln(RR MH )) = 0.509 √9.42= 0.166L 1 = 0.509 − 1.96 × 0.166 = 0.184, L 2 = 0.509 + 1.96 × 0.166 = 0.834.95% confid<strong>en</strong>ce <strong>in</strong>t<strong>erv</strong>al from exp(L 1 ) = 1.20 to exp(L 2 ) = 2.3030