Publication
Publication
Publication
- No tags were found...

Create successful ePaper yourself
Turn your PDF publications into a flip-book with our unique Google optimized e-Paper software.
www.nordecon.comSky is the limit(OK, sometimes it’s the roof)Experts in construction and real estate development.
TOP ESTONIAN ENTERPRISES 2008ContentsEntrepreneurship Award 2008 – summary 8Estonian Companies’ Competitiveness Ranking 2008 - summary 9Entrepreneurship Award 2008 – winners 10Estonian Companies’ Competitiveness Ranking 2008 – winners 11Entrepreneurship Award 2008 - methodology 13Entrepreneurship Award 2008 - nominees and winners 14The History of the Entrepreneurship Award 32The History of the Estonian Companies’ Competitiveness Ranking 33Estonian Companies’ Competitiveness Ranking 2008 - main chart 37Estonian Companies’ Competitiveness Ranking 2008 - categories and winners 44Swedbank’s Special Prize to the Most Successful Expander in the Baltics 94Student Company 2008 95European Enterprise Awards - "Recognise promoters of enterprise 2008" 96“Financial Year 2007 - year of the cooling down of economy” 98– Leev Kuum, Estonian Institute of Economic ResearchEnterprise Estonia 102Estonian Chamber of Commerce and Industry 104Estonian Employers’ Confederation 106Review of the entrepreneurship contests’ ceremonial award-gala 2008 1084November2008
In-flight magazine of Estonian Air “In Time”Autumn 2008Magazine of Enterprise Estonia“Inseneeria” 3/2008aripaev.ee 28.08.2008Export is the future of Estonian economy.ESTONIAN EXPORT DIRECTORYTHE AIM OF THE ESTONIAN EXPORT DIRECTORY IS TO FACILITATE ESTABLISHING FOREIGN TRADERELATIONS FOR ESTONIAN ENTERPRISES IN EUROPE AS WELL AS ALL OVER THE WORLD.Estonian Chamber ofCommerce and IndustryIn January 2009 Estonian Chamber of Commerceand Industry will publish already for the fourteenthtime Estonian Export Directory - a practicalbusiness catalogue on Estonian Exporters.The Estonian Export Directory presents more than1300 Estonian exporting companies in alphabeticalorder and also by HS products and services classification.Additionally, you will find up-to-dateoverview about the constantly developing economicsituation in Estonia, useful addresses and overviewabout the Estonian Companies’ CompetitivenessRanking in English, German and French.Estonian Export Directory in the web:www.estonianexport.eePaper copy and CD of the Estonian Export Directory2008 & 2009 are for free. Ordering now onlydelivery costs will be added.Estonian Export Directory is published with co-operation Infoatlas AS, phone: +372 626 6988.Ask the catalogue:Estonian Chamber of Commerce and IndustryPhone: +372 640 0060 • Fax: +372 640 0061 • E-mail: koda@koda.ee • www.koda.ee
TOP ESTONIAN ENTERPRISES 2008Wishing strength to survive successfully in a world that is rapidly changing!The last year has been a year of major changes – both in the worldeconomy and in Estonia. The previous year, 2007, was very successfulfor us, but the current year, 2008, signifies the end of one economicgrowth cycle and the beginning of renewal necessary for a newgrowth cycle.It is very promising to be here today, among the most viable and successfulentrepreneurs in the Estonian economy. Moreover, we have reasonto celebrate today, because in a few moments, entrepreneurshipprizes will be awarded to the best companies of last year.But besides joy, the current situation is overshadowed by uncertainty.East and West from us, stock markets are crumbling to such an extentonly those who can remember more than a decade can recall. Financialinstitutions that only recently were considered to be the foundationsof a successful and functioning economic system are collapsing.In Estonia, we see difficulties with matching the revenue and expenditureof the state budget, because the economic growth we have becomeaccustomed to has slowed down. Our familiar logic behind thedrafting of the state budget, including the planning of revenue and expenditure,is significantly more difficult and causing more tension thanduring the last years of success.During the past decade, the Estonian economy has sometimes hadsuccess that has been miraculous. Today, our feet are firmly on theground again. The way things have turned out obliges us to ask twothings: have we overlooked something or have we done somethingwrong? Or is all this just an inevitability?Our success so far has to a great extent been a result of the advantagesthat were meant to disappear, such as very cheap labour force or lowdebt burden. Those were the advantages of a transitory economy ascompared to more mature economies; but in essence those advantageswere temporary and they had to be used to their full extent. Regardingthat, we have managed well. But the economic situation today –even without the problems of world economy – seems to be sayingthat passing one exam with flying colours does not put us amongwealthy countries. There is more to be done in order to achieve that.changes in other areas. This structure has remained unchanged in mostareas. With the economic structure Estonia has today, it is very difficult– if not impossible – to be among the truly developed countries.The structure of an economy is not something that can be changedovernight and by direct order. Changes must instead be the result ofthorough and thoughtful long-term work, taking into account one’sown and the entire world’s future needs.It would certainly mean investments into education, research and development.It might also mean a need for changes not only in investmentsbut also in general values.Now is not the time for accusations or finger pointing, inter alia,between politicians and entrepreneurs, who should really be eachother’s partners in a democratic society. Accusations against one anotherand the constant reminders of possible miscalculations do notmove Estonia forward. But we have to keep moving. Pessimism, beingconfused and looking for someone to blame would make us stop. Thatin turn would mean lost time and missed opportunities. We do nothave any time to lose.How to move forward? Do not look back at the past, but open youreyes and minds to new opportunities. These opportunities exist, onejust has to know how to notice them and learn how to use them. It isnamely because of this that I am happy to see several innovative companiesamong the nominees of today’s awards. I hope that those kindsof enterprises are the winners of the main prizes.In conclusion I would like to wish all entrepreneurs strength to survivesuccessfully in a world that is rapidly changing, and which is perhapsnot in the most stable state at the moment. All of you areresponsible for whether in ten years we can again talk about the Estonianeconomic miracle or not.Address to the enterpreneurs on the awarding gala on September 18th, 2008The turning points in economy are difficult times, but they also containopportunities for the future. Let us remember that the successfulsolutions to the economic problems of our Nordic neighbours at thebeginning of the 90s were the basis for their success today. And in thiscase, it is not about economy in the narrow sense. Namely, the Nordiccountries are one of the few countries in Europe today where social issuesand labour market policies have also been successfully addressedand whose state budget is sustainable even in the conditions of anaging population.The basis for all that was nevertheless the productivity of thoseeconomies, which in turn was based on their innovativeness, goodedu cation and advanced technology. Also, we should not forget thatthe great transparency of those societies causes the corruption level tobe low; and where there is less corruption, there is a better economy.This year we have often read from reputable sources that the structureof the Estonian economy has not managed to be up-to-date with greatToomas Hendrik IlvesThe President of the Republic of EstoniaNovember 20087
TOP ESTONIAN ENTERPRISES 2008Entrepreneurship Award 2008Entrepreneurship Award is the entrepreneurship competition with thelongest history in Estonia which dates back to the year 1996. Just inthis year the competition was organised under the leadership of thePresident Lennart Meri for the issue of the title “Foreign Investor1995”. The competition has changed and expanded with time andsince 2000 Enterprise Estonia organises the choosing and recognitionof the best companies under the name of “Entrepreneurship Award”.The primary objective of the competition is to recognise the successfuland perspective Estonian companies and set them as the examplesfor others. The wider aim is to contribute to the promotion of entrepreneurship,growth of the international competitiveness of the Estoniancompanies and therewith to the faster economic development.Each year the number and name of categories are slightly updated toguarantee the valuation of the companies in the more important sectorsfrom the viewpoint of the state economy. This year the categorieswere the Developer, Innovator, Exporter, Foreign Investor, IndustrialEnterprise and Tourism Innovator of the Year.The basis of choice is the questionnaires sent by the companies. In cooperationwith the Estonian Institute of Economic Research the rankingof each category is specified, of which the advisory committees ofEnterprise Estonia choose the three nominees and the winner companyper each category. The main winner of the EntrepreneurshipAward is chosen among the category winners by the representativejury, the members of which are the representatives of the universities,key ministries and circles of entrepreneurship.The participation in the competition has increased from year to year,good companies worthy of recognition exist in all categories and thereforethe making of choices is complicated. In several cases the discussionslasted for hours, but finally the results were also achieved.The competition “Enterprise Award 2008” culminates with the festivegala night in the concert hall of Estonia, where the winners will be announcedand the deserved awards will be given to the best.8November2008
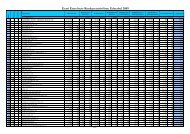
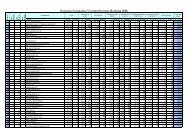
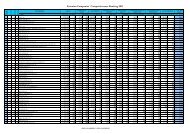
TOP ESTONIAN ENTERPRISES 2008Estonian Companies’ Competitiveness Ranking 2008As a representation organisation for Estonian businesses the EstonianChamber of Commerce and Industry has been working to promoteentrepreneurship through creating a business friendly climate for thelast 82 years. Generally the Chamber aims to conceive this throughconstructive partnerships – with the different ministries, the parliamentand the government. From time to time we try to grab and guidethe attention of Estonians towards very simple but significant economictruths – which, if occasionally remembered, help the businessmanbe more successful in his undertakings. That’s why we havedecided to draw your attention to competition.Competitiveness can be seen as the most significant characteristic of abusiness, a common denominator for individual special capabilities,and a complex ability. Businesses, which are better than others in therespective market – i.e. sell more and produce cheaper, manufacturebetter goods etc – are more competitive. The latter is reflected in betterfinancial results, in a more effective use of resources. Competitivenessshows the level of productivity, with which the business operatesand uses its resources.As in many other countries, various entrepreneurship contests in Estoniaare important means of developing the economic environment.The contests provide an opportunity to recognise the best companiesand promote entrepreneurship. The Estonian Companies’ CompetitivenessRanking is aimed at providing all Estonian companies withthe opportunity to compare themselves to those who are better. Thiscontest is granted by the representative organisations of Estonian companies- the Estonian Chamber of Commerce and Industry and theEstonian Employer’s Confederation. The evaluation methodology isprepared by the Estonian Institute of Economic Research. Only quantitativeindicators are taken into account, such as profit, turnover, investment,salary levels, return on capital, growth indicators, etc.A summary publication on the basis of the contest results has beenprepared for several years now. In addition to disclosure of rankinglists, its objective is to show why and how the winners have achievedsuch good results.ParticipantsAs many as 420 Estonian companies participated in the compilationof the Estonian Companies’ Competitiveness Ranking 2008 and 375of them qualified for the final countdown. The main reason for notqualifying was the negative net gain in 2007, but also incompletenessof submitted data and number of financial years which was insufficientfor participation.Competitive Small and medium size enterprise were established. Weare glad to note that 192 companies wished to be compared to othercompanies in this category. As in previous years, the largest number ofcompanies in the Competitiveness Ranking was among industrial orenergy related (101) enterprises. The least number of companiesequally in all the categories (11) came from food industry, tourism,business services, real estate and financial intermediation. It is interestingto note that there were as many construction companies thisyear as there were last year (55) and there was an intriguing change ofpositions among the best of the Ranking. Moreover, compared to previousyears several large companies did not compete this year, includingthe winners of various categories.WinnersFour of the last year’s winners were able to maintain their position andremain highly competitive – BLRT Grupp AS for the fifth and MažeikiuNafta Trading OÜ for the third year in a row. It is nice to see newnames among the winners, although the names are not very new ifyou look at the time they have been operating. For the second year ina row Tallink Grupp AS received the title of the Most Competitive Enterprise.Tallink Grupp AS also proved to be the Most Competitiveamong tourism companies. The winner of The Most Competitive Smalland Medium size Enterprise is Kaamos Kinnisvara OÜ, who was establishedin 2002 and who has also gained a high second place in itsown category (business services and real estate).The companies who have won titles in the Competitiveness Rankinghave the average history of 11 years, unless we consider Saku Õlletehaswhich was established in 1820 and has been operating for 188years. The youngest winners are Oma Ehitaja AS, Oilseeds Trade ASand Varmapartner OÜ (established in 2005) respectively among construction,agriculture, forestry and retail companies. If we look at theequity capital of the best companies in the Ranking, then almost 7companies are based 100% on Estonian private capital, 1 companybelongs to the Estonian Republic 100%, 1 company is based 100% onforeign capital and the equity capital of the rest of the winners is dividedbetween Estonian and foreign owners .We are also very proud that almost all the winners are the members ofthe Estonian Chamber of Commerce and Industry.The charts, methodology and any information regarding the competitionis available at: www.konkurents.eeAs last year, the participants could choose between 12 fields of activi -ty in order to benchmark themselves against their competitors. In additionto the general winner, for the second time this year the MostNovember 20089
TOP ESTONIAN ENTERPRISES 2008Entrepreneurship Award 2008Entrepreneurship Award 2008Foreign Investor 2007ABB AS 14Year of foundation: 1991Chairman of the Board: Bo Henriksson, Heiki KalveField of activity: energy and control engineeringtechnologyTourism Innovator 2008Emajõe Lodjaselts MTÜ 17Year of foundation: 2004Chairman of the Board: Priit Jagomägi, Ilmar TammField of activity: organisation of barge trips, trainingInnovator 2008VKG Oil AS 20Year of foundation: 1999Chairman of the Board: Nikolai PetrovitšField of activity: thermal treatment of oil shaleExporter 2008Ecometal AS 23Year of foundation: 1999Chairman of the Board: Marja KiristajaField of activity: recycling of lead-plate batteriesManufacturing Enterprise 2008Favor AS 26Year of foundation: 1990Chairman of the Board: Aivar KärmasField of activity: manufacture of leaf metal productsDeveloper of the Year 2008Tiptiptap OÜ 29Year of foundation: 2004Chairman of the Board: Kadri Klaassen, Rasmus VarunovField of activity: design, manufacture, installationof children’s playgroundsPHOTO: TOOMAS TUUL10November2008
TOP ESTONIAN ENTERPRISES 2008Estonian Companies’ Competitiveness Ranking 2008The Most Competitive Enterprise 2008The Most Competitive Tourism Enterprise 2008Tallink Grupp AS (group) 44Year of foundation: 1997Chairman of the Board: Enn PantField of activity: marine transportThe Most Competitive Small and Medium-sizedEnterprise 2008Kaamos Kinnisvara OÜ (group) 47Year of foundation: 2002Chairman of the Board: Priit UustulndField of activity: real estate developmentThe Most Competitive Retail Enterprise 2008Varmapartner OÜ 53Year of foundation: 2005Chairman of the Board: Riho SaksusField of activity: sale of waste handling equipmentThe Most Competitive WholesaleEnterprise 2008Mazeikiu Nafta Trading House OÜ 56Year of foundation: 2003Chairman of the Board: Tõnu ÄäroField of activity: wholesaleThe Most Competitive Industrial and EnergyEnterprise 2008BLRT Grupp AS (group) 59Year of foundation: 1996Chairman of the Board: Fjodor BermanField of activity: ship building and repairThe Most Competitive Food IndustryEnterprise 2008Saku Õlletehase AS 64Year of foundation: 1820Chairman of the Board: Veli Pekka TenniläField of activity: production and wholesale of low-alcoholbeverages, table water and soft drinksThe Most Competitive ConstructionEnterprise 2008Oma Ehitaja AS (group) 68Year of foundation: 2005Chairman of the Board: Kaido FridolinField of activity: main contracting for construction, real estate developmentThe Most Competitive Communicationand IT-services Enterprise 2008Eesti Telekom AS (group) 71Year of foundation: 1991Chairman of the Board: Valdo KalmField of activity: telecommunication,activity of holding enterprisesThe Most Competitive Forestry and AgricultureEnterprise 2008Oilseeds Trade AS 75Year of foundation: 2005Chairman of the Board: Veikko VaharField of activity: trade of cereals and rape seedThe Most Competitive Business Serviceand Real Estate Enterprise 2008Mainor AS (group) 78Year of foundation: 1979Director General: Ants PilvingField of activity: business developmentThe Most Competitive Financial BrokerageEnterprise 2008Gild Professional Services AS (group) 82Year of foundation: 1999Chairman of the Board: Rain TammField of activity: investment banking, private baking,management of alternative fundsThe Most Competitive Service Company 2008Olympic Casino Eesti AS 85Year of foundation: 1993Managing Director: Erki TavasField of activity: organisation of gamblingThe Most Competitive Transportationand Logistics Enterprise 2008Tallinna Sadam AS (group) 91Year of foundation: 1992Chairman of the Board: Ain KaljurandField of activity: work of portsNovember 200811
TOP ESTONIAN ENTERPRISES 2008The Methodologyof Entrepreneurship Award 2008Peep SürjeChairman of the Jury of Enterpreneurship Award 2008Rector of the Tallinn University of TechnologyThe objective of the competition“Enterprise Award 2008” is to expressstate recognition to the companiesthat are not only successful in thefinancial results of the recent years,but also innovative and sustainable inthe longer run.This year, awards will be given in sixcate gories: Developer of the Year 2008,Innovator 2008, Exporter 2008, Foreign Investor2008, Industrial Enterprise 2008 andTourism Promoter 2008. By determining categories,the companies of the fields the constantdevelopment and good performance of whichis the most important are pointed out.Assessment criteria are elaborated for everyaward category, of which some are the same inall categories – high profitability, innovative solutionsand ability of a company to establish itselfon export markets. The basis and methodsfor the evaluation criteria have been preparedby the specialists of Enterprise Estonia, experiencefrom previous years as well as advice fromseveral renowned experts including AndresSütt (the Bank of Estonia), Erik Terk (The EstonianInstitute for Future Studies), JaakLeimann (Tallinn University of Technology),etc., have been taken into account.Participation in the competition was voluntaryfor enterprises; the prerequisite is the filling inof the questionnaire and readiness to provideinformation on their activity and economic indicators.The questionnaires were prepared andinitial processing of information organised bythe Estonian Institute of Economic Research.The assessment of companies was organised intwo stages. First, a ranking of companies thatqualified on the basis of the methods preparedfor every category (considering the proportionsof various criteria) was compiled and ten bestcompanies given for further assessment to thecouncils of Enterprise Estonia. The councils selectedthree nominees from every category, anda category winner from these nominees. Thisyear, the competition was extremely tough inthe category of industrial enterprises, in case ofwhich the council made an exception andpointed out four presentable nominees. Whenselecting winners of the categories, in additionto the economic performance of the competingcompanies, the councils also took guidancefrom the general national development prioritiesof the Estonian entrepreneurship. The largejury of the competition selected the main prizewinner from the winners of all categories.The jury included the Rector of Tallinn Universityof Technology Peep Sürje, the Rectorof the University of Tartu Alar Karis, theMinister of Economic Affairs and CommunicationsJuhan Parts, the Minister of ForeignAffairs Urmas Paet, the President of theBank of Estonia Andres Lipstok, the formerChairman of the Supervisory Board of EnterpriseEstonia Üllar Jaaksoo and a Memberof the Management Board of AS TallinkGrupp, last year’s winner of the competition.November 200813
TOP ESTONIAN ENTERPRISES 2008Nominees for the Entrepreneurship Award 2008Enterprise Established Main activity Private capital Private capital Owners' equity Sales Change in sales Net profit Investment to Employees Sales perEstonia foreign 2007 2007 2007 compared 2007 fixed assets 2007 employee 2007(%) 2007 (%) 2007 (mln EEK) (mln EEK) to 2006 (%) (mln EEK) 2007 (mln EEK) (mln EEK)TTIPTIPTAP OÜ 2004 DESIGN, MANUFACTURE, 100 0 3.34 19.59 58 2.28 0.113 19 1.03INSTALLATION OF CHILDREN’S PLAYGROUNDSFAVOR AS 1990 MANUFACTURE OF LEAF METAL PRODUCTS 100 0 82.70 309.86 23 65.67 15.14 165 2.09ABB AS 1991 ENERGY AND CONTROL ENGINEERING TECHNOLOGY 0 100 352.00 1,700.00 24 82.00 145.00 704 2.41VKG OIL AS 1999 THERMAL TREATMENT OF OIL SHALE 100 0 1,727.00 1,460.00 36 329.40 716.97 597 3.68ECOMETAL AS 1999 RECYCLING OF LEAD-PLATE BATTERIES 100 0 90.50 314.52 120 122.00 2.00 53 5.93EMAJÕE LODJASELTS MTÜ 2004 ORGANISATION OF BARGE TRIPS, TRAINING 100 0 N/A 0.85 373 0.30 N/A 3 0.281 EUR = 15.6466 EEK; 1 EEK = 0.0639 EUR; based on 2007 data See also www.konkurents.eeEntrepreneurship Award 2008EEntrepreneurship Award 2008Foreign Investor 2008ABB ASEight reasonswhy ABB loves EstoniaABB, who won the Foreign Investor prizefor the second year in a row, and whowas also the overall winner of the EntrepreneurshipAward 2008, considers Estonia to bea good place to do business in. The group’smanager of the Baltic States, Bo Henriksson,gives eight reasons why that is the case.Favourable economic environmentRegarding Estonian competitiveness, a lot hasbeen said about the tax environment and thelow level of costs. Henriksson thinks that thelabour costs here are not at all lower than elsewhereanymore, but the tax environment certainlybenefits the development of the company.So far, the owners of ABB have not taken dividendsfrom the Estonian unit, but instead havedirected all of the profits to the development ofproduction. When the profits are not taxed, thecompanies do not need as many loans to investin production. And that is a relief for the industry.The parties support economic growthAccording to Henriksson, the Estonian governmentshave not interfered with entrepreneurship,they have focused more on establishingthe rules for an attractive business environment.He thinks that one of the outcomes ofthis is the local significantly smaller businessbureaucracy and greater transparency than inthe neighbouring country Latvia.Confidence in the economy’s perseveranceAt a time when the Estonian economy is ratherstormy, many foreign investors are doubtfulabout the situation here. Henriksson, however,affirms that he is certain that the favourableeconomic environment will persevere. The Estonian,Finnish and Swedish factories of theABB group form a “triangle” whose corners supporteach other. If any problems occur here,help will come from across the gulf. And theunits in Estonia are subcontractors for the factoriesacross the gulf. Henriksson does not ruleout the possibility that in the future Finnishand Swedish factories will be the subcontractorsfor Estonian factories instead.14November2008
TOP ESTONIAN ENTERPRISES 2008The ABB group’s manager of the Balticstates, Bo Henriksson, “The image ofEstonians as lazy workers with low productivityis not true in the case of ABB.In the factories of ABB Eesti the workproductivity and people’s motivation areon the same level as in the Finnish factories”.PHOTO: TOOMAS TUULContinuously strong know-how ofyoung specialistsThe Estonian labour force is well qualified anddespite there being constant talk about labourforce shortage, ABB has managed to successfullyfind all the necessary employees. At leastso far. According to Henriksson, the workingclimate here is similar to the Nordic countries:the workers do not need to be told twice whatto do and how. Once is enough. ABB has investeda lot in the employees’ training. For instance,Estonian vocational schools do notteach how to produce wind turbine generators– consequently, ABB had to train that part ofthe staff themselves. In addition to that, thecompany co-operates a lot with Tallinn Universityof Technology and several vocationalschools such as Tallinn Polytechnic School andTallinn Industrial Education Centre. ABB considersmaintaining a good reputation importantas well, so that they would not have to lure peoplewith high salaries but more with their goodname.People’s strong will to workBased on the above-mentioned one could saythat ABB has managed to dispel a number ofmyths – for instance the one about Estonia havinga labour force shortage, or that the businessenvironment is not favourable for industry inEstonia. Hereby, another myth is dispelled.Namely, Henriksson says that the image of Estoniansas lazy workers with low productivity isnot true in the case of ABB. In the factories ofABB Eesti the work productivity and people’smotivation are on the same level as in theFinnish factories. It might even be slightly betterhere, the head of ABB’s Baltic region says.One of the reasons for this is definitely thebene fits offered to the workers, for instance thestudy benefit: should you wish to study – thecompany will support you.Good ties with Finland and SwedenIn Henriksson’s opinion, Estonia’s Western-Nordic culture matches well with the Finnishand Swedish ones. The reasons for this are historical,of course, and are based on the inflowof Nordic capital into the Estonian economy.“Besides, the gulf between Tallinn and Helsinkihardly exists anymore. A helicopter covers thedistance in about 20 minutes, a ship in aboutan hour and a half,” Henriksson says.A good opportunity for expanding productionWithin the ABB group, the Estonian unit is lobbyingfor expanding the production, becausefor instance in Finland, the company has runout of space for that. Henriksson does not ruleout the possibility that ABB Eesti could build afactory for instance in Narva or Tartu, wherefinding labour force is slightly easier. At thesame time, the company must consider thegroup’s expansion policies: new productionbases are established where the demand is increasing.Global economy favours production inEstoniaHenriksson thinks that global economic trendsfavour production in those countries where demandis close by. The manager of ABB is referringto two things. First of all, the trend to shiftproduction to China has started to reverse. Severalfactories have been moved back from Asiato Europe, realizing that some problems arebound to occur in countries with cheap labourforce, for instance, the transporting of one windturbine generator from China into Europe is extremelyineffective. Secondly, Henriksson saysthat in ABB’s practice, the business modelwhere the so-called mother factory is in Finlandand a daughter factory supports it from Estoniaworks well.The investments of ABB EestiABB Eesti primarily produces wind turbinegenerators and frequency changers. The productionof both products has been expandedseveral times.For example, in the year 2007, approximately145 million kroons was invested mainly in thesubstation equipment manufacturing facility inMaardu and the production of frequencychangers in Jüri.This year, almost 200 million kroons was investedinto the factories in Jüri that produce frequencychangers and wind turbine generators.Due to the expansion of production, nearly 250new jobs were created in the year 2007, thisyear almost 100 were added. Altogether over1000 people work in the factories of ABB Eesti.The first wind turbine generators were fully assembledin Jüri in the year 2007, before thatthe factory produced only components of thegenerators, mainly stators and rotors. The productionis sold to the world’s leading wind parkmanufacturers. They enter into yearly contracts,as a rule, altogether regarding 200-500generators, for instance. One generator costsabout one million kroons.The ABB group operates in more than 100countries and it employs more than 100 000people.November 200815
TOP ESTONIAN ENTERPRISES 2008Nominees for the Foreign Investor 2008Enterprise Main activity Total amount of Sales 2007 Net profit 2007 Share of export Change infixed assets Average number ofinvestment (mln EEK) (mln EEK) (mln EEK) in sales 2007 (%) 2006/2007 (mln EEK) employeesIF EESTI KINDLUSTUS AS INSURANCE 200 1,239.05 213 0 1.69 409ABB AS PREPARATION, SALE AND SERVICING OF ENERGY 645 1,700.00 82 65 100 1021PRODUCTS AND SYSTEMS, CONTROL ENGINEERING ANDPROCESS CONTROL ENGINEERING PRODUCTS AND ROBOTSPÕLTSAMAA FELIX AS PRODUCTION AND MARKETING OF FOODSTUFFS 190 284.39 7.42 34 37.05 2091 EUR = 15.6466 EEK; 1 EEK = 0.0639 EUR; based on 2007 data See also www.konkurents.eeIf Eesti Kindlustus ASAS If Eesti Kindlustus belongs to the leadingNordic non-life insurance group If P&C InsuranceHolding Ltd, which is owned by SampoPlc. AS If Eesti Kindlustus has operated in theEstonian non-life insurance market as the marketleader since the year 2000. The company’smarket share in 2007 amounted to 33.3%(36.1% in 2006). Last year, the premiums writtenwere divided into insurance categories asfollows: voluntary motor own damage insurance(36%), property insurance (32%), mandatorymotor third party liability insurance (24%)and other insurance (8%). The insurance companydevelops and offers non-life insurance solutionswhich guarantee security and stabilityfor the customer in both business and privatelife.The year 2007 was good for If Eesti Kindlustusas far as economic activities were concerned.The volume of written insurance premiums increased9.6% as compared to the year 2006;this growth was smaller than the averagegrowth of the market but it reached the targetset for the year 2007 – the turnover was ca 1.2billion kroons. The insurance company’s consolidatednet profit during the accounting periodturned out to be 213.1 million kroons (theamount for the same period last year was 215million kroons), of which profit from financialinvestments accounted for 50 million kroons(the profit in the year 2006 was 26.4 millionkroons) and the profit from insurance activitiesaccounted for 163.1 million kroons (188.6 millionkroons in the year 2006). The companyemploys more than 400 people. The volume ofinvestments made into Estonia exceeds 200million kroons, the added value per employeeis 521 000 kroons.Põltsamaa Felix ASThe tradition of production in Põltsamaa canbe traced back to the year 1920 when the predecessorof the company, then known as EestiTarvitajateühistute Keskühisus (The Central Associationof Estonian Consumer Associations)was founded. During different periods of time,Põltsamaa has produced spirits, potato flakes,coffee, starch, fruit and vegetable conserves andberry wines.Today, AS Põltsamaa Felix produces and marketshigh-quality food products such as juicesand drinks, pickles, cooked dishes, sauces,jams, spreads, wines, fish products and muchmore. The company is increasingly focused onthe taste, quality and healthiness of the food.Põltsamaa Felix has by now become the biggesttaxpayer and the largest employer of the regionwith more than 170 employees. The turnoverof the company in the year 2007 was more than280 million kroons, and the company’s netprofit exceeded 7 million kroons. PõltsamaaFelix’s investments in Estonia amounted to 190million kroons, a total volume which puts thecompany in third place among other candidatesfor Foreign Investor 2008. The absolute changein the company’s capital assets put the companyin second place among the candidates. The investmentsthat the company made were varied.More than half of the capital was invested inequipment and property. A fifth of the capitalwas invested in intellectual property and stafftraining. The company was the only one amongthe candidates to invest in supporting infrastructure.The company employs more than200 people.FOREIGN INVESTORThose enterprises are recognisedwhich are especially outstandingwith regard to the volume of directforeign investments made intoEstonia and to the contribution intothe Estonian economy viainvolvement of new technologiesand creation of highly qualifiedpositions.16November2008
Entrepreneurship Award 2008Tourism Innovator 2008EMAJÕE LODJASELTS MTÜThe barge men enliven the tourismof Emajõgi and PeipsiMTÜ Emajõe Lodjaselts, the most notabletourism innovator of the year, attractstourists to south-eastern Estonia with itshanseatic barge, barge yard and imaginativeideas like a magnet.The barge men erected a small barge yard ona coast of Emajõgi and built two small Peipsiskiffs and a barge there. The latter is now usedto take people around Emajõgi, Lake Peipsiand Võrtsjärv. There is a veritable cornucopiaof colourful plans, starting from building a bigbarge yard and ending with building newViking barges and a paddled steamer.From the interview with the spiritual engineof the barge society, Priit Jagomägi, it becomesclear that even though all this could be a goodbusiness, it is more of a fanatic passion for allthose involved.How did the building of the barge go?Together with all the initial preparations ittook about a year and a half or two years. Thebuilding of the barge was completed in theyear 2006. We went to Russia and to Frieslandin the Netherlands to search for ship mastersand talk to cog builders. Prior to that we hadmade a small Peipsi skiff under the guidanceof an old boat master, and because it turnedout well, we had enough courage to build abarge. Life itself has taught us to build ships.The wisdom has accumulated over the years,with the help of the trial-error method. Everythinghas its own tricks and methods, butThe spiritual engine of the barge society,Priit Jagomägi, “Our main idea is tooffer people a chance to travel in time.”PHOTO: TOOMAS TUULNovember 200817
TOP ESTONIAN ENTERPRISES 2008when you put your heart into it, it will slightlycompensate for the lack of skill. Or as theysay: well begun is half done. But just half, therest comes with hard work, arguments andtoiling.The barge is completed, but the other goal –building a big barge yard and the River Centrein Tartu – has not been fulfilled yet. Doesthat mean that only a half of the initial planhas been realized?Definitely a lot less than a half. We have shipbuilding plans for the following 20 years atleast! Next year, we would like to start thebuilding of a copy of the Swedish battleshipUlrica. During the Great Northern War, theSwedes built altogether 30 two-masted battleshipslike that, with six pairs of oars and tencannons near Tartu, but they quickly becamethe booty of the Russians after the battle ofKastre in 1704. We acquired very accurate designsof the ship from the Swedish war archiveand we have talked to the Swedish Embassyabout it as well. Because the timetable of thebarge has been absolutely mad, we have notmanaged to start doing all the things we haveplanned.How big is the interest in sailing on thebarge?The demand is huge. It sails so much it ispractically falling apart! We cannot have allthe interested people on board this tiny barge.Even though the barge could take even 500people on board, we mostly do not allow morethan 30 people on board at once. And we cannotdo many more trips because the scheduleis already so full that there is little time foreven maintenance breaks. We should really tryto finish the Viking barges that are under constructionquickly and start operating them. Upto 30 people at once – that sets its limits, becausetravel operators calculate tourists accordingto arriving busloads. So the barge istoo small for busloads of Finnish tourists.How much have you advertised the barge?We have not advertised the barge at all. Therehas been quite a lot of publicity surroundingus in the media. And the people who havebeen on the barge, and been satisfied with it,talk about it to their friends. So this famecomes from a snowball-effect. And of course,people want to see nutcases like us. It seemsthat not even the big ships of Tallink have hadas much attention as our little barge. It hasreally been blown out of proportion.What is the purpose of the new ships – toserve more tourists?Our main idea is to offer people a chance totravel in time. Travelling in space has alreadybeen made so easy – a plane can take you tothe other end of the world in a few hours andthat does not amaze anyone. But the real effectis when you can travel back in time, 500-600 years, when you step on the barge.Naturally, we could not build a very archaicship, because it has to meet today’s requirementsof passenger transport. For instance, ithas to have an engine and safety equipment.So, the hanseatic barge Jõmmu is probably theworld’s first Peipsi barge equipped with an engine!What other ideas do you have besides buildinga Swedish warship?We would like to build a large two-mastedbarge, we got the drawings from the EstonianNational Museum. It would fit many morepassengers, certainly a tax-free shop, anaquatic centre, a lobby bar and a casino(smirks).One of our biggest, most distant and most expensivedreams is finding “Juliane Clementine”,the first paddle steamer of the Balticcountries, from the bottom of Lake Peipsi andbuilding a replica of that ship. The only cannonboat left from the War of Independence,Uku, is rusting away at the bottom of the EmajõgiRiver – it should be fixed up by the republic’s100. Independence Day!What other possibilities would you like tooffer to people on the barge besides showingmovies and theatre performances?Instead of just driving up and down we wouldlike to develop the theme of a nature barge.We initiated it this year: we went to listen tobirds’ song with the ornithologists on earlymornings, and at night we sailed especially tolisten to bats and night birds. In addition tothat, we sailed from Piirissaare to Tartu withnature photographers. In autumn we wouldlike to organize cranberry trips and on-bargeobservations of stars and constellations.Who sail on the barge?We do not have any actual statistics. But thereare a lot of Estonian companies who bringtheir foreign visitors onto the barge. Peoplefrom 20 different countries have visited us, includingfrom Sri Lanka and Bangladesh. Thepopularity is a bit of a disservice for us. Becausethe barge has been booked a long timein advance, it is not really possible to offer aride for random tourists visiting Tartu. At thesame, the employees of Tartu’s tourist informationcentre say that the first thing all foreigntourists ask about is a barge ride andPiirissaare. Unfortunately, they have to be directedto Toomemägi and the museums. Weare being used very successfully as a decoyduck for attracting tourists to this area.What is this barge thing for you personally– a business, a hobby, a source of income?Right now it tends to be all rolled into one.Peipsi-Emajõgi barge is a unique ship with anextraordinary appearance that helps to promoteand introduce the region, and to set itapart from others. In that sense, the bargerides are not a big business, but in spite of thewinter break in rides we still manage, andwith the help of sponsors we can set somethingaside for the self-financing of newpro jects. As a non-profit association we have amajor advantage compared to a company, becausewe do not have to make profit, but instead,we can use all the acquired income forinitiating new interesting attractions. A largepart of the profit is spent on the maintenanceof the ship – taking it to the shipyard in thewinter, tarring, inspections etc. All this equalsup to be quite expensive. We are trying to runthe barge thing so that it would be nice andinteresting for us as well. If it were only somethingcommercial, I would definitely get boredreally quickly.THE BARGE JÕMMU HAS ENLIVENEDTHE SUPPLY OF TOURISM SERVICESIN THE EMAJÕGI AND LAKE PEIPSIREGION.The ship that was completed in the year2006 is the only representative in the worldof the type of ship that used to be unique tothe region and very numerous. There usedto be more than 600 of those kinds of shipssailing around in that region.Archaic and modern technology has beencombined on board the ship. In contrast tothe old-fashioned building technology(pine wood, tar, flax products, hemp ropes)there are, among other things, mobile WiFiinternet, modern presentation technology,stand-alone electricity supply, economicalengine running on bio-diesel, navigationaltechnology etc. Jõmmu is equipped with aclay oven, bunk beds and berths. The bargeas an especially environmentally-friendly18November2008
TOP ESTONIAN ENTERPRISES 2008Nominees for the Tourism Innovator 2008Enterprise Main activity Established Sales 2007 Net profit 2007 Labour expenses 2007 Owners' equity 2007 Average number(mln EEK) (mln EEK) (mln EEK) (mln EEK) of employeesMTÜ EMAJÕE LODJASELTS ORGANISATION OF BARGE TRIPS, TRAINING 2004 0.85 0.30 - - 3STRAND AS HOTEL, ACCOMMODATION AND CATERING SERVICES 2001 61.95 -0.02 14.41 39.98 111DEMJANOV AS ACTIVITY OF THE RESTAURANTS 1996 22.98 -1.80 5.44 6 561 EUR = 15.6466 EEK; 1 EEK = 0.0639 EUR; based on 2007 data See also www.konkurents.eeStrand ASAS Strand owns one of the biggest hotels in Pärnu– Strand. As a result of a consistent activity andlarge investments, a modern spa and conferencehotel has been built, which offers four-star levelcomforts to business travellers, conferencetourists and holidaymakers. The goal of the companyhas been to create an environment thatwould attract customers not only during theshort summer season, but also during the winterseason, which is otherwise very quiet in Pärnu.The biggest achievement of the year 2007, whichthey used to get a nomination in the category ofTourism Innovator, is the start of a separate airservice between Stockholm and Pärnu, with thegoal of bringing new spa tourists directly toPärnu. Especially significant about this achievementis the fact that three of the biggest spa hotelsin Pärnu supported the idea in the interest oftheir common goal – in addition to Strand, Tervisand Tervise Paradiis as well. The first seasonwas successful for the airline; and the initiatorsare inviting other interested companies of thesummer capital to take part in the project.The turnover of AS Strand in the year 2007 was62 million kroons, the company employs 111people.Demjanov ASAS Demjanov is responsible for the running ofthe restaurants Gloria and Egoist, Gloria WineCellar the Guesthouse. The company considersits goal to be the developing of a new Estoniancuisine, and combining it with the Nordic andEuropean food culture. The company itself preparesall the food it serves, preferring to usemostly domestic and organic raw material. Traditionalfood preparation methods are combinedwith the most modern technology.As a service enterprise the focus lies constantlyon the improvement and perfection of the serviceprocess. The service includes the chef, thesommelier and the waiting staff who inform thecustomer about a dish’s compatibility with awine, the order of the served food and drinks;and the preparation methods and technologyof the dishes.The efforts of the company resulted in one ofits restaurants being chosen as one of the bestin the Nordic countries by a leading Britishfood magazine – no other Estonian catering establishmentor restaurant has reached that levelbefore. AS Demjanov restaurants have repeatedlybeen awarded in local competitions aswell. The company is involved in educatingother enterprises and people on the market byorganizing visits by internationally recognizedguest chefs and organizing international cookingcompetitions. The CEO and owner of thecompany, Dmitri Demjanov, is known as a proponentof the Estonian innovative cuisine bothin Estonia and in several foreign countries.The turnover of AS Demjanov in the year 2007was ca 23 million kroons, the company employed56 people.vessel has been given its very own individualblue flag.Several different services and events are connectedto the barge and the small barge yard.Among these are, for example, the trips of thecinema and theatre barge and several concertsand theatre performances in the bargeyard. Or the services “Cargo hold seminar” ora meeting during a barge ride and “The littleman’s barge package“ or a barge ride meantfor children where they are taught about sailingand taught to use old-fashioned woodcarvingand blacksmith tools.When in 2006 there were 3000 passengerson the barge, then last year there were 5000and this year over 6000.The ship was 100% handmade in a smallbarge yard. Building it cost 1.3 millionkroons and more than 150 volunteers helpedout. The construction was financed with thehelp of the European Union programme, inaddition to funds of the city of Tartu andTele2; the state forest management centregave them the necessary wood material. Itwas initially planned to build a big barge yardwith the help of the EU support as well, butthe project was postponed to the significantincrease in construction prices.The Hanseatic barge Jõmmu has an especiallyround (wide and flat) hull. It is 12 metreslong and 7.5 metres wide, it weighs 23tonnes and it can carry up to 50 tonnes. Itsmast is 15 metres tall and it can reach thespeed of 7-10 knots.Barge trips are quite pricey. An hour costs2400 kroons, if you want to rent the bargefor an entire week you have to pay 49 000kroons. The prices do not include valueadded tax. During larger events the barge hasdone round trips with a ticket of 50-75kroons as well.TOURISM INNOVATOREfficient companies are recognisedwhich have developed innovativeand high-quality tourism products,which are competitive among foreignas well as local tourists visitingEstonia.November 200819
Entrepreneurship Award 2008Innovator 2008VKG OIL ASThe VKG men finally foundthe Estonian NokiaThe Estonian Nokia is oil shale“, say theoil-shale chemists of Viru Keemia Grupp(VKG) that is operating in Kohtla-Järve. Nokidding.This year, VKG uses 1.8 million tonnes of oilshale. Looking at all the things the companycan make out of oil shale, there is no doubt –the long sought-after Estonian Nokia has finallybeen found. “It is said that Estonia is an innovativecountry, that a whole bunch of geniuseslive here,” says Jaanus Purga, the R&D Managerof VKG. “But only about five patents are issuedhere every year. And we got three of them lastyear. Not bad, as Mati Alaver would say!”What is so striking about the VKGmen?It is common knowledge that Eesti Energia usesoil shale to fuel the power plant in Narva sothat we would have electricity in our homes.For years, VKG has mostly been producing oilproducts out of oil shale, with a volume of over220 000 tonnes a year. Oil accounts for moreThe R&D Manager of VKG,Jaanus Purga, “It is said that Estonia isan innovative country, that a wholebunch of geniuses live here.”PHOTO: TOOMAS TUUL20November 2008
TOP ESTONIAN ENTERPRISES 2008than a half of the company’s 1.8 billion kroonturnover, and it is mostly exported. Consideringthe rally of energy prices on the global market,the business continues to be profitable andstabile. Despite the rapidly rising fuel pricesgoing slightly down recently, the “energy currency”USD keeps getting stronger.So, Purga has to admit that when people inTallinn are complaining about the economybeing stagnant, but people in Kohtla-Järve donot know anything about it. Instead, a brandnew oil plant that is one of the most modern inthe world is being built near VKG, and morethan a billion kroons will be invested in it. Theplant has to start operating already next year,increasing the company’s oil production by athird.Purga, “We have amended the plant’s technologyto such an extent that we do not know howit will even work. In spring 2009 we will just behoping for the best!!”It is not a piece of news anymore that the oilindustry’s by-products are, to a small extent, bitumen,coke and pitch. That is no news eitherthat the subsidiaries of VKG produce and sellheat, power and gas, supplying the industryand population of Kohtla-Järve with them. Areal innovation in the group was initiated lastyear, when they started producing chemicals ofhigh purity. The technology for producing themwas born in VKG’s Research and DevelopmentDepartment, its main author was Anatoli Tsepelevits.When the price of a tonne of oil is approximately7000 kroons on the market at the moment,then a tonne of these chemicals can easilysell for more than half a million. Since last autumn,VKG produces and sells 2-Methylresorcinolto the world’s cosmetic and tanningsubstance industries. However, this happens insmall quantities: when last year and this yearthe company managed to produce only up toten tonnes, then next year the production willbe expanded to 30 tonnes. Purga says that even500 kilograms is a considerable amount on thismarket, because the global demand for2-Methylresorcinol is less than 100 tonnes ayear. “More than 30 tonnes would already be asuper result for us!”Oil shale phenols Made in Kohtla-Järve havethus far been sold toward three directions: toIndia, where they will be used in brown hairdyes, and to the USA and Great Britain, wherethey are used for tanning hides. VKG used toproduce resin for the Soviet tyre industry forseveral decades. But then the times changedand the old quality was not good enough anymorefor the Western market. Now the companywants to add even more value to oil shale,trying to get a foot through the door of theglobal tyre industry. In order to achieve this, thecompany has for years been flirting with theworld’s biggest resorcinol and tyre resins producer,the US company Indspec Chemical Corporation,whose customers include the fivebiggest tyre manufacturers starting withGoodyear and Michelin. Purga says that theyhave tried to convince Indspec that it would bemore affordable to produce resin in Estoniawith the help of VKG, for the European andAsian markets. When at the beginning, theAmericans would politely show the Estoniansthe door after this suggestion, then as time wentby, they have started to see that it is a good idea.Moreover so because the resins produced basedon Estonian raw materials turned out to have avery competitive quality.“On the one hand, those buggers themselvestook the patent for the resins of our raw material.On the other hand, it is good that in cooperationwith them, we can get our footthrough the door of the global tyre industry.Now we can manufacture the tyre resins for Europeand Asia here, using the raw material ofour oil shale, based on the recipe of Americans.Could there be any better cross-border co-operation?”Purga asks.Processing oil shale means that more than halfof it is left as ashes and half coke, and scientistshave been wondering for a long time how touse that residue effectively. The ashes are storedin mountains, but the men at VKG are smarter– they want to build a 2.5 billion kroon cementfactory by the year 2011. “We researched differentpossibilities for making both mixturesand blocks, but the only material that can beproduced out of half coke and oil shale ashesin large quantities in accordance with Europeandemands turned out to be cement,” Purga says.At the moment, the world’s top three suppliersof cement producing technology are dealingwith the realization of VKG’s ambitions. And itis not an easy task, even if it sounds like one,because the oil shale by-product has to bemixed with other substances in order for it topetrify.The plans of VKG do not stop there. They haveone more ambitious idea – to start producingdiesel fuel that would be of good enough qualityto use in cars. A large part of shale oils producedin Estonia are suitable for refining fuel,the only thing that needs a finishing touch isthe necessary technology, and that is being industriouslyresearched at the moment. “In sixyears we could be producing 350 000 tonnesof diesel fuel, which would almost cover theneed of entire Estonia,” Purga declares. “Whenthey say that the Estonian export potential istilted, then be my guest: a cement factorywould give an additional billion kroons worthof export turnover and an oil refinery wouldbalance the export and import of diesel fuel tozero!”Nominees for the Innovator 2008Enterprise Main activity Sales 2007 Net profit 2007 Labour expenses 2007 Owners' equity 2007 Average number(mln EEK) (mln EEK) (mln EEK) (mln EEK) of employeesVKG OIL AS THERMAL TREATMENT OF OIL SHALE 1461.88 329.39 106.77 1,727.26 597CYBERNETICA AS HARDWARE AND SOFTWARE DEVELOPMENT; PRODUCTION AND SALE OF INFORMATION SYSTEMS 92.66 16.22 31.19 24.36 94WEBMEDIA AS ELABORATION AND DEVELOPMENT OF SOFTWARE PACKAGES 135 22.09 64.77 53 1681 EUR = 15.6466 EEK; 1 EEK = 0.0639 EUR; based on 2007 data See also www.konkurents.eeNovember 200821
TOP ESTONIAN ENTERPRISES 2008Webmedia ASWebmedia is a company based on Estoniancapital that was founded in Tartu in the year2000. Even though initially, the company’smain line of business was chosen to be web design,it was changed into software developmentalready in the second half of the year 2000, becauseit seemed more attractive and profitable.At the end of 2004, Webmedia expanded intoTallinn; in 2005 its business started in Lithuania,Finland and Denmark; and additionally,there are development centres in Romania andSerbia. Among the customers of the companyare besides several Estonian, Lithuanian andSerbian governmental institutions also thebiggest Estonian, Finnish and Swedish telecommunicationscompanies, banks and medical institutions.Webmedia is co-operating intenselywith BEA Systems (licensing mediation andmaintenance, trainings), CA Wily Technologies(licensing mediation and maintenance, trainings,Performance Management consultations),Microsoft Eesti (Webmedia is MS Gold CertifiedPartner), ILOG (JRules business rulesmaintenance, licensing mediation and maintenance,trainings) and with Oracle (licensingmediation, trainings). During the last fouryears, the company’s turnover has grown ca60% per year on average, reaching 135 millionkroons in the year 2007.For the Innovator 2008 competition, Webmediasubmitted its product, which is aimed atmaking the work of Java programmers more effective.It is an improvement to the Java programminglanguage, which shortens thewaiting time in a programmer’s work. A programmerwould normally write codes blindlyand check them later, and the waiting time tosee the results can be ca 2-3 minutes. WithJavaRebel the deploy takes 1-2 seconds. Thecompany started using JavaRebel in March2007 and starting from August 2007 the softwareis used in all of Webmedia’s software developmentprojects. JavaRebel as an inventionand its consistent marketing in the world (USA,India and Europe) have certainly helped to improvethe reputation of Estonia as an innovativeand front-rank e-country; and the licensesales have increased and diversified Estonianexport.Cybernetica ASCybernetica is an internationally evaluated privateresearch and development company whichwas originally founded in 1997 by joining theresearch and development departments of theCybernetics Institute of the Estonian Academyof Sciences and Arvutustehnika Erikonstruee -rimisbüroo (Computer R&D Division) - EKTA.The goal of Cybernetica is to offer advancedand modern technological tailored solutions(from start to finish) in the fields of informationsecurity, software development and visualnavigation systems. The turnover of the companyin the year 2007 was ca 93 millionkroons, the net profit amounted to more than16 million kroons.AS Cybernetica competed for the EntrepreneurshipAward in the category of Innovatorwith one of their products, the range lightE8554, which has the highest intensity lightbeam among its kind in the world. It consists ofa high power LED matrix with individuallenses, a power supply unit and a flasher (acontroller that makes the light blink). The constructionof the product enables to create powerfulsources of modular light signals that couldbe implemented in marine navigation – inlighthouses and sea marks.The lens of the omnidirectional lantern E8275can collect the maximum amount of light fromthe LED-s and project them in the required verticalangle of the navigation implement.The sea mark light E8921, specifically createdfor the use of the Norwegian Coastal Administration,illuminates the sea mark’s informationsurface using only 2W of power.LED indicator panel E5813 is a safety indicatorfor port cranes and container spreaders that letsthe crane operator know about the status of thecontainer’s lifting automatics. By now, the productis being used by most of the world’s containercrane manufacturers; more than 99% ofthe production is exported.The ice buoy lantern E8291 tries to withstandthe wintry forces of nature that have so far ope -rated victoriously at sea; and it achieves it byhousing LED based light sources directly in theinnovative streamlined body (it is customary touse protective cupolas and bars that limit thespreading light and radio signals and whichoften turn out to be insufficient). The firstbatches of the product were sold in 2007, internationalmarketing started in the year 2008.INNOVATORThose enterprises are recognisedwhich have achieved economic successwith the help of outstanding innovationsin order to motivate theEstonian entrepreneurs to initiate,support and perform innovative activitiesin their enterprises.22November2008
Entrepreneurship Award 2008Exporter 2008ECOMETAL ASMore than a million batteriesa year are recycled in SillamäeOperating in Ida-Virumaa, Ecometal willcollect 20 000 tonnes of old batteriesfrom the surrounding region this year and produce12 000 of lead from them.The company Ecometal that was founded fiveyears ago would be a great example in anywaste management book, giving the term “recycling”a deep meaning. Old batteries that aredangerous to the environment are recycled upto 90% with the help of Ecometal. The company’smain products are soft lead and lead alloys,of which almost all is sold back to theEuropean battery industry as “gold ingots” fromthe factory in Sillamäe. The business is stabileand because the price of lead has made a greatjump in the global markets in recent years, themen in Sillamäe have plenty to be satisfiedwith.Tõnis Kaasik, Chairman of the Board and oneof the owners of Ecometal says that the idea tostart recycling batteries in Estonia was bornabout ten years ago already. But because thecompany had to get an integrated environmentalpermit – and Ecometal was one of the firstnew productions to get that permit in Estonia –it took years to get the factory running. “I havebeen involved with environmental protectionall my life and waste management is a risingtrend,” Kaasik says. „As waste collection wasfully operational here and old batteries werebeing transported from Latvia and Lithuaniathrough Estonia to factories in Spain and GreatBritain, we thought that why ship them that far,when they could be recycled in Estonia instead.”Indisputably the region’s most modern andmost environmentally-friendly battery recyclingfactory is located in Sillamäe, in the buildingsthat used to belong to Silmet. This location wasPHOTO: TOOMAS TUULChairman of the Board of Ecometal,Tõnis Kaasik says that the company isplanning to give more added value totheir products. Instead of selling lead asingots, it can be used for producingkeels for yachts or thin sheets of lead forx-rays instead. Lead can also be used forproducing tin roofs, cables etc.November 200823
TOP ESTONIAN ENTERPRISES 2008chosen because of the fitting infrastructure andindustrially-oriented people. Altogether 20 000tonnes of batteries will reach Sillamäe this yearthrough scrap metal collection networks.A lion’s share of these comes from Finland andLatvia. Those countries do not have factorieslike that. Ecometal also recycles all Estonian oldbatteries, collecting them from waste managementcompanies, car repair ships and even privatepersons. Estonian batteries account for afifth of the company’s recycling capacity.example, end up here. For instance, one of thebiggest computer companies in Hungary sendsits old batteries to Sillamäe.The 12 000 tonnes of lead and lead alloys, and1000 tonnes of polypropylene or the cover materialof batteries that are the end result of recycling,Ecometal mostly resells to theEuropean battery industry. A part of lead, forinstance, goes to a Polish battery producer,Jenox.notes. Even though this year, the price for thismetal has fallen two times, the companies arewilling to pay a price high enough for makingthe business of battery recycling profitable.What is produced in Estonia is an addition tothe so-called secondary global market of lead,which accounts for more than 60% of the entireglobal lead production. In most Western Europeancountries and in the USA, used car batteriesare collected and more than 90% of themare recycled.Kaasik says that it would be possible to bringbatteries from Lithuania as well to Estonia, butfor some reason, the Lithuanians are allowed touse the “axe method” dating from the last centuryto solve the issue of old batteries – theysimply saw through the old batteries with acidsplashing everywhere! “Of course, this kind ofsituation cannot be sensible: that there is a singleEuropean Union, but that there are differentdemands – in one country, the investment is afactory, and in another a saw, and they have tocompete with one another,” Kaasik says.About a half of Finnish battery scraps reachesthe Ecometal factory; the Finnish sell the restto Germany for recycling. Last year, Ecometalstarted to buy batteries from Sweden as well,even though there already is a big recycling factorythere. Not only car batteries, but also computerbatteries and phone batteries, forBoth the electrolyte and the plastic are used.The insulation layers made of the different materialsof the batteries have a high calorific valueand reach the furnaces of Kunda cement factoryas alternative fuel. Ecometal is currently allowedto dump sodium sulphate watersolutions in the sea, but the company wouldlike to start using that compound in the futureas well. Currently, a 40 million kroon expansionto the factory is being built, where at theend of the year they could start crystallizingsodium sulphate and sell it to the paper-, textile-and household chemicals industry. A smallpart of the slag that contains lead, which comesfrom the smelters, is deposited underground ina landfill for dangerous waste in Vaivara.“We were lucky to get on board the train of risingglobal lead prices in the year 2003,” KaasikAccording to Kaasik, the company is planningto give more added value to their products. Insteadof selling lead as ingots, it can be used forproducing keels for yachts or thin sheets of leadfor x-rays instead. Lead can also be used forproducing tin roofs, cables etc.An old battery is at the same time a dangerouswaste product and a marketable commoditywhich is worth a lot of money. That is why theyare not dumped by a side of a forest anymore.In some places, there is a very active black marketfor batteries as well. For instance, batteriesare transported from South Estonia into Latvia,where the state subsidizes their collection. ”Latviangypsies go to rubbish tips by minivans tobuy batteries, paying a higher price thanks tothe subsidies. In the end, those batteries reachus anyway,” Kaasik says.Nominees for the Exporter 2008Enterprise Main activity Sales 2007 Export sales 2007 Increase in export sales Net profit 2007 Average number Added value(mln EEK) (mln EEK) 2007 compared to 2006 (%) (mln EEK) of employees per employee (th EEK)NORMA AS PREPARATION AND SALE OF SECURITY SYSTEMS 1,263.94 1,250 19 105.9 972 378AND DETAILS FOR CARSTERG AS MANUFACTURE OF METAL STRUCTURES 57.05 38.249 40 1.455 14 507ECOMETAL AS RECYCLING OF LEAD-PLATE BATTERIES 314.52 311 80 122 52 27111 EUR = 15.6466 EEK; 1 EEK = 0.0639 EUR; based on 2007 data See also www.konkurents.eeEXPORTERThose enterprises are recognisedwhose export turnover, growth inexport turnover and value addedper one employee was the greatestin 2007, who have made a contributionto the development of productsand who use an approvedquality management system.Ecometal’s buying of old batteries(Portion of old batteries’ purchase turnover in 2007)Finland 34%Latvia 32%Estonia 18%Lithuania 14%Sweden 2%Ecometal’s export markets(Portion of production’s sales turnover in 2007)Germany 44%Italy 11%Sweden 6%Poland 19%England 14%Finland 4%Estonia 1%Latvia 1%24November2008
TOP ESTONIAN ENTERPRISES 2008Norma ASAS Norma was founded in 1891 in Paldiski as atin working company. Until 1973, Norma’smain product groups were tin products alongwith consumer goods and toys. Starting from1973, the company has focused on producing,selling and developing safety equipment componentsand safety systems for cars. Norma-Osvar ZAO (Russia) belongs to the group, andits main line of business is the distribution of ASNorma’s goods and services, warehousing andbeing involved with customs’ procedures.In addition to manufacturing and distributingsafety systems for cars, the current Norma isgradually becoming a considerable manufacturerof safety equipment components for theinternational automotive industry. The companyprovides engineering services on the design andadaptation of safety systems for cars and safetybelt components. In 2007, the sale of safety systemsfor cars was added to the turnover.The turnover of the group in the year 2007 was1.2 billion kroons; and the net profit amountedto 106 million kroons. Compared to the year2006 the production volumes increased by12%. In the year 2007, Norma exported 98.9%of its production, the increase in export was18% compared to the previous year. The mostimportant export markets are Sweden (39% ofthe turnover), Russia (53%) and Germany (3%).The increase in the sales of safety equipment toRussia and the Ukraine in the year 2008 was72%.From the year 1999, Norma belongs to the internationalgroup Autoliv, which owns 51% ofAS Norma’s shares. The company’s shares havebeen quoted on the primary list of the TallinnStock Exchange since 1997; its shares are alsotraded with on the Frankfurt, Berlin and Munichstock exchanges. According to the most recentdata, the group employs 998 people. Theadded value per employee is 378 159 kroons.AS Norma has been certified with the automotivequality management standard ISO/TS16949:2002 and the environmental managementsystem standard ISO 14001:2004. In theyear 2007, the company was awarded the title ofan exemplary supplier by AVTOVAZ.Terg ASOÜ Terg was founded in the year 1991. Thecompany’s main fields of business are the prefabricationand installation of steel construction;cleaning of steel materials and steelproducts on a shot cleaning line; cutting steelprofiles on band saw. The average number ofemployees dropped to 19 in the year 2006. Inthe company, the added value per employee is507 862 kroons. The sales revenue has beenfluctuating somewhat in recent years, but it increasedsignificantly in 2005 and maintainedthat level during the next period of 2006. In theyear 2007, the company’s turnover was 57 049509 kroons, of which export accounted for90%. Steel constructions have been sold to Finland,Sweden, Norway, France, Germany, Belgium,Italy, Latvia and elsewhere. In recentyears the company has been profitable, the netprofit of the year 2007 was ca 1.4 millionkroons. The company is based on Estonian privatecapital.
Entrepreneurship Award 2008Manufacturing Enterprise 2008FAVOR AS“20 keys” brings success to FavorEstonia’s largest thin sheet metalworkingcompany Favor is ahead of its competitorsby affordable prices and flexibility, but oneof the success factors for the company is usingthe quality improvement methodology “20keys”.The company operating in Maardu has grownrapidly in recent years – in four years, theturnover has almost trebled, reaching nearly400 million kroons this year. Favor is a strongexporter, as nearly 48% of the output is exported.Last year, a new factory was openedthat cost 63 million kroons.One of the special traits of the company is thatwhen in the Estonian economy in general peopleare trying to ascribe a negative and disapprovingmeaning to the term “outsourcing”,then Favor is not ashamed it. Favor is a serviceenterprise who offers its customers the outsourcedservices of cutting thin sheet metal andproducing thin sheet metal components and assemblies.The company also produces differentbuilding profiles and sells suspended ceilings.Aivar Kärmas, the Chairman of the Board ofFavor says that outsourcing the production of amore complicated construction or detail offersa far greater profitability than being on the marketwith your own product. “The volume effectand specializing give the possibility to producewith less waste, and the companies who submitlarge orders guarantee a stabile product developmentand a market ten times as big ascould be achieved by producing the end-producton our own,” Kärmas says. Besides, thereare not enough skilled workers in the Estonianprocessing industry to produce and assembleall the parts of a complicated and innovativeproduct, according to Kärmas.Flexibility and affordable prices have helpedAivar Kärmas, the CEO of Favor:”The successfulness of “20 keys” is basedon a complete approach to managing acompany. Different units of the companysupport each other and the synergy that iscreated from that influence helps the companyto quickly reach a new level indevelopment”PHOTO: TOOMAS TUUL26November 2008
TOP ESTONIAN ENTERPRISES 2008Favor gain success next to larger competitors.This in turn is achieved by good co-operationwith both customers and suppliers. Favor purchases30% of its raw material from its “neighbour”,ArcelorMittal Tallinn (formerly knownas Galvex). Favor has several well-known customerswhom they supply with sheet metalcomponents and assemblies. Among these are,for instance, ABB, who uses these in its automaticsand energetics’ products and Carrier refrigerationequipment, and Radio FrequencySystems, who are also supplied with aluminiumcomponents and assemblies of the telecommunicationsfield, including mobile network antennas,for instance.In addition to flexibility, the company’s workeffectiveness has risen with the implementationof the “20 keys” methodology as if by magic.This methodology was developed by a Japaneseprofessor, Iwao Kobayashi, and companiesall over the world re using it to systematicallywork themselves up, increase the chances ofsurvival and make their development faster.Using the “20 keys” methodology, Favor is constantlycomparing itself to its competitors andcontrasts the productivity and effectiveness ofdifferent units’ work. In addition to that, thecompany recognizes good achievements andsets challenging goals to its employees andteams. Favor’s principles also include the systematicdevelopment of the skills of the company’sapproximately 180 employees, andraising their qualifications and salary based onthe indicators of effectiveness. It is consideredimportant that every Favor employee knowswhat is expected of them.”The successfulness of “20 keys” is based on acomplete approach to managing a company.Different units of the company support eachother and the synergy that is created from thatinfluence helps the company to quickly reach anew level in development,” Kärmas says. Inessence, “20 keys” means keeping the “back office”of production pedantically in order, keepingthe production economical and fine-tuned,and keeping the staff well-motivated. Nothinghappens just because, no resources are wastedanywhere, the development never stops. Favorhas invested in effective production and the resultscan already be seen: the employees’ addedvalue has more than doubled in the companyduring the past four years!Kärmas says that in the business of outsourcing,the trump-card of a company can only beflexibility, which means producing in smallquantities and in a short period of time.“We consider the shortening of transition periodsfrom one product to another very important,”Kärmas says. Favor is trying to achievethis with carefully planning the benches’ workand production programme in advance and optimizingthe benches’ work the maximum. “Ofcourse, with every kind of automatization aswell, to free the employee of tasks that are monotonous,physically difficult or dangerous,”Kärmas adds.Favor’s four metalworking divisions• CutCenterServices for cutting sheet steel coils to lengthand slitting them, and selling sheet steel.The customers are industrial enterpriseswho require a partner that takes their needsinto account when supplying raw materialsand who can provide them with completesolutions regarding sheet steel. In the year2007, Favor processed 19 000 tonnes ofsheet metal and exported a significant partof it to Latvia, Lithuania, Finland and Sweden.Regarding this line of business, thecompany’s market share in Estonia is 60%.• MetaformProduction services of thin sheet metalworking,components and assemblies.These services are mainly meant for export,the customers being the producers of refrigeratingand electric equipment in Germany,the Netherlands, Great Britain, Sweden,Finland and Hungary.• ProfilineProducing a variety of building profilesusing the roll-forming technology. Therange of products includes lightweight battens,lightweight frames for interior buildingand metal suspended ceiling systems.The Profiline products are known across theentire building market of the Baltic countriesfor reliability and stabile high quality.Favor’s market share in this line of businessis 65-70% in Estonia and 15-20% in Latvia.• LaekeskusA professional sales centre specialized insuspended ceiling products targeted at businesscustomers. The product range includesall types of suspended ceilings from differentglobal producers, and in addition tothat, the company offers an installation serviceand technical support for the suspendedceilings. Laekeskus has more than fifty partnersamong construction materials shops inEstonia and the company’s market share inthat line of business is 22% in Estonia.Nominees for the Manufacturing Enterprise 2008Enterprise Main activity Sales 2007 Change in sales 2007 Net profit 2007 Investment to fixed assets Average number Added value(mln EEK) compared to 2006 (%) (mln EEK) (mln EEK) of employees per employee (th EEK)VKG OIL THERMAL TREATMENT OF OIL SHALE, MAIN PRODUCTS: 1,461.88 36 329.32 716.18 597 818.8DIFFERENT FUEL OILS, PETROLEUM COKE AND PITCH,SUMMARISED OIL SHALE PHENOLS, ANTISEPTIC TIMBERIMPREGNATION OILS AND OIL SHALE BITUMENFAVOR AS MANUFACTURE OF LEAF METAL PRODUCTS 309.86 23 65.67 15.14 165 703.3ECOMETAL AS RECYCLING OF LEAD-PLATE BATTERIES 314.52 120 122.58 2.04 53 2,710.0HARJU ELEKTER MANUFACTURE OF SUBSTATIONS, DISTRIBUTOR BOXES, 269.84 45 21.5 8.93 175 456.6ELEKTROTEHNIKA AS SWITCHBOARDS, CONTROL ENGINEERING AND CONTROLPANELS AND LEAF METAL PRODUCTS INSURANCE1 EUR = 15.6466 EEK; 1 EEK = 0.0639 EUR; based on 2007 data See also www.konkurents.eeNovember 200827
TOP ESTONIAN ENTERPRISES 2008Harju Elekter Elektrotehnika ASThe history of the company starts in 1968when it started producing electrical equipmentas a part of Harju KEK. Ever since the year2005 it continues operations as Harju Elekter100% subsidiary. AS Harju Elekter Elektrotehnikadesigns, manufactures and marketselectrical products to the power supply sector(substations, distribution panels), to the industrialsector (automation and control systems);and to the construction sector (distribution andcontrol switchboards). In addition, the companyoffers a large number of different sheetmetal products. The company is one of theleading manufacturers of MV/LV systems in theBaltic states. Great emphasis is put on productdevelopment; there is active co-operation withuniversities and vocational educational institutions.More than 40% of the production is exported,the main export markets being Finland,Latvia, Lithuania, Sweden, Greece and Russia.In the year 2007, the company’s turnover wasalmost 270 million kroons and its profit was 21million kroons. The company employs 175people. AS Harju Elekter Elektrotehnika has theISO9001:2000 certificate for quality managementand the ISO14001:2004 certificate for environmentalmanagement.MANUFACTURINGENTERPRISEAn Estonian enterprise engaging inindustrial production is recognised(EMTAK division C) which had thefastest growth in turnover in 2007,whose value added created and investmentsin product developmentand in the development of newtechnologies were the greatest.VKG Oil ASVKG Oil AS was also a nominee for Innovator2008 and was declared the winner of thatcategory. Read more about the company onpage 20Ecometal ASEcometal AS was also a nominee for Exporter2008 and was declared the winner of thatcategory. Read more about the company onpage 2328November 2008
Entrepreneurship Award 2008Developer of the Year 2008TIP TIP TAP OÜEstonian playgrounds sellin Finland and SwedenPHOTO: TOOMAS TUULThe executive manager of Tip Tip Tap,Rasmus Varunov: “Our market dependson how a government or a city sets its priorities– whether it directs money intochildren’s development or not. In Estonia,there has been a huge leap for the betterin that issue, but in Latvia and Lithuaniait is all yet to happen. Cities are differentas well – Tallinn is truly active, but Tartuorders perhaps only a tenth of what thecapital city does.”November 200829
TOP ESTONIAN ENTERPRISES 2008The biggest manufacturer of playgroundsin Estonia, Tip Tip Tap, is trying to enterFinnish, Swedish, Norwegian and Ukrainianmarkets. The company that operates in Luigenear Tallinn is growing very rapidly. Last year,the turnover grew four times – from 4.5 millionto 19.5 million kroons. This year, it is estimatedto be close to 30 million kroons.The Estonian market, where Tip Tip Tap hassold more than a thousand playgrounds mainlythrough state and municipal procurements, isobviously becoming too small for the company.The executive manager of Tip Tip Tap, RasmusVarunov, who created the company because hecould not find a playground for his child’shome garden from the Estonian market, considersthe three most important factors in thebusiness success of the company to be: the highquality of the products, attractive design andproduct development and emphasis in the salesnetwork. “Behind our success definitely standsour immense dedication to our objective to bebetter every year and to become the biggestplayground producer and seller in Scandinavia,”he says.In order for a playground or a playground attractionto have top quality, the best materialsmust be used. Almost all of the materials (includingplastic, metal and plywood) are purchasedoutside of Estonia; only the laminatedtimber comes from the local Stora Enso factory.Products meant for children have a largeamount of safety requirements. After threeyears and half a million kroons, the companyhas earned an international quality certificatethat no other company in the Baltic States inthat line of business possesses.According to Varunov, Tip Tip Tap uses similarkinds of materials to other competitors all overthe world, but they are trying to put emphasison design to their advantage. “Children’s playgroundsshould be colourful, because toys inshops are also mostly yellow, red or blue, sometimesorange, pink or spiderman-coloured.Small children sense brighter colours best. Agreen playground set in the middle of green naturedoesn’t invite them to play,” Varunov says.Hilda Ostonen who used to work in Standardwith children’s furniture is responsible for thedesign of all kinds of climbing ladders, slides,swings, sand boxes, playhouses etc found inthe product catalogue of the company. She testsseveral ideas at their earliest stages on hergrandchildren.The product catalogue of Tip Tip Tap includesmore than 80 different products, 25 more willbe added by the next season. In the cataloguethere are, for example, more than ten differentslides or play villages, a large number of climbingladders, swings, spring swings, playhousesand much more. The products have interestingnames, for instance a tube Rebaseurg (Foxden), Juustusein (Cheese wall), climbing laddersPilveke (Little cloud), Ämblikutele (Forspiders) and Vikerkaar (Rainbow), springswings Urr, Tibu (Chick) and Maanteemuhk(Road bump), playhouses Tsuhh Tsuhh (Choochoo)and Õunake Põõsaga (A little apple witha bush) etc. As far as other products are concerned,Tip Tip Tap also produces parkbenches, hang bars, bicycle holders and eventrash bins, for example.During recent years, the company has been involvedwith the construction of its sales network.All of Estonia is covered by five salesrepresentatives, and the company is planningto establish subsidiary companies in Latvia andLithuania. Sales in Finland and Sweden filterthrough partners and the company plans tostart operating in Norway as well. The companyhas a sales representative in the Ukraineas well, but they have not managed to sell anyproducts there. The cost of one playground canbe tens of thousands of kroons, and the governmentalstructures in the Ukraine are probablytoo poor to purchase any at the moment.In Finland, Tip Tip Tap products are bought byapartment associations, daycares, rural muni -cipalities and even some churches. “Our marketdepends on how a government or a city setsits priorities – whether it directs money intochildren’s development or not. In Estonia, therehas been a huge leap for the better in that issue,but in Latvia and Lithuania it is all yet to happen.Cities are different as well – Tallinn is trulyactive, but Tartu orders perhaps only a tenth ofwhat the capital city does,” Varunov says. Afifth of the turnover of Tip Tip Tap comes fromthe maintenance of 200 playgrounds in Tallinn,regarding which the company has a multi-annualcontract with Tallinn Environment Department.There are altogether 600playgrounds in the capital city.LABYROOM– the innovation of playgroundsPlaygrounds can be of good qualityand attractive for children, but theycan also be innovative. In co-operationwith partners, Tip Tip Tap producesand sells a 3-D play-worldcalled Labyroom, in which childrencan climb as if in a labyrinth.The product consists of blocks thesize of one cubic metre, which canbe assembled like Lego, buildinghouses, castles, caves etc from them.It is also possible to relocate thecubes so that every time somethingnew will be created. The child willgo in through one hole and comeout the other. Because Labyroom isproduced using the same materialsas slides, it suits perfectly for theoutdoors.30November2008
TOP ESTONIAN ENTERPRISES 2008Nominees for the Developer of the Year 2008Enterprise Main activity Estbalished Sales Sales Change in sales 2007 Net profit Net profit Cange in net profit Average number Average number2006 2007 compared to 2006 2006 2007 2007 compared of employees of employees(mln EEK) (mln EEK) (%) (mln EEK) (mln EEK) to 2006 (%) 2006 2007TIPTIPTAP OÜ DESIGN, MANUFACTURE, 2004 12.38 19.59 58 1.30 2.28 75 11 19INSTALLATION OF CHILDREN’S PLAYGROUNDSEVELAIN KÖÖK OÜ CATERING, CULINARY PREPARATIONS 2004 1.31 5.20 297 0.08 0.55 571 8 10ROMEC METALL OÜ MANUFACTURE OF STAINLESS 2004 4.37 8.88 103 0.88 0.34 -62 11 13METAL STRUCTURES AND PARTS THEREOF1 EUR = 15.6466 EEK; 1 EEK = 0.0639 EUR; based on 2007 data See also www.konkurents.eeRomec Metall OÜRomec Metall was founded in the year 2004.The company’s main field of business is producingstainless steel pipelines and equipmentand their assembly; and the majority of orderscome from the food industry. The company isbased fully on Estonian capital and its mainbusiness location is Põltsamaa.The company considers last year to have beenthe year of proving themselves on the market;they managed to show both themselves andtheir customers that despite their relativelysmall amount of employees they can still manageto implement big projects. In addition todomestic customers, the company managed toexpand its business and implement projects inFinland as well. The company considers themost important event of the previous year tohave been the completion of a central washingstation they designed and produced. The companyalso considers the manufacturing and installationof washing stations to be animportant future line of business.In the year 2007, the turnover of OÜ RomecMetall was 8.82 million kroons (the growthcompared to the year 2006 was ca 50%), the netprofit was calculated to have been 0.4 millionkroons. The company employs 13 people.Evelain Köök OÜOÜ Evelain Köök was founded in Tartu in theyear 2004 as a catering service provider. Sincethe year 2006 the company has had its owncafé. The company considers its biggestachievement of the year 2007 to have been aco-operation agreement with the rapidly developingchain of Maxima stores, who will be providedwith prepared foods. It is above all thiscontract that is valid until 2010 which is responsiblefor raising the company’s turnover forthe year 2007 to 5.2 million kroons, which ismore than a threefold growth compared to theyear 2006. The net profit turned out to be 0.55million kroons.As its strengths, the company lists the qualityof the products, the mobility of the companyand its qualified staff. In 2007, the companyemployed 10 people.DEVELOPER OF THE YEARThis category recognises those enterpriseswhich have started theirbusiness activities lately and havedeveloped well, which are sustainable,grow fast and engage in activeproduct development. The thirdyear of activity is often critical in thedevelopment of an enterprise and acompany will mainly be accompaniedby more long-time success if ithas operated more than three years.Therefore it is the wish of the stateand the business organisations tohighlight those enterprises whichhave proven to develop and growfast during the first three years ofactivity and which can be regardedas sustainable. The selection of thewinner helps to highlight a newsmall-sized enterprise which hasmade the most successful entry intothe market.November 200831
TOP ESTONIAN ENTERPRISES 2008The History of the Entrepreneurship AwardContest of Foreign Investor1995Main prize: Eesti Telefon AS1996Main prize: Elcoteq Tallinn ASForeign Investor Who Has Introduced Estonia:Tolaram GruppExport Developer:Kunda Nordic Tsement ASJobs Creator: Loksa Laevaremonditehas ASLauncher Of Modern EnvironmentallyFriendly Technology: Ragn-Sells AS1997Main prize: Tolaram GruppExport Developer: Kreenholmi Valduse ASJobs Creator: Järvakandi Klaas ASProducts Quality Developer:Elcoteq Tallinn ASLargest Investment:Eesti Merelaevandus AS1998Main prize: Hansapank ASExport Developer: Tolaram GruppJobs Creator: Britannic Eesti ASProducts Quality Developer:Elcoteq Tallinn ASLargest Foreign Investment: Hansapank AS1999Main prize: Kunda Nordic Tsement ASExport Developer: HTM Sport Eesti OÜJobs Creator: Lindegaard Eesti ASLargest Investment: Eesti Telekom ASInnovator: JOT Eesti OÜExport Forum1997Main prize: Norma ASSmall and Medium-Sized Exporter:Viljandi Aken ja Uks ASExporter With Rapid Development:Balteco ASJobs Creator: Elcoteq Tallinn ASUser Of Domestic Raw Materials:Viisnurk AS1998Main prize: Kreenholmi Valduse ASSmall and Medium-Sized Exporter:Rõngu Tehas ASExporter With Rapid Development:Tarkon ASJobs Creator: Toom Tekstiil ASUser Of Domestic Raw Materials:Repo Vabrikud AS1999Main prize: Viisnurk ASSmall and Medium-Sized Exporter:Hansa Candle ASExporter With Rapid Development:Wendre ASJobs Creator: Repo Vabrikud ASEntrepreneurship Award2000Main prize: Viisnurk ASSmall and Medium-Sized Company:Mikskaar ASExporter: Silmet ASForeign Investor: JOT Eesti OÜTechnology Developer: JOT Eesti OÜTourism Innovator: Reval Hotelligrupi ASArea Developer: Viisnurk AS2001Main prize: Silmet ASSmall and Medium-Sized Company:Viljandi Liimpuit ASExporter: Silmet ASForeign Investor:“Horizon” Tselluloosi ja Paberi ASTechnology Developer: Silmet ASTourism Innovator:Ammende Villa Catering OÜArea Developer: Silmet AS2003*Main prize: BLRT Grupp ASSmall and Medium-Sized Company:Viking Window ASExporter: BLRT Grupp ASForeign Investor: Velsicol Eesti ASTechnology Developer:Curonia Research OÜTourism Innovator: Tallink Grupp ASArea Developer: Velsicol Eesti AS2004Main prize: Viljandi Metall ASLarge Exporter: Krimelte OÜSmall and Medium-Sized Exporter:Mountain Loghome OÜForeign Investor: Imavere Saeveski ASTechnology Developer: Aqris Software ASTourism Innovator (large company):Estonian Air ASTourism Innovator (small company):Pintmann Grupp OÜArea Developer: AS Viljandi Metall2005Main prize: Regio ASExporter: Polimoon ASForeign Investor: Elcoteq Tallinn ASTourism Innovator: Estravel ASArea Developer: Pühajärve Puhkekodu ASInnovator: Regio AS2006Main prize: Vertex Estonia ASInternationalizer: Regio ASForeign Investor: Enics Eesti ASTourism Innovator:Otepää Seikluspark OÜArea Developer: Põltsamaa Felix ASInnovator: Vertex Estonia ASDeveloper of the Year: Haka Plast OÜ2007Main prize: Tallink Grupp ASTourism Innovator:Otepää Seikluspark OÜInnovator: Elion Ettevõtted ASExporter: Krimelte OÜForeign Investor: ABB ASArea Developer: Viking Windows ASManufacturing Enterprise: VKG Oil ASDeveloper of the Year:Nova Haus Element OÜ* Since 2003, the contest has been named after the year when theprize is announced, not after one from which the operating results areevaluated.32November2008
TOP ESTONIAN ENTERPRISES 2008The History of the Estonian Companies’ Competitiveness Ranking2003The Most Competitive Enterprise:Eesti Energia ASThe Most Competitive Small Enterprise:Tallinna Laevatehas OÜThe Most Competitive Large TradingEnterprise: Kesko Food ASThe Most Competitive Small TradingEnterprise: Baltic Pulp & Paper OÜThe Most Competitive Large Industrialand Energy Enterprise: Eesti Energia ASThe Most Competitive Small Industrialand Energy Enterprise: Krimelte OÜThe Most Competitive ConstructionEnterprise: Merko Ehitus ASThe Most Competitive Transportation andCommunication Enterprise:Russian Estonian Rail Services ASThe Most Competitive Forestry andAgriculture Enterprise:Imavere Saeveski ASThe Most Competitive Large ServiceEnterprise: Hansapank ASThe Most Competitive Small ServiceEnterprise: Nordea Finance Estonia AS2004The Most Competitive Enterprise:Hansapank ASThe Most Competitive Trading Enterprise:Silberauto ASThe Most Competitive Medium-sizeTrading Enterprise:Kolomna Energy Service OÜThe Most Competitive Small TradingEnterprise: Agris Software ASThe Most Competitive Large Industrialand Energy Enterprise: BLRT Grupp ASThe Most Competitive Medium-sizedIndustrial and Energy Enterprise:maxit Estonia ASThe Most Competitive Small Industrialand Energy Enterprise: Örnplast Eesti ASThe Most Competitive Large andMedium-sized Construction Enterprise:Merko Ehitus ASThe Most Competitive Small ConstructionEnterprise: Peri ASThe Most Competitive Transportation,Logistics and Communication Enterprise:Russian Estonian Rail Services ASThe Most Competitive Forestry and AgricultureEnterprise: Ekseko ASThe Most Competitive Large and MediumsizedService Enterprise: Hansapank ASThe Most Competitive Small Service Enterprise:Riigiressursside Keskus OÜ2005The Most Competitive Enterprise:Hansapank ASThe Most Competitive Financial BrokerageEnterprise: Hansapank ASThe Most Competitive Retail Enterprise:Tallinna Kaubamaja ASThe Most Competitive WholesaleEnterprise: Silberauto ASThe Most Competitive Industrial andEnergy Enterprise: BLRT Grupp ASThe Most Competitive Food IndustryEnterprise: A. Le Coq Tartu Õlletehas ASThe Most Competitive ConstructionEnterprise: Merko Ehitus ASThe Most Competitive Communication,Transportation and Logistics Enterprise:EMT ASThe Most Competitive Forestry andAgricultural Enterprise: Ekseko ASThe Most Competitive Hotel andRestaurant Enterprise: Delegatsioon OÜThe Most Competitive Business Serviceand Real Estate Enterprise:Kodumajagrupi ASThe Most Competitive Service Enterprise:Kuusakoski ASNovember 200833
TOP ESTONIAN ENTERPRISES 2008The History of the Estonian Companies’ Competitiveness Ranking2006The Most Competitive Enterprise:Hansapank ASThe Most Competitive Financial BrokerageEnterprise: Hansapank ASThe Most Competitive Retail Enterprise:Tallinna Kaubamaja ASThe Most Competitive Wholesale Enterprise:Mažeikiu Nafta Trading House OÜThe Most Competitive Industrial andEnergy Enterprise: BLRT Grupp ASThe Most Competitive Food IndustryEnterprise: A. Le Coq Tartu Õlletehas ASThe Most Competitive ConstructionEnterprise: Merko Ehitus ASThe Most Competitive Communication,Transportation and Logistics Enterprise:Eesti Telekom ASThe Most Competitive Forestry andAgriculture Enterprise:Riigimetsa Majandamise KeskusThe Most Competitive Hotel and RestaurantEnterprise: Domina Management ASThe Most Competitive Business Serviceand Real Estate Enterprise: Falck Eesti ASThe Most Competitive Service Enterprise:Kuusakoski AS2007The Most Competitive Enterprise:Tallink Grupp ASThe Most Competitive Tourism Enterprise:Tallink Grupp ASThe Most Competitive Small and MediumsizedEnterprise: Betoonimeister ASThe Most Competitive Retail Enterprise:Catwees ASThe Most Competitive Wholesale Enterprise:Mažeikiu Nafta Trading House OÜThe Most Competitive Industrial andEnergy Enterprise: BLRT Grupp ASThe Most Competitive Food IndustryEnterprise: A. Le Coq ASThe Most Competitive ConstructionEnterprise: Merko Ehitus ASThe Most Competitive Communicationand IT-services Enterprise: EMT ASThe Most Competitive Forestry andAgriculture Enterprise: Ekseko ASThe Most Competitive Business Serviceand Real Estate Enterprise: Artig KV OÜThe Most Competitive Financial BrokerageEnterprise: Hansapank ASThe Most Competitive Service Enterprise:Tallinna Vesi ASThe Most Competitive Transportation andLogistics Enterprise: Tallinna Sadam AS34November2008
TOP ESTONIAN ENTERPRISES 2008Estonian Companies’ Competitiveness Ranking 2008PLACE2007PLACE2006PLACESALES CHANGE NET PROFIT CHANGE RETURN LABOUR COSTS EFFICIENCY PER INVESTMENTS % OFENTERPRISE IN SALES IN NET PROFIT ON EQUITY PER EMPLOYEE EMPLOYEE THE FIRST* group TH EEK PLACE % PLACE TH EEK PLACE % PLACE % PLACE EEK/month PLACE TH EEK PLACE TH EEK PLACE (0 .. 100)1 1 TALLINK GRUPP AS* TUH KR 1 188.0 26 1,049,287 2 70.6 312 10.9 349 33,151 34 1,912 144 2,206,000 1 100.0%2 3 2 MAZEIKIU NAFTA TRADING HOUSE OÜ 5,804,018 4 113.7 269 34,771 71 113.1 212 60.5 88 92,217 1 580,402 1 284 298 88.1%3 3 EESTI TELEKOM AS* 6,261,002 2 108.6 302 1,511,548 1 115.0 207 35.9 193 29,077 58 2,691 106 862,510 2 76.4%4 OMA EHITAJA AS* 576,027 51 199.4 18 43,037 57 677.5 9 128.1 15 79,327 2 9,600 19 1,095 230 67.5%5 VARMAPARTNER OÜ 22,645 288 265.4 9 3,237 236 3,404.7 5 187.3 2 19,223 187 11,322 15 2,482 176 63.1%6 9 EMT AS* 3,904,000 8 112.0 280 935,000 3 109.2 226 58.9 91 31,685 39 7,284 30 330,000 12 55.0%7 AF-ESTIVO AS 66,485 181 666.5 2 2,981 245 545.4 15 87.8 39 25,544 102 3,499 78 49 349 53.5%8 409 SETOMAA TURISMITALO OÜ 1,476 371 122.8 206 2,215 268 138,365.8 6 174.6 3 6,320 367 246 371 120 326 52.2%9 351 ESTOVER OÜ 318,000 72 120.0 228 25,000 84 12,500.0 2 124.3 16 13,225 292 6,913 34 2,700 169 50.9%10 K GRUPP TURVATEENUSED OÜ 33,779 251 154.4 64 4,525 206 1,070.3 4 128.1 14 8,290 355 184 372 12,042 91 49.3%11 6 4 MERKO EHITUS AS* 5,510,760 5 124.8 187 545,049 5 93.7 269 30.2 235 40,864 13 5,273 48 84,497 28 47.8%12 60 AR AGENTUURI AS 27,033 269 122.0 211 1,788 284 1,391.3 8 74.3 60 22,955 131 1,502 180 1,037 234 47.6%13 411 SPRATFIL AS 89,605 162 103.2 322 25,791 82 54,928.7 1 106.6 23 12,266 307 622 323 442 277 47.3%14 37 TARTU EHITUS AS 128,691 135 171.1 40 14,748 119 642.1 12 156.8 8 19,781 178 3,785 73 476 272 46.3%15 15 33 NORDECON AS* 3,779,188 9 149.9 81 392,371 10 113.7 210 40.0 165 37,529 20 3,292 82 413,583 9 46.0%16 62 FAVOR AS 309,867 74 122.9 204 65,672 43 674.3 10 130.3 12 20,843 158 1,878 148 15,136 79 44.9%17 35 5 BLRT GRUPP AS* 4,619,400 7 132.2 141 507,063 7 126.2 178 19.8 304 18,898 192 1,429 191 625,676 5 44.7%18 18 7 TALLINNA KAUBAMAJA AS* 5,892,423 3 139.0 122 410,836 9 149.6 137 26.2 262 15,550 249 2,080 135 424,255 8 43.7%19 BDA CONSULTING OÜ 14,376 315 120.6 224 2,842 249 628.3 13 165.8 6 16,513 230 1,106 240 60 338 43.4%20 172 39 ECOMETAL AS 314,524 73 220.1 12 122,581 25 387.4 27 154.6 9 21,008 153 5,934 37 2,048 189 43.1%21 25 6 ELION ETTEVÕTTED AS* 3,086,758 11 108.4 304 592,563 4 115.7 203 29.1 243 22,893 132 1,866 150 536,618 6 42.6%22 23 15 EESTI EHITUS AS* 3,752,028 10 149.9 82 289,771 14 154.1 132 44.7 145 34,861 27 3,402 80 222,287 16 42.1%23 124 GILD PROFESSIONAL SERVICES AS* 133,960 131 224.5 11 80,532 38 319.9 39 103.3 26 43,826 12 2,310 122 1,373 215 42.1%24 TVS PARTNERID AS 24,424 278 291.3 7 1,864 282 523.5 17 108.7 20 20,710 162 1,285 212 134 321 41.2%25 LRF PRIVATE OÜ 12,451 324 1,491.3 1 1,119 316 43.8 150 18,300 200 3,113 85 269 303 40.4%26 12 29 SILBERAUTO AS* 5,334,125 6 133.1 134 232,594 17 107.1 231 35.9 192 26,495 91 7,028 33 274,962 14 40.2%27 152 311 BORTER TRADE OÜ 7,068 347 131.8 144 265 360 93.3 271 294.0 1 10,300 333 1,178 229 268 304 38.5%28 SAGRO AS* 65,872 183 103.9 320 7,423 167 1,795.9 3 30.6 229 10,704 329 451 357 5,638 128 38.5%29 PARKLI HL OÜ* 13,835 318 101.3 331 2,162 269 4,239.2 7 21.8 291 13,540 287 922 273 4,037 146 38.3%30 REMEI BALTICA OÜ 23,285 284 139.8 117 4,187 213 157.0 128 74.1 61 68,337 3 5,821 41 769 254 38.1%31 83 216 PAG AS 72,444 174 242.2 10 10,460 142 346.3 33 136.0 11 20,959 155 10,349 16 479 271 37.9%32 252 285 CYBERNETICA AS 92,669 154 218.7 13 16,218 111 430.9 22 98.3 29 27,655 77 986 260 1,450 211 37.8%33 EBC EHITUS AS 230,903 92 194.4 23 25,531 83 427.8 23 116.6 17 17,262 217 1,471 183 5,960 122 35.9%34 49 124 BALTRONIC OÜ* 307,776 76 159.0 51 54,088 47 286.4 44 129.3 13 26,391 96 5,596 44 1,851 197 35.8%35 64 31 KEMIRA GROWHOW AS 1,155,417 23 126.4 177 38,572 65 186.7 93 29.7 240 52,383 6 46,217 4 303 292 34.2%36 11 73 LINNAEHITUS AS 655,519 42 121.6 217 74,562 40 110.5 221 56.1 106 58,683 4 8,740 25 2,344 181 34.1%37 60 TALLINNA SADAM AS* 1,162,445 22 98.7 335 335,831 11 56.4 335 7.5 360 26,526 89 2,102 133 853,000 3 33.7%38 TELE2 EESTI AS 1,898,719 13 112.1 278 526,042 6 109.5 224 24.1 272 22,254 138 12,410 14 182,078 18 33.1%39 58 61 VKG OIL AS 1,461,883 17 135.7 126 329,392 12 95.6 263 27.9 251 14,904 258 2,449 116 716,187 4 33.0%40 190 3 STEP IT OÜ 213,186 98 155.9 59 4,817 201 217.1 70 48.8 128 51,701 7 8,883 23 359 32.8%41 328 263 ENERGOREMONT AS* 503,063 55 195.8 22 36,178 70 341.7 35 105.8 24 16,144 238 583 330 12,518 89 32.8%42 WIRTGEN EESTI OÜ* 102,700 149 184.3 30 6,569 184 100.0 251 58.8 92 55,796 5 17,117 8 330 285 32.8%43 NET GROUP OÜ 91,571 159 180.6 35 6,966 175 289.5 42 107.6 21 24,851 110 2,954 92 2,198 185 32.2%44 155 MAINOR AS* 263,795 87 109.3 298 437,134 8 143.4 146 52.6 115 14,691 263 717 308 482,176 7 31.9%45 19 41 MAPRI PROJEKT OÜ 395,602 61 198.3 19 31,503 73 163.4 117 95.7 31 33,259 33 1,958 140 5,349 132 31.8%46 50 102 PALMSE MEHAANIKAKODA OÜ* 215,389 96 148.7 87 29,325 79 251.5 57 93.5 35 30,705 48 4,142 63 18,417 68 31.6%47 183 191 COMBIFRAGT EESTI OÜ 92,120 156 141.6 110 9,231 151 415.6 25 76.2 56 23,736 121 4,387 62 149 318 31.3%48 77 ROVICO BÜROO OÜ 11,703 327 152.7 69 3,103 242 253.8 52 105.0 25 28,649 65 2,703 104 27 352 30.9%49 KAAMOS EHITUS OÜ 166,501 109 182.3 33 14,473 121 145.4 143 92.3 36 35,422 23 16,650 10 290 295 30.9%50 LASERSTUUDIO OÜ 4,690 357 186.7 28 435 352 165.5 7 28,426 68 938 268 369 30.4%51 94 195 SONA SYSTEMS OÜ 4,098 362 163.8 45 1,780 285 393.2 26 107.5 22 12,336 304 4,098 65 1,007 236 30.3%52 A.KANGUST & PARTNERID OÜ 3,565 363 147.0 92 1,222 311 362.3 30 116.1 18 14,621 265 594 329 280 300 30.3%53 71 164 FAGEL OÜ* 71,592 175 140.8 113 6,112 190 225.0 68 85.7 42 35,016 26 3,254 84 877 246 30.1%54 26 274 TELORA-E AS 51,652 208 150.7 76 13,618 125 132.3 168 94.0 34 39,258 17 1,435 190 4,711 139 29.9%1 EUR = 15.6466 EEK; 1 EEK = 0.0639 EUR; based on 2007 data See also www.konkurents.eeNovember 200837
TOP ESTONIAN ENTERPRISES 2008Estonian Companies’ Competitiveness Ranking 2008PLACE2007PLACE2006PLACESALES CHANGE NET PROFIT CHANGE RETURN LABOUR COSTS EFFICIENCY PER INVESTMENTS % OFENTERPRISE IN SALES IN NET PROFIT ON EQUITY PER EMPLOYEE EMPLOYEE THE FIRST* group TH EEK PLACE % PLACE TH EEK PLACE % PLACE % PLACE EEK/month PLACE TH EEK PLACE TH EEK PLACE (0 .. 100)55 39 LOODESYSTEM OÜ 62,935 189 160.0 49 2,227 267 353.7 31 73.6 62 24,385 113 1,614 169 3,376 157 29.6%56 ICEFIRE 29,663 261 132.5 140 9,047 152 168.2 111 68.8 69 45,068 10 1,211 224 774 252 29.6%57 149 KRAPESK AS* 36,107 245 97.2 340 27,002 80 444.2 21 82.3 49 18,102 204 737 305 2,167 188 29.5%58 GSMVALVE OÜ 13,362 321 419.6 4 1,051 318 159.7 121 79.8 52 15,234 252 1,028 254 1,250 219 29.3%59 HARJU ELEKTER ELEKTROTEHNIKA AS 269,284 84 145.2 97 21,500 95 364.5 29 53.7 113 25,937 100 1,535 175 8,936 105 28.9%60 AEK OÜ 76,461 170 184.0 32 9,735 147 255.9 51 95.9 30 20,824 159 4,024 68 224 311 28.8%61 90 156 OLYMPIC CASINO EESTI AS 794,786 34 123.7 195 309,160 13 100.0 249 34.5 201 20,629 163 1,359 203 372,292 11 28.5%62 366 139 VIRAITO OÜ 13,837 317 108.7 301 5,975 192 543.4 16 54.3 112 14,761 260 814 290 6,747 116 28.5%63 61 71 AMSERV GRUPI AS* 2,364,574 12 125.6 181 85,486 34 125.4 182 45.0 144 26,148 98 5,326 47 103,302 22 28.3%64 292 315 CENTRALPHARMA COMMUNICATIONS OÜ 20,598 291 129.6 154 1,265 309 373.8 28 50.2 120 28,583 66 981 261 3,046 165 28.1%65 174 TELEGRUPP AS 114,815 139 147.2 91 11,156 136 212.8 72 67.7 73 34,528 29 2,944 93 811 248 28.1%66 408 181 FERDMASTER OÜ 181,718 102 177.3 37 19,010 103 274.4 46 84.1 44 19,001 191 2,089 134 16,607 71 27.9%67 TEEDE REV-2 AS 877,990 31 103.1 323 58,058 45 189.8 89 78.7 53 26,178 97 2,523 112 37,058 47 27.7%68 RIMESS OÜ 46,100 222 147.3 90 8,000 159 235.3 64 95.2 33 23,159 128 536 342 7,100 113 27.5%69 396 475 TERASVARA OÜ 12,338 325 123.4 200 855 329 652.1 11 16.6 322 12,244 308 514 346 2,756 168 27.3%70 170 TAVID AS* 107,827 143 200.1 17 64,338 44 236.1 63 61.3 86 24,125 120 1,269 216 3,001 166 27.3%71 230 CV-ONLINE ESTONIA OÜ 22,943 287 93.5 351 29,805 77 272.7 47 75.1 58 28,917 61 740 304 266 305 27.1%72 EHITUSFIRMA RAND & TUULBERG AS* 1,008,785 24 163.3 46 50,154 52 198.3 82 51.7 119 26,493 92 3,941 71 10,894 95 27.0%73 EXXI AS 12,335 326 164.9 44 2,318 258 162.7 118 56.8 103 37,957 18 3,084 87 106 327 26.7%74 42 23 PERI AS 135,046 129 158.2 54 46,314 55 134.8 163 41.2 157 40,216 15 4,092 66 48,131 36 26.7%75 405 LUHTRE TURISMITALU OÜ 1,288 372 185.8 29 519 345 105.6 235 172.6 4 6,038 369 429 359 304 291 26.6%76 125 PRIKE AS* 628,195 45 153.3 65 24,018 86 190.2 86 58.5 94 28,466 67 6,345 36 3,612 153 26.4%77 103 104 LENNULIIKLUSTEENINDUSE AS 230,805 93 110.4 290 82,309 36 115.0 208 34.3 203 45,132 9 1,832 151 34,005 49 26.2%78 156 513 SILBETI PLOKK OÜ 103,315 147 166.6 42 19,322 100 239.5 61 101.0 28 13,242 291 638 319 29,215 53 26.2%79 Max 123 AS 161,921 114 154.5 63 9,510 149 168.8 107 73.1 63 29,182 54 5,060 49 322 288 25.9%80 EFEKT AS 25,595 276 154.9 62 623 338 505.9 18 15.4 326 18,493 198 1,163 230 365 25.9%81 167 79 MERKO TARTU AS 356,022 66 131.3 145 22,882 91 136.7 160 55.5 110 35,368 24 16,183 11 460 274 25.8%82 130 106 KAARLI HAMBAPOLIKLIINIK OÜ 64,373 187 133.0 136 1,399 301 205.7 77 64.5 79 32,075 38 619 324 371 25.8%83 153 40 TALLINNA VESI AS 820,772 33 118.4 239 277,840 15 112.0 216 23.3 276 20,144 173 2,581 110 285,953 13 25.7%84 HAKA PLAST OÜ 56,483 199 158.4 53 3,747 222 244.9 59 91.9 37 16,654 227 3,530 77 698 258 25.6%85 223 EESTI LOTO AS 410,155 58 144.5 99 77,666 39 189.7 90 72.0 65 21,078 152 8,371 27 1,242 220 25.6%86 TIPTIPTAP OÜ* 19,617 294 158.5 52 2,760 252 211.5 73 108.8 19 14,718 262 1,032 253 247 308 25.4%87 278 317 ELWO AS* 213,656 97 156.0 57 17,549 107 287.1 43 58.5 95 20,730 160 876 280 6,953 114 25.4%88 HEKOTEK AS* 328,688 70 119.7 232 23,391 88 209.6 75 40.3 163 35,179 25 3,460 79 1,965 192 25.4%89 GRT EESTI OÜ 17,275 309 114.2 264 2,289 259 334.6 36 32.2 223 30,886 46 1,152 231 366 25.3%90 KAAMOS KINNISVARA OÜ* 142,625 123 174.8 38 148,913 22 73.5 307 37.7 179 32,337 36 7,131 32 90,528 25 25.2%91 113 52 ABB AS 1,700,000 15 123.6 196 82,000 37 139.9 153 26.4 261 25,110 105 1,876 149 145,000 19 25.1%92 74 84 RAMIRENT AS 308,200 75 130.4 149 106,758 26 128.0 175 40.6 161 28,136 73 2,186 128 191,005 17 25.0%93 188 VÄO PAAS OÜ 104,645 146 121.1 219 17,165 108 252.2 55 42.4 154 31,196 43 1,744 155 6,858 115 24.8%94 228 478 SUN TIMBER OÜ 13,525 320 151.4 74 1,180 314 484.1 19 62.7 83 3,370 372 294 365 947 240 24.8%95 139 182 PUUKESKUS AS 233,460 91 118.1 242 7,092 171 266.8 49 41.0 158 28,253 72 12,970 13 283 299 24.7%96 ABSINT OÜ* 36,383 243 295.8 6 6,314 187 141.9 151 67.8 72 17,393 213 1,915 143 5,000 134 24.6%97 NURMIKO AIANDUSKESKUS OÜ 12,810 323 110.6 289 1,165 315 295.7 41 95.5 32 12,995 295 801 294 379 281 24.4%98 128 VEHO EESTI AS 1,197,391 21 142.2 108 41,023 59 134.4 165 36.3 190 27,202 83 8,804 24 63,439 31 24.3%99 40 272 K-PRINT OÜ 24,343 279 143.0 104 3,436 230 171.7 106 57.8 97 31,582 40 1,281 214 6,420 120 24.3%100 46 66 TAMREX OHUTUSE OÜ 77,378 169 124.4 190 6,901 176 181.0 98 87.5 40 22,621 134 1,382 197 7,839 109 24.2%101 207 NURMIKO HULGI OÜ 80,463 167 129.2 162 3,525 229 252.3 54 83.8 45 17,057 220 2,117 131 1,546 210 24.2%102 419 487 SANGAR AS 75,823 172 85.6 365 6,899 178 570.8 14 23.8 274 10,852 322 258 370 3,102 163 24.2%103 GEA WTT BALTICS OÜ 32,816 252 152.7 68 1,470 299 112.2 214 38.6 171 40,750 14 4,102 64 155 317 24.0%104 86 ELME METALL OÜ 1,591,843 16 155.7 60 38,963 63 95.4 265 15.4 325 27,901 74 46,819 3 400 280 23.8%105 AFFECT OÜ 5,966 352 465.4 3 258 361 105.8 233 62.6 84 4,967 371 96 374 252 306 23.7%106 112 194 WEBMEDIA AS 134,509 130 146.6 94 22,096 94 136.9 159 52.3 116 32,128 37 801 293 4,861 138 23.6%107 VABA MAA AS 30,528 258 111.3 283 945 322 473.1 20 4.8 365 21,750 142 803 291 3,365 158 23.6%108 24 INTEREXPRESS EESTI OÜ 39,841 234 119.8 231 609 340 189.9 88 83.6 46 21,546 147 3,984 70 3,846 149 23.5%38November20081 EUR = 15.6466 EEK; 1 EEK = 0.0639 EUR; based on 2007 data See also www.konkurents.ee
TOP ESTONIAN ENTERPRISES 2008Estonian Companies’ Competitiveness Ranking 2008PLACE2007PLACE2006PLACESALES CHANGE NET PROFIT CHANGE RETURN LABOUR COSTS EFFICIENCY PER INVESTMENTS % OFENTERPRISE IN SALES IN NET PROFIT ON EQUITY PER EMPLOYEE EMPLOYEE THE FIRST* group TH EEK PLACE % PLACE TH EEK PLACE % PLACE % PLACE EEK/month PLACE TH EEK PLACE TH EEK PLACE (0 .. 100)109 98 222 ASPI AS* 1,228,340 20 125.0 185 68,476 41 143.1 147 33.1 212 24,351 114 1,783 154 92,155 24 23.4%110 RONDAM GRUPP AS* 375,906 64 127.5 169 43,131 56 151.0 136 39.0 170 17,346 215 1,663 162 392,000 10 23.4%111 134 133 PROEKSPERT AS* 61,904 192 131.9 143 12,130 133 120.2 194 57.8 98 34,118 30 967 265 782 249 23.4%112 104 E-PROFIIL AS 160,701 115 150.8 75 5,145 197 158.9 123 71.7 66 23,618 125 1,086 243 5,876 124 23.2%113 360 KRAADI OÜ 3,205 365 150.6 77 1,050 320 277.7 45 86.7 41 10,098 334 458 356 359 282 23.2%114 IF EESTI KINDLUSTUS AS* 1,239,076 19 109.6 297 213,118 18 99.1 255 21.3 293 27,029 85 3,030 89 12,833 86 23.2%115 LUKU SERVICE OÜ 26,095 272 126.5 176 2,837 250 131.7 169 82.4 48 25,948 99 2,899 95 361 23.2%116 246 335 UPM-KYMMENE OTEPÄÄ AS 306,577 77 139.8 116 89,937 32 193.0 85 49.8 123 19,354 184 2,071 137 62,657 32 23.1%117 67 127 ELKE AUTO AS* 903,387 29 118.3 241 57,621 46 113.4 211 43.4 152 28,666 64 8,944 22 14,032 84 23.1%118 FINLAID OÜ 44,548 226 92.5 354 1,334 304 416.4 24 65.0 78 7,991 356 2,345 121 4,381 143 22.9%119 282 ANDMEVARA AS 49,613 214 149.5 84 6,040 191 218.4 69 36.5 188 29,142 56 719 307 712 256 22.9%120 FAKTO AS* 975,730 26 93.6 350 40,340 60 112.1 215 45.3 142 27,320 82 4,879 52 105,413 21 22.9%121 162 BALTI INVESTEERINGUTE GRUPI PANK AS* 629,000 44 204.9 15 177,000 20 101.7 246 45.2 143 15,851 240 1,709 158 15,000 80 22.7%122 ESTON EHITUS AS 290,785 81 182.2 34 23,365 89 156.9 129 33.0 214 28,374 70 5,014 51 858 247 22.6%123 TOPAUTO RAKVERE OÜ 32,764 253 126.1 180 918 325 152.2 10 14,718 261 3,276 83 89 333 22.6%124 166 38 ARCO VARA AS* 727,188 37 150.4 78 235,511 16 108.4 228 17.6 314 22,778 133 1,212 223 47,204 37 22.5%125 121 97 MAXIT ESTONIA AS 698,865 39 104.4 317 187,818 19 126.7 176 19.4 309 27,421 80 3,994 69 48,200 35 22.5%126 332 197 KENTEK EESTI OÜ* 18,949 297 126.4 178 1,050 319 342.0 34 19.0 310 24,200 117 1,895 146 778 251 22.3%127 211 287 FORANKRA BALTIC OÜ 35,617 247 108.8 300 6,399 185 171.8 104 41.7 155 33,597 32 2,740 100 513 268 22.3%128 454 ESTANC AS* 58,035 195 144.4 101 5,687 193 226.0 67 57.3 101 20,580 166 1,382 198 1,853 196 22.3%129 209 227 HARJU ELEKTER AS* 731,985 36 117.7 245 85,935 33 165.1 116 14.6 328 29,998 52 1,656 163 43,256 39 22.3%130 AIR MAINTENANCE ESTONIA AS 166,701 108 120.1 226 9,685 148 85.5 43 32,916 35 1,378 201 5,539 129 22.2%131 BLADHS EESTI AS 140,326 125 267.8 8 6,874 179 214.6 71 39.4 168 14,513 270 850 284 5,203 133 22.2%132 TIKKURILA-VIVACOLOR AS 386,413 63 118.4 240 39,752 62 117.2 201 22.8 283 36,800 21 4,830 55 29,197 54 22.2%133 REALISTER OÜ 6,987 348 333.6 5 609 341 144.9 144 67.9 71 7,283 360 873 281 464 273 22.1%134 283 70 FELITON OÜ 29,531 263 159.4 50 3,132 239 107.6 230 89.8 38 19,279 185 1,284 213 330 286 21.9%135 7 FINNLAMELLI EESTI OÜ 50,916 209 125.5 182 4,457 209 142.0 150 83.4 47 20,974 154 1,455 186 1,405 213 21.9%136 69 FILTER AS* 356,644 65 139.7 118 29,366 78 168.4 109 40.9 159 24,194 118 2,426 118 40,837 43 21.7%137 GLAMOX HE AS 265,342 85 128.6 164 37,279 68 197.2 84 46.8 137 22,306 136 2,434 117 10,366 99 21.7%138 118 TELCO AS* 26,323 271 139.2 121 5,006 200 157.1 126 59.7 90 25,044 106 1,385 196 2,173 187 21.7%139 86 SAKU ÕLLETEHASE AS 911,685 28 118.4 238 100,923 30 87.9 282 26.5 260 26,708 87 3,039 88 88,343 26 21.5%140 241 REPO VABRIKUD AS 582,482 50 113.3 274 47,881 54 331.3 37 22.5 287 14,209 274 1,393 195 42,477 42 21.5%141 HOLMEN METS AS* 419,210 56 124.4 189 895 326 61.1 331 9.7 356 44,123 11 19,962 7 357 21.5%142 441 HAMMER SERVICE OÜ 6,390 350 103.9 321 658 336 296.2 40 46.7 138 19,255 186 1,420 192 49 348 21.3%143 RAUAMEISTER AS* 93,774 153 139.3 119 16,307 110 230.3 65 52.8 114 18,154 203 1,116 238 2,000 190 21.2%144 76 HOBBITON OÜ* 61,252 193 128.7 163 6,870 180 121.1 193 38.1 175 33,657 31 1,178 227 3,095 164 21.1%145 258 CHOU OÜ 7,551 344 110.4 292 754 331 258.6 50 80.4 51 10,835 324 260 369 54 342 21.0%146 162 IKODOR AS 56,791 198 152.0 71 18,247 104 201.4 81 58.3 96 16,574 229 2,184 129 9,280 103 20.9%147 190 176 LASBET AS 220,566 95 124.7 188 66,864 42 139.7 155 47.5 134 23,242 127 1,050 250 27,780 56 20.9%148 HELMETAL IMS OÜ 22,987 286 197.0 20 3,335 234 134.4 166 77.2 55 13,992 279 1,197 225 4,389 142 20.9%149 VIKING MOTORS AS* 405,789 59 136.9 125 13,526 127 103.6 240 39.9 166 27,794 76 3,940 72 52,604 34 20.8%150 12 BALTIC PULP AND PAPER OÜ 619,941 46 130.7 148 19,312 101 142.9 148 29.9 239 12,503 302 103,323 2 933 244 20.8%151 169 PRO FIKSUM OÜ 9,193 338 119.5 234 2,556 254 253.3 53 101.3 27 3,012 373 1,532 176 1,334 216 20.7%152 85 59 HENKEL MAKROFLEX AS* 897,942 30 95.3 346 105,354 29 94.4 268 30.6 230 26,399 95 10,089 17 10,500 98 20.6%153 208 347 AQRIS SOFTWARE AS 20,549 292 107.9 305 6,307 188 202.5 80 48.5 131 24,261 115 604 326 184 313 20.6%154 22 MARFIN PANK EESTI AS 50,840 210 155.7 61 2,242 264 64.3 325 1.1 373 46,215 8 1,640 164 3,268 160 20.6%155 145 132 UHTNA TALUTEHNIKA AS 118,812 137 114.4 263 10,263 144 197.3 83 55.0 111 20,206 169 2,200 126 12,616 88 20.5%156 BENEFIT AS 46,507 221 116.4 251 5,364 196 122.0 189 44.1 148 30,952 45 2,215 125 952 239 20.4%157 PORTEX AS 7,489 345 92.7 353 999 321 190.2 87 66.8 74 20,886 157 832 286 51 347 20.4%158 303 142 TATOLI AS 263,867 86 144.9 98 16,189 112 155.9 130 32.5 220 24,867 108 9,194 21 4,945 136 20.2%159 POSTIMEES AS 246,628 90 122.4 207 19,567 99 177.4 101 37.1 185 24,946 107 1,142 232 1,300 217 20.2%160 ELEKTRIMEES OÜ 22,400 289 152.6 70 2,241 265 165.4 115 69.7 68 15,579 248 1,723 157 363 20.1%161 346 HORECA SERVICE OÜ* 81,719 166 129.4 155 4,399 210 102.1 244 76.0 57 20,592 165 2,724 101 1,650 205 20.1%162 108 251 AJ TOOTED AS 34,468 249 115.3 259 8,479 156 122.1 188 55.6 109 25,535 103 6,894 35 5,808 127 20.0%1 EUR = 15.6466 EEK; 1 EEK = 0.0639 EUR; based on 2007 data See also www.konkurents.eeNovember 200839
TOP ESTONIAN ENTERPRISES 2008Estonian Companies’ Competitiveness Ranking 2008PLACE2007PLACE2006PLACESALES CHANGE NET PROFIT CHANGE RETURN LABOUR COSTS EFFICIENCY PER INVESTMENTS % OFENTERPRISE IN SALES IN NET PROFIT ON EQUITY PER EMPLOYEE EMPLOYEE THE FIRST* group TH EEK PLACE % PLACE TH EEK PLACE % PLACE % PLACE EEK/month PLACE TH EEK PLACE TH EEK PLACE (0 .. 100)163 UWEKO AS 105,051 144 114.1 265 15,731 115 168.4 110 37.9 177 25,669 101 9,550 20 358 20.0%164 167 VBH ESTONIA AS 164,757 111 156.0 58 10,471 141 119.2 195 22.4 288 30,709 47 4,846 54 11,005 93 19.9%165 SPACECOM AS* 603,843 48 83.0 366 135,789 23 66.8 319 30.2 234 27,612 79 4,681 56 45,549 38 19.8%166 OILSEEDS TRADE AS 163,114 113 212.1 14 2,051 275 148.8 140 58.5 93 9,560 340 23,302 6 314 289 19.8%167 376 44 ASPERAAMUS OÜ 68,414 179 149.2 85 1,204 312 250.7 58 57.5 100 9,137 348 9,773 18 3,606 154 19.7%168 106 120 EESTI KREDIIDIPANK AS 322,978 71 126.1 179 82,692 35 109.3 225 30.0 238 26,706 88 1,736 156 7,608 110 19.7%169 5 257 CATWEES OÜ* 588,420 49 187.3 27 50,507 50 53.4 337 39.2 169 21,855 140 7,448 29 14,738 82 19.7%170 28 428 SOVEK AS 54,552 201 132.1 142 4,355 211 130.6 172 63.6 81 20,717 161 1,399 194 1,750 201 19.6%171 140 206 VALOOR AS* 163,633 112 125.0 186 9,972 145 124.5 184 40.5 162 24,855 109 4,545 60 56,197 33 19.6%172 36 EUREX CAPITAL OÜ* 29,224 264 157.4 55 12,005 135 149.0 139 65.2 76 15,627 247 769 298 1,238 221 19.5%173 188 FRELOK AS 680,275 41 129.3 158 30,162 75 90.7 276 21.5 292 28,279 71 8,398 26 28,281 55 19.4%174 PLANSERK AS 26,715 270 172.1 39 2,267 261 116.4 202 28.9 247 27,855 75 1,571 171 9,678 101 19.3%175 219 FRIENDS TEXTILE OÜ* 43,692 228 123.2 202 7,563 165 146.2 142 45.7 140 24,140 119 2,570 111 566 265 19.2%176 225 358 EXCELLENT GRUPP AS 47,237 217 143.9 103 15,811 113 134.6 164 40.2 164 22,074 139 15,746 12 53 344 19.1%177 138 214 TOODE AS 329,573 69 121.9 213 41,445 58 106.4 232 48.7 130 21,177 150 3,582 75 24,707 59 19.1%178 306 212 PAEKIVITOODETE TEHASE OÜ 140,632 124 122.3 209 23,100 90 189.0 91 35.5 195 20,406 168 1,057 248 27,325 57 19.0%179 192 252 SUNOREK AS* 178,887 104 123.9 194 11,063 137 93.0 272 68.1 70 20,178 171 840 285 3,627 152 19.0%180 14 BETOONIMEISTER AS* 144,800 121 152.7 67 6,585 183 53.9 336 26.0 263 31,241 42 3,017 90 68,400 29 18.9%181 241 90 REGIO AS 52,474 206 97.1 342 3,537 228 178.9 100 27.1 257 28,669 63 772 297 1,975 191 18.9%182 80 RAPLA TEED OÜ 226,588 94 142.9 105 15,584 117 117.7 199 46.7 139 20,428 167 1,462 185 30,839 52 18.8%183 AEROC AS 202,594 99 127.5 170 38,427 66 204.4 78 32.6 219 18,008 205 1,688 159 8,493 107 18.8%184 221 EDELSTEIN OÜ 4,401 360 144.0 102 885 327 188.2 92 80.9 50 7,113 363 1,100 241 175 315 18.7%185 58 RAKVERE LIHAKOMBINAAT AS* 1,888,061 14 111.1 285 124,759 24 68.9 315 13.0 338 14,111 276 1,379 200 142,900 20 18.7%186 230 KEMIFLORA AS* 133,163 132 117.1 248 10,925 139 123.3 187 29.2 242 28,937 60 3,599 74 2,220 184 18.6%187 110 22 KPMG BALTICS AS* 148,906 119 121.2 218 5,096 198 61.7 329 44.1 149 30,151 50 756 302 1,063 232 18.6%188 272 310 VÄRVALTRANS OÜ* 32,285 254 142.9 106 5,515 194 168.6 108 56.0 107 15,638 246 922 272 2,490 174 18.6%189 150 WENDRE AS 1,000,906 25 145.4 96 94,975 31 157.0 127 25.7 264 12,275 306 1,571 172 16,456 72 18.5%190 YIT EMICO AS 53,019 203 141.0 112 4,001 214 77.5 54 23,682 123 2,039 139 60 339 18.5%191 201 187 ET TOREL OÜ 22,106 290 126.8 174 4,474 207 160.0 120 65.0 77 14,874 259 819 289 1,709 203 18.4%192 HARJU EHITUS AS* 261,792 88 119.6 233 36,768 69 101.3 248 47.2 136 21,759 141 4,593 59 5,516 130 18.4%193 244 204 WELLSPA OÜ* 64,442 186 111.0 287 13,408 128 125.4 183 62.9 82 19,041 189 2,079 136 1,000 237 18.4%194 159 303 KALTSIIT AS 49,719 213 123.5 199 12,539 131 117.7 200 35.7 194 26,441 93 1,243 219 15,350 76 18.4%195 79 266 SKS VÕRU OÜ 92,286 155 99.1 333 3,740 224 41.2 343 22.1 289 39,665 16 5,768 42 429 278 18.3%196 292 ESTEL ELEKTRO AS 88,732 163 188.8 25 1,376 302 173.8 103 31.4 225 17,348 214 975 264 1,872 193 18.3%197 TECHNOMAR & ADREM AS 574,335 52 132.8 139 155,889 21 171.7 105 23.7 275 10,837 323 1,009 257 37,053 48 18.3%198 212 193 SCHETELIG EV AS 102,838 148 114.0 268 10,371 143 111.4 219 24.4 271 30,997 44 3,546 76 508 269 18.3%199 256 NORMA AS* 1,263,942 18 120.7 223 105,928 28 123.6 186 11.9 342 17,240 219 1,300 211 42,487 41 18.2%200 143 304 SYSTEMAIR AS 104,913 145 121.7 216 10,569 140 112.4 213 32.7 218 27,112 84 5,829 40 126 323 18.2%201 ESTONIAN NATURE TOURS (KUMARI REISID OÜ) 1,006 375 64.6 373 516 346 169.6 5 2,760 375 503 348 9 356 18.2%202 ELEKTRITSENTRUM AS* 253,808 89 134.1 132 13,689 124 154.0 133 30.1 237 21,654 145 1,511 179 9,374 102 18.1%203 401 KUNDA MOBIL AS 17,385 307 134.2 131 1,600 296 268.7 48 51.7 118 7,408 359 1,023 255 4,287 145 18.0%204 175 ESTEVE TERMINAL AS 132,170 133 128.1 166 12,446 132 81.3 294 34.7 199 27,653 78 1,041 251 24,600 60 18.0%205 COLUMBUS IT PARTNER EESTI AS* 57,475 196 148.0 88 3,428 231 34.5 200 34,860 28 1,084 245 124 324 18.0%206 453 UKSEKODA OÜ 32,101 255 150.3 80 884 328 202.6 79 14.5 329 23,031 130 917 274 1,379 214 18.0%207 151 341 EKTACO AS 23,745 283 102.4 327 2,128 272 124.3 185 39.5 167 26,919 86 879 279 700 257 18.0%208 CLUBBY AS* 8,628 340 144.5 100 641 337 167.7 113 47.7 132 16,724 226 1,438 189 364 18.0%209 384 DATA PRINT OÜ 18,561 303 179.4 36 1,565 298 74.8 59 19,833 177 1,237 221 943 241 18.0%210 PKC EESTI AS 341,448 67 133.1 135 20,413 98 142.4 149 56.2 104 13,908 283 269 368 1,812 199 17.9%211 135 283 TALENT PLASTICS EESTI AS 43,858 227 167.7 41 3,581 227 130.8 171 65.5 75 10,872 321 933 270 23,083 62 17.9%212 240 223 TARKON AS 698,748 40 124.3 192 34,319 72 185.6 95 36.9 186 11,966 311 1,359 204 10,700 97 17.7%213 373 67 SUJA EHITUS OÜ* 35,374 248 138.1 123 1,627 294 211.3 74 33.9 205 16,490 232 1,179 226 1,180 225 17.7%214 314 NELICO OÜ 41,984 230 146.7 93 3,868 218 179.8 99 48.9 127 13,630 286 1,135 236 3,215 161 17.6%215 DPD EESTI AS 97,985 151 147.7 89 5,371 195 69.3 314 47.7 133 23,107 129 1,517 178 1,260 218 17.6%216 239 168 TEEDE TEHNOKESKUS AS 52,279 207 115.6 256 3,272 235 130.3 173 14.4 330 31,277 41 830 287 1,733 202 17.6%40November20081 EUR = 15.6466 EEK; 1 EEK = 0.0639 EUR; based on 2007 data See also www.konkurents.ee
TOP ESTONIAN ENTERPRISES 2008Estonian Companies’ Competitiveness Ranking 2008PLACE2007PLACE2006PLACESALES CHANGE NET PROFIT CHANGE RETURN LABOUR COSTS EFFICIENCY PER INVESTMENTS % OFENTERPRISE IN SALES IN NET PROFIT ON EQUITY PER EMPLOYEE EMPLOYEE THE FIRST* group TH EEK PLACE % PLACE TH EEK PLACE % PLACE % PLACE EEK/month PLACE TH EEK PLACE TH EEK PLACE (0 .. 100)217 208 VALMAP GRUPP AS 66,396 182 115.7 255 14,500 120 157.5 125 50.0 121 16,817 224 935 269 5,846 126 17.5%218 117 174 ADDINOL MINERALÖL MARKETING OÜ 178,472 106 122.2 210 8,989 153 119.0 196 23.0 280 26,497 90 5,577 45 9,867 100 17.5%219 SAMESTI METALL OÜ 2,687 369 96.3 345 51 373 347.1 32 11.5 345 14,943 256 537 341 372 17.5%220 443 MOBICOM AS 8,430 341 122.0 212 438 351 242.5 60 11.7 343 21,611 146 1,405 193 88 334 17.5%221 238 265 HANSAB AS* 130,296 134 127.7 168 9,471 150 103.7 239 21.1 294 28,955 59 2,391 120 454 275 17.4%222 281 CHEMI-PHARM AS* 30,873 257 116.0 254 4,259 212 182.9 97 34.0 204 20,182 170 965 266 355 283 17.4%223 164 57 IREST EHITUSJUHTIMISE AS* 414,949 57 140.4 115 24,769 85 97.2 261 57.6 99 13,337 289 5,844 38 4,332 144 17.4%224 70 134 TALTER AS 741,622 35 94.6 348 51,220 48 104.8 237 27.5 254 21,673 144 2,194 127 26,752 58 17.3%225 288 MÖÖBLIMAJA AS* 135,328 128 104.4 318 22,252 92 111.7 218 60.1 89 17,588 208 1,671 160 620 262 17.3%226 BLAUINVEST OÜ 18,281 305 200.8 16 1,992 277 121.4 192 71.4 67 5,967 370 381 361 3,966 148 17.2%227 29 122 ARTIG KV OÜ 178,727 105 110.8 288 48,706 53 44.8 341 24.6 270 14,189 275 44,682 5 241,276 15 16.9%228 369 PÕLVAMAA HOIU-LAENUÜHISTU TUÜ 2,201 370 142.5 107 243 362 239.2 62 11.0 348 18,399 199 440 358 52 345 16.8%229 367 OESE METALL OÜ 6,242 351 108.6 303 498 348 327.5 38 23.2 277 9,426 342 567 336 1,202 224 16.6%230 10 261 BCS ITERA AS* 18,593 302 86.9 363 1,310 307 51.5 338 41.5 156 30,501 49 1,033 252 141 319 16.6%231 356 74 TERG OÜ 57,050 197 137.6 124 1,455 300 99.6 254 13.0 337 29,149 55 4,075 67 1,211 222 16.6%232 KOOPIA KOLM AS* 17,358 308 113.4 273 3,222 237 103.1 242 72.5 64 13,667 285 579 331 2,189 186 16.6%233 148 PÕLTSAMAA MEIEREI JUUSTUTÖÖSTUS OÜ 151,000 118 121.8 214 21,100 96 151.5 135 56.1 105 10,972 317 2,517 113 6,500 119 16.6%234 132 213 MARU EHITUS AS* 302,929 78 77.3 371 14,448 122 90.4 277 22.9 281 29,766 53 4,660 58 3,531 156 16.6%235 307 ERGO KINDLUSTUSE AS* 932,020 27 113.6 272 106,324 27 87.7 283 17.2 318 17,743 207 1,610 170 19,527 66 16.5%236 160 PINTAVÄRI EESTI OÜ 19,052 296 101.7 330 2,136 271 95.3 266 37.9 178 25,443 104 2,722 102 667 260 16.5%237 LINXTELECOM ESTONIA OÜ 68,501 178 151.5 73 2,479 256 11.6 344 35,557 22 2,740 99 14,608 83 16.3%238 335 234 NUIA PMT AS 64,024 188 113.1 275 7,751 163 137.4 158 27.8 253 22,356 135 889 276 4,993 135 16.2%239 FIXTEC AS 7,801 343 192.3 24 179 366 20.5 299 30,007 51 1,950 141 362 16.2%240 RITSU AS 75,929 171 114.1 266 13,891 123 149.3 138 61.5 85 9,990 336 697 310 15,331 77 16.2%241 298 PROFLINE AS* 25,260 277 113.7 271 2,122 273 99.8 253 35.4 196 23,736 122 2,105 132 54 343 16.1%242 224 349 KINDLUSTUSEST KINDLUSTUSMAAKLER OÜ 14,120 316 130.0 152 1,776 286 74.5 306 51.8 117 19,777 179 471 354 622 261 16.1%243 312 165 TRETIMBER OÜ* 91,676 158 150.4 79 7,895 160 183.6 96 19.6 307 15,848 241 2,778 97 17,248 70 16.1%244 16 AIRWAVE OÜ 45,120 225 165.9 43 6,354 186 98.6 259 49.2 125 14,057 278 3,008 91 1,204 223 16.1%245 163 255 ESTRAVEL AS* 117,310 138 106.0 310 23,430 87 77.7 301 38.2 174 23,645 124 556 340 2,374 179 16.1%246 387 M JA P NURST AS 113,721 140 134.0 133 7,847 161 207.6 76 27.3 255 12,717 297 980 262 22,492 64 16.1%247 367 320 ECOPRO AS* 41,215 231 121.8 215 6,633 182 139.8 154 37.6 180 18,258 202 1,178 228 1,143 227 16.1%248 SYSTEMTEST OÜ 20,222 293 105.0 313 3,013 244 103.1 243 33.4 210 24,692 111 1,011 256 300 293 16.0%249 107 254 KOMPRESSORIKESKUS OÜ 46,819 220 101.0 332 2,781 251 66.8 320 30.5 231 28,775 62 2,229 124 348 284 16.0%250 112 NORES PLASTIC OÜ 85,012 164 96.8 343 2,866 248 67.8 317 30.8 228 26,399 94 17,002 9 52 346 16.0%251 TERASMAN OÜ 66,565 180 98.2 337 1,731 291 228.4 66 13.2 335 19,613 181 756 303 4,612 141 15.9%252 179 161 KRIMELTE OÜ 869,700 32 115.1 260 50,400 51 62.5 326 20.9 295 18,280 201 4,676 57 67,000 30 15.9%253 265 157 VÄNDRA MP OÜ 123,072 136 126.8 173 12,554 130 98.7 258 29.1 244 21,733 143 1,619 167 16,091 74 15.8%254 TRIO LSL AS* 47,842 216 122.9 205 3,842 219 129.9 174 38.3 173 17,889 206 514 345 1,022 235 15.7%255 NANSO GROUP EESTI AS 65,094 185 113.7 270 1,886 280 126.1 180 57.0 102 13,377 288 505 347 6 373 15.7%256 171 RUSSIAN ESTONIAN RAIL SERVICES AS 65,389 184 45.0 375 38,670 64 37.5 347 12.4 340 37,725 19 7,265 31 360 15.5%257 137 KAESER KOMPRESSORIT OY EESTI FILIAAL 38,809 237 115.0 261 3,382 232 79.9 299 33.5 208 23,524 126 4,851 53 537 267 15.5%258 VÕRGUVARA AS 54,263 202 161.7 47 3,777 221 97.4 260 25.1 267 20,165 172 2,713 103 248 307 15.4%259 TOP MARINE OÜ 11,698 328 87.1 362 1,735 289 147.2 141 50.0 122 15,403 250 1,671 161 7,151 112 15.4%260 WINDOOR AS 60,782 194 131.0 147 8,630 155 105.6 234 36.3 189 18,536 196 1,520 177 780 250 15.4%261 344 JAJAA OÜ 10,195 335 120.9 222 2,157 270 110.2 222 37.2 184 19,588 182 1,133 237 174 316 15.4%262 181 446 CV KESKUS AS 18,692 301 125.5 183 6,998 174 125.6 181 64.3 80 8,833 352 1,246 218 1,592 209 15.3%263 ISIS MEDICAL OÜ* 27,528 268 129.4 156 1,706 293 109.6 223 49.0 126 14,355 271 2,503 114 134 322 15.2%264 MARU METALL AS 111,589 142 126.7 175 7,841 162 108.9 227 30.5 232 19,366 183 1,213 222 2,470 177 15.1%265 234 235 TAASTAVA KIRURGIA KLIINIK AS 45,257 224 119.8 230 4,726 202 103.5 241 30.2 236 21,213 149 566 337 3,198 162 15.1%266 373 HOTRONIC AS 68,933 177 128.2 165 1,865 281 161.9 119 17.3 317 18,798 194 1,352 206 5,961 121 15.1%267 RESTA AS 6,721 349 115.4 257 163 369 165.9 114 29.0 245 16,984 222 395 360 91 330 15.1%268 DELUX DOMOTEX OÜ 154,357 116 134.8 130 17,564 106 130.8 170 43.5 151 10,902 319 1,057 249 8,300 108 14.9%269 ALISTAR GROUP OÜ* 37,389 238 112.8 276 383 354 80.3 298 49.4 124 16,944 223 7,478 28 43 351 14.9%270 197 490 SILBET AS 153,704 117 90.0 360 25,927 81 158.2 124 36.6 187 12,794 296 1,114 239 31,342 51 14.7%1 EUR = 15.6466 EEK; 1 EEK = 0.0639 EUR; based on 2007 data See also www.konkurents.eeNovember 200841
TOP ESTONIAN ENTERPRISES 2008Estonian Companies’ Competitiveness Ranking 2008PLACE2007PLACE2006PLACESALES CHANGE NET PROFIT CHANGE RETURN LABOUR COSTS EFFICIENCY PER INVESTMENTS % OFENTERPRISE IN SALES IN NET PROFIT ON EQUITY PER EMPLOYEE EMPLOYEE THE FIRST* group TH EEK PLACE % PLACE TH EEK PLACE % PLACE % PLACE EEK/month PLACE TH EEK PLACE TH EEK PLACE (0 .. 100)271 ALUOJA OÜ* 37,086 241 131.1 146 7,308 170 139.6 156 37.3 183 13,211 293 3,371 81 1,176 226 14.7%272 346 404 ORGITA PÕLD OÜ 23,022 285 140.6 114 7,416 168 141.0 152 29.5 241 14,557 269 767 299 10,903 94 14.7%273 508 PERFETTO STUUDIO OÜ 11,425 330 104.6 314 1,587 297 168.1 112 55.8 108 7,920 357 1,632 165 79 335 14.6%274 PAJO AS 24,008 281 196.2 21 1,740 288 44.5 146 17,582 209 800 295 204 312 14.6%275 53 LAVINTON OÜ 13,701 319 114.1 267 1,992 276 101.6 247 36.2 191 18,785 195 1,305 210 739 255 14.5%276 21 BLRT MARKETEX OÜ 542,676 53 184.2 31 4,571 204 23.4 354 28.0 250 17,320 216 1,918 142 1,796 200 14.5%277 KALEVA TRAVEL AS 39,644 235 106.4 309 5,049 199 77.4 302 24.7 269 24,638 112 478 353 324 287 14.4%278 HARKU KARJÄÄR AS 90,600 161 135.4 127 19,200 102 115.7 204 23.0 279 17,017 221 761 300 15,200 78 14.4%279 249 228 PROMENS AS 180,375 103 109.8 295 21,056 97 100.0 250 34.4 202 16,319 236 1,317 209 18,425 67 14.4%280 300 298 JELD-WEN EESTI AS 633,882 43 124.2 193 38,211 67 87.4 284 22.9 282 11,790 314 865 283 88,139 27 14.2%281 AW NEOON OÜ 28,107 267 124.4 191 3,809 220 94.9 267 22.5 286 21,241 148 1,004 259 2,666 172 14.2%282 277 247 ESTIKO-PLASTAR AS 293,187 80 115.3 258 15,102 118 104.2 238 23.1 278 17,463 212 1,620 166 20,000 65 14.1%283 226 280 INDOOR GROUP AS 396,328 60 117.3 247 22,114 93 72.1 311 19.9 302 19,859 176 5,017 50 1,668 204 14.0%284 324 325 ORU HOTELL OÜ 14,940 312 110.4 291 1,948 278 115.4 205 40.7 160 14,956 255 482 352 603 264 13.9%285 378 K & M PROJEKTBÜROO OÜ 5,327 354 134.9 128 1,061 317 175.8 102 44.1 147 6,203 368 666 314 496 270 13.9%286 318 359 FASHION GARDEN OÜ* 24,028 280 120.9 221 3,222 238 135.8 161 33.4 209 13,929 281 1,502 182 273 301 13.9%287 322 BALTI KELLA AS* 13,321 322 106.6 308 2,397 257 105.0 236 42.7 153 15,045 254 2,664 109 1,870 194 13.9%288 VIPEX AS 91,849 157 97.5 339 9,912 146 154.2 131 19.7 306 17,257 218 2,870 96 2,488 175 13.8%289 222 150 INFOTARK AS 269,713 83 103.9 319 17,927 105 89.2 279 17.0 319 21,173 151 2,697 105 11,060 92 13.8%290 199 AIK-PROJEKT OÜ 4,642 358 149.0 86 188 365 40.0 344 20.0 301 24,205 116 774 296 67 337 13.8%291 401 VÄNDRA SAETERITUS AS 18,786 298 110.2 294 2,537 255 132.6 167 25.2 266 17,550 210 626 322 3,653 151 13.8%292 289 464 KEMEHH OÜ 5,276 355 132.9 138 923 323 185.9 94 33.6 207 8,370 354 330 363 958 238 13.8%293 232 103 ENSTO ENSEK AS 516,577 54 116.6 249 31,493 74 82.5 291 20.7 297 15,659 245 1,825 152 9,200 104 13.4%294 366 PINUS ABJA OÜ 10,614 332 129.4 157 345 357 251.8 56 7.1 362 9,335 344 354 362 89 332 13.3%295 456 PÕLTSAMAA FELIX AS 284,440 82 151.7 72 7,423 166 126.7 177 7.5 361 14,077 277 1,361 202 39,358 45 13.3%296 119 VÄRSKA VESI AS 69,502 176 139.3 120 3,106 241 82.3 292 28.1 249 15,792 242 1,616 168 12,718 87 13.2%297 191 123 PIPELIFE EESTI AS 387,333 62 116.6 250 1,722 292 12.0 358 1.6 371 28,402 69 5,380 46 31,425 50 13.2%298 269 378 ISOGREEN AS 16,623 310 117.9 244 923 324 118.9 198 23.9 273 16,236 237 1,279 215 451 276 13.0%299 158 MATEK AS* 182,964 101 96.6 344 15,765 114 82.7 290 32.4 221 16,499 231 1,441 188 4,648 140 13.0%300 206 391 ROOTSI MÖÖBEL AS 83,957 165 119.1 235 12,592 129 81.0 295 31.2 226 15,734 243 1,908 145 3,814 150 13.0%301 87 RUUT EHITUSE OÜ 14,769 313 69.9 372 2,276 260 121.4 191 60.7 87 9,126 349 1,136 235 367 13.0%302 407 RAIKKÜLA FARMER OÜ 47,928 215 109.7 296 7,002 172 112.0 217 12.7 339 19,734 180 871 282 14,855 81 13.0%303 329 240 KIVIRAND OÜ 11,243 331 97.2 341 1,301 308 110.6 220 48.8 129 11,259 316 562 338 289 296 12.9%304 388 382 STRAND AS 61,955 191 119.0 236 13,553 126 137.4 157 31.0 227 10,825 325 558 339 1,599 207 12.9%305 321 AUDIITORBÜROO ÕNNE KURVET OÜ 1,186 374 142.0 109 196 364 108.2 229 33.8 206 11,786 315 297 364 374 12.9%306 355 LIHULA TARBIJATE ÜHISTU* 90,773 160 116.1 253 3,589 226 144.6 145 33.3 211 9,751 339 1,243 220 5,860 125 12.8%307 341 153 SAINT-GOBAIN SEKURIT EESTI AS 300,986 79 94.7 347 29,927 76 68.1 316 17.7 313 19,038 190 1,381 199 24,103 61 12.7%308 260 484 MIVAR AS* 190,643 100 122.4 208 12,082 134 159.5 122 19.4 308 10,097 335 579 332 12,171 90 12.6%309 253 GASPRE OÜ* 30,355 259 88.1 361 3,918 216 65.4 323 28.4 248 20,959 156 1,445 187 1,851 198 12.6%310 263 SELF II OÜ 10,599 333 116.3 252 2,231 266 91.2 273 32.8 217 14,597 266 883 278 1,596 208 12.5%311 IPM ELEKTROONIKA AS 52,735 205 127.5 171 2,880 247 114.7 209 19.9 303 14,905 257 488 350 3,571 155 12.5%312 354 SALVEST AS 169,400 107 123.5 198 15,706 116 126.2 179 17.5 316 12,658 299 1,137 234 10,704 96 12.4%313 352 333 FEIN-ELAST ESTONIA OÜ 73,990 173 110.2 293 8,045 158 85.4 286 17.6 315 19,075 188 1,358 205 937 243 12.4%314 361 AURE OÜ 10,382 334 123.1 203 1,319 306 73.2 308 27.8 252 16,605 228 2,307 123 91 331 12.4%315 75 QUATTROMED AS* 55,000 200 145.5 95 1,896 279 57.2 333 24.9 268 16,037 239 679 312 5,916 123 12.2%316 383 AGROTARVE AS 38,995 236 111.4 282 7,738 164 135.2 162 29.0 246 10,885 320 1,083 246 930 245 12.2%317 189 E-KATUSED OÜ 4,549 359 92.4 355 164 368 90.3 278 37.5 181 14,571 268 650 317 140 320 12.1%318 344 370 ESRO AS 79,959 168 125.4 184 8,083 157 67.6 318 10.9 350 20,126 174 1,568 174 6,745 117 12.1%319 MALMOND OÜ 5,838 353 102.3 328 375 355 100.0 252 15.9 323 18,819 193 2,919 94 17 354 12.0%320 357 131 TELEEKSPERT AS 37,117 240 156.8 56 566 344 75.2 305 10.7 354 17,465 211 977 263 1,074 231 12.0%321 151 SIGARI MAJA OÜ* 28,530 266 104.5 315 3,933 215 88.5 281 31.6 224 13,943 280 1,502 181 123 325 11.8%322 65 KUUSAKOSKI AS 1,254 373 93.4 352 17 374 27.4 351 0.0 375 29,098 57 5 375 38,635 46 11.8%323 KATEKS SISUSTUS AS 25,691 275 117.7 246 1,320 305 72.2 310 12.3 341 19,866 175 676 313 2,238 183 11.7%324 236 80 REGINETT OÜ 18,753 300 123.3 201 742 332 80.3 297 38.0 176 10,560 330 2,679 108 71 336 11.6%42November20081 EUR = 15.6466 EEK; 1 EEK = 0.0639 EUR; based on 2007 data See also www.konkurents.ee
TOP ESTONIAN ENTERPRISES 2008Estonian Companies’ Competitiveness Ranking 2008PLACE2007PLACE2006PLACESALES CHANGE NET PROFIT CHANGE RETURN LABOUR COSTS EFFICIENCY PER INVESTMENTS % OFENTERPRISE IN SALES IN NET PROFIT ON EQUITY PER EMPLOYEE EMPLOYEE THE FIRST* group TH EEK PLACE % PLACE TH EEK PLACE % PLACE % PLACE EEK/month PLACE TH EEK PLACE TH EEK PLACE (0 .. 100)325 290 140 RAPALA EESTI AS 144,790 122 99.0 334 51,194 49 96.1 262 34.9 198 8,453 353 523 344 1,649 206 11.5%326 SÖDERHAMN ERIKSSON EESTI AS* 19,233 295 98.4 336 603 342 26.3 353 5.5 364 27,323 81 2,748 98 309 290 11.5%327 ENERPOINT SAARE OÜ* 137,000 126 129.2 160 4,461 208 102.0 245 20.2 300 12,215 309 901 275 370 11.5%328 MR STUUDIO OÜ 11,439 329 104.5 316 617 339 119.0 197 18.5 312 14,585 267 572 335 1,058 233 11.4%329 302 309 NEFAB EESTI AS 166,227 110 98.0 338 6,754 181 51.4 339 13.9 333 20,606 164 1,319 208 3,304 159 11.3%330 343 278 SWIPE EESTI OÜ* 3,186 366 118.5 237 706 335 98.8 257 45.7 141 6,321 366 1,062 247 368 11.3%331 204 129 V.V.TRAVEL AGENCY OÜ 9,063 339 132.9 137 268 359 91.1 274 38.4 172 7,248 361 4,531 61 285 297 11.2%332 184 221 LOKSA LAEVATEHASE AS* 701,046 38 134.8 129 2,928 246 16.6 355 1.2 372 18,535 197 1,089 242 39,972 44 11.2%333 NURMIKO AS* 99,995 150 129.2 161 7,387 169 83.5 289 14.0 332 13,208 294 885 277 43,215 40 11.2%334 253 296 ARHDISAIN OÜ 50,833 211 118.0 243 1,229 310 57.2 334 20.5 298 16,350 235 5,648 43 244 309 11.2%335 472 MASS AS 40,834 233 105.9 311 8,729 154 89.0 280 32.3 222 10,360 331 5,833 39 2,686 171 11.1%336 339 VÄRVIMEISTER OÜ 8,292 342 149.8 83 111 371 121.8 190 13.1 336 10,327 332 638 320 23 353 10.9%337 SUWEM AS 42,347 229 152.8 66 3,050 243 152.5 134 25.5 265 2,777 374 706 309 2,458 178 10.9%338 340 313 MELECO AS 111,839 141 114.7 262 7,001 173 75.6 304 22.7 285 13,287 290 1,086 244 1,437 212 10.8%339 ENGLO OÜ 4,128 361 82.2 368 737 333 62.4 327 32.8 216 15,726 244 688 311 55 341 10.8%340 391 449 ÕNNE PIIMAKARJATALU OÜ* 25,917 273 101.9 329 3,736 225 95.5 264 10.8 351 16,727 225 603 327 8,887 106 10.8%341 SVEBA-DAHLEN OÜ 28,788 265 141.6 111 1,374 303 33.1 213 13,920 282 600 328 16,057 75 10.6%342 57 321 SCHÖTTLI KESKKONNATEHNIKA AS 37,080 242 78.6 369 3,746 223 86.4 285 37.5 182 10,788 326 2,060 138 2,323 182 10.5%343 TERMIKS GRUPP OÜ 4,907 356 107.7 306 599 343 69.5 313 30.4 233 12,047 310 2,453 115 614 263 10.5%344 INLOOK COLOR OÜ 29,650 262 120.1 227 3,112 240 11.2 347 22,261 137 1,140 233 683 259 10.4%345 345 319 RAJA K.T. OÜ 47,129 218 130.1 151 4,541 205 81.0 296 26.7 258 9,159 345 1,571 173 5,500 131 10.4%346 317 402 MERINVEST OÜ 135,983 127 121.0 220 3,884 217 50.9 340 18.8 311 14,663 264 632 321 1,860 195 10.3%347 268 438 NITTIS OÜ 145,435 120 120.4 225 16,939 109 73.1 309 22.8 284 9,150 346 1,889 147 16,428 73 10.1%348 296 215 LEKU METALL AS 9,647 336 103.1 324 432 353 82.2 293 13.8 334 15,344 251 643 318 552 266 10.0%349 44 NURMIKO AIANDID OÜ 30,082 260 129.9 153 1,198 313 66.6 321 26.6 259 9,965 337 579 333 92 329 10.0%350 TSM AS* 35,890 246 82.2 367 6,899 177 93.6 270 9.2 358 16,357 234 2,393 119 47 350 9.9%351 251 445 PEETRI PUIT OÜ 33,981 250 63.5 374 6,170 189 79.6 300 33.0 215 11,792 313 944 267 13,700 85 9.8%352 127 462 MOBI SOLUTIONS OÜ* 18,439 304 127.8 167 844 330 30.6 350 19.8 305 15,132 253 802 292 95 328 9.8%353 336 412 K.MET AS* 37,227 239 111.1 286 2,095 274 65.0 324 15.5 324 14,315 273 483 351 4,920 137 9.7%354 368 SAAREMAA TARBIJATE ÜHISTU TUÜ 619,366 47 123.6 197 2,582 253 32.2 348 4.1 366 10,935 318 1,329 207 101,900 23 9.7%355 320 340 VÄNDRA TARE AS 31,365 256 102.9 325 1,804 283 90.8 275 34.9 197 6,323 365 729 306 2,693 170 9.5%356 EESTI MUNATOOTED AS* 45,500 223 119.8 229 452 350 21.9 290 16,369 233 2,167 130 770 253 9.5%357 369 430 EESTI TEKSTIIL AS 23,905 282 92.0 356 1,732 290 99.0 256 16.8 320 11,926 312 613 325 176 314 9.4%358 ASSOTRANS AS 36,339 244 90.8 358 3,373 233 47.3 135 10,729 327 498 349 6,723 118 9.3%359 MS BALTI TRAFO OÜ 41,209 232 102.8 326 4,643 203 75.7 303 16.7 321 12,283 305 280 367 2,942 167 9.3%360 407 338 RÄPINA PABERIVABRIK AS 17,670 306 129.3 159 2,247 263 84.1 288 11.3 346 9,884 338 465 355 2,604 173 8.9%361 MIKARE BALTIC OÜ 3,178 367 112.5 277 53 372 44.7 342 27.3 256 9,145 347 530 343 415 279 8.4%362 389 418 MEENED OÜ 2,714 368 161.2 48 178 367 62.2 328 14.2 331 6,925 364 151 373 375 8.4%363 422 VIRTEL GRUPP OÜ 14,569 314 130.2 150 350 356 61.0 332 8.6 359 10,729 328 662 315 1,119 229 8.2%364 295 KLIKO OÜ* 18,779 299 78.6 370 501 347 38.7 346 15.3 327 14,340 272 2,683 107 1,136 228 7.9%365 420 SILVA-AGRO AS 25,872 274 112.1 279 217 363 115.1 206 3.9 367 7,428 358 761 301 940 242 7.6%366 326 286 EKSEKO AS* 339,045 68 105.0 312 10,995 138 15.8 356 3.6 368 12,702 298 1,813 153 22,593 63 7.5%367 SANGLA JUVEELISALONG AS 7,457 346 109.2 299 279 358 65.5 322 10.6 355 9,552 341 932 271 15 355 7.4%368 180 217 RIIGIRESSURSSIDE KESKUS OÜ* 61,977 190 112.0 281 40,238 61 38.9 345 5.9 363 9,071 350 3,099 86 18,383 69 7.3%369 372 436 KAJAX FISHEXPORT AS 49,777 212 91.9 357 2,252 262 84.9 287 9.5 357 8,892 351 1,464 184 2,368 180 7.3%370 SAKU TEHNO AS 3,477 364 111.2 284 154 370 26.8 352 20.8 296 9,413 343 290 366 230 310 7.3%371 17 350 SAARE EREK AS 53,001 204 86.7 364 1,607 295 15.8 357 10.7 353 13,842 284 576 334 4,010 147 6.8%372 413 ESPAK PÄRNU AS 46,870 219 127.3 172 719 334 3.3 360 2.3 369 12,639 300 1,267 217 7,376 111 6.5%373 PR FIRMAREKLAAM OÜ 9,248 337 107.4 307 16 375 31.0 349 0.4 374 12,516 301 661 316 60 340 6.2%374 400 TÕRVA ELEKTER AS 16,115 311 93.9 349 1,769 287 61.5 330 10.8 352 7,237 362 1,007 258 296 294 6.1%375 417 TNC-COMPONENTS OÜ 97,645 152 90.6 359 462 349 10.7 359 1.8 370 12,381 303 827 288 270 302 5.4%1 EUR = 15.6466 EEK; 1 EEK = 0.0639 EUR; based on 2007 data See also www.konkurents.eeNovember 200843
Competitiveness Ranking 2008The Most Competitive Enterprise 2008The Most Competitive Tourism Enterprise 2008TALLINK GRUPP ASServing customers steadilyTallink has seemingly reached a stabileera. During the last 18 months, threenew ships have started operating the routes, anew sales system is fully operational and thenumber of passengers is increasing. Nevertheless,a member of the Tallink managementboard, Andres Hunt, says that in an enterprisethat large there is never a chance to sit idly andwatch the world go by. Hunt has been workingin Tallink for the past 10 years and according tohim there has not been a time to just sit backand rest...“The next two years could be a bit more laidback,but in the long run we aim to continueexpanding. Looking at the map, it is not impossible– there is plenty of space. In this regionwe have reached a position where there isnowhere to go further from, the share of themarket is already that big. We cannot buy upany of our competitors; it would clash with thecompetition regulations. What will become ofSt Petersburg? – that is the question! We triedto enter that market once, but it was a lostcause from the start, due to bureaucratic visaregulations. Travelling is so simple nowadaysthat you simply could not imagine waiting fora visa for two months and giving away yourpassport, for instance,” says one of the membersof the board of the enterprise.Andres Hunt, “There’s plenty of roomfor progress!”PHOTO: TOOMAS TUUL44November2008
TOP ESTONIAN ENTERPRISES 2008In the winds of fluctuating fuel prices“We were satisfied with last year’s figures, butour fiscal year is a bit different than usual andit starts in August. We are currently not expectingthe figures to be as good, because nooneknows how much the fuel prices will keeprising. If that difference did not exist, we couldmaintain the same level, but we could not foreseeit to be as brutal,” Hunt says worriedly.A simple calculation will show that comparingthe first nine months of this year to the sameperiod of last year indicates a 600 million kroonincrease in fuel costs. “That is a very bigamount”, Hunt admits.Of course it is possible to build the ships to bemore economical and the engine manufacturingfacilities are already taking it into account,but that difference is not as big as between a carwith a petrol or diesel engine. “When a shipsails every day, the difference will definitely benoticeable. Another matter is what kind of fuelsare used: it is common to use the more expensivediesel fuel in the donkey engines of olderships and ship fuel in the main engines; it ispossible to build the newer ships in a way thatthey sail only on ship fuel.“ It is not possible toincrease the ticket prices because the competitionis too heavy and so the enterprise just hasto accept the losses and hope for the fuel pricesto stabilize. Hunt says that they have tried toadd a fuel surcharge, but because of the toughcompetition nothing has changed much. Thefact that it is possible to get to Helsinki with300 kroons has been a reality for a long time.He had checked only recently that in 1997, theprice of a ticket of a Tallink high-speed ferrywas 400 kroons. Competition has thus done itslong and thorough job.Transition to the new booking systemA significant part of last year was spent onpreparations for a common booking and checkinsystem with Silja Line. Large transition costswere a part of it and finally, in October last year,it was successfully launched. Tallink used anexisting system of Silja Line, but of course ithad its own difficulties and initially everythingdid not run as quickly as the enterprise hadwanted. “Because it is an online-system and wehave almost 20 000 passengers on a daily basis,it is a rather heavy load. Our business partnerswere not used to the new system yet and consequently,we had a slightly smaller amount ofpassengers in autumn, but in general it is safe tosay that the integration process with Silja Linehas been a great success,” Hunt says.Looking at the figures, Hunt says that this year,there will definitely be more than 7 million passengerson Tallink ships. Thus far, that numberhas not decreased in any given year. In a situationlike that it is natural to constantly offer newexperiences for the potential passenger. A newship is also a new experience and besides thelatest additions like Star, Superstar and BalticPrincess, another one is being built – a vesselthat will start operating in 2009. Currently,Tallink has altogether 19 operating ships. “Duringthe coming years we can concentrate moreon sales and the operating of the ships. Thesituation in the shipbuilding industry haschanged as well. The building periods have becomea lot longer and the prices have increased.After the terrorist attacks in September 2001there was a break in shipbuilding, there werefew orders. But now the building boom is backand currently it takes almost three years to geta new ship, even though it used to be two years.Luckily, we have managed to cover all routeswith the new ships and currently there is no directneed for more ships.”From the chat with Andres Hunt it becomesevi dent that a new ship influences the amountof passengers simply because of their curiosity– people will want to come and see the newmeans of travel. In a way, two different productsare offered: one is fast transport – twohours and you are there. A totally differentthing is entertainment. The Tallinn-Stockholmroute has more pure entertainment and historyhas shown that there are plenty of people wholook for entertainment. Naturally, somethinghas to be offered to the passengers. Hunt is certainthat it does not depend only on the beautifulTallink ships, but also on what ishappening in Tallinn, for instance. Last year,when prices in our capital went up rather suddenly,it had an immediate effect on the amountof passengers. The reason for this was prettysimple – the main Finnish customers of Tallinkare very price-sensitive and they started to reconsiderwhether it would be worth coming tospend time in Tallinn and to pick up somegoods. Andres Hunt admits that in this case,other ways must be found to attract the customers.Thus, the enterprise already owns andoperates three hotels and the tourist knows exactlywhat they are getting, and in the end boththe service provider and the consumer aresatisfied.Since 2002 when the first new Tallink ship, Romantika,started operating, the enterprise beganoffering a solution where the ship itself has asmany services as possible. “The passenger hasto be able to work, rest, dance, go to restaurantsand saunas – all these options have to be available.A ship is a closed space, the passengercannot disembark and we have to take into accountthat there are passengers with all sorts ofdifferent interests together. Our ships havechanged much like the airport, for instance –the ship themselves are bigger, the commercialareas are getting larger. Whenever there is a callfor it, we change the conference rooms intochildren’s play areas in the summer and wechange them back later. Multifunctionality isimportant.“Difficulties with labour forceI am doing the interview with Andres Hunt ata time when there are difficult negotiationsgoing on. The workers’ unions demand a raiseand the negotiations have reached a pointwhere they have to go to the Public Conciliator.Hunt says that they will try to negotiate asmuch as possible. “People’s income at seashould be higher than that on land, and it is,but we have to take into account the Estonianeconomic situation and we can see what we canreach and what not. In any case, we are tryingto reach a compromise.”One of the members of the board of the enterpriseadmits that the situation has calmed downin the labour force market this year, the bigboom of payrises is over and staff volatility hasstopped. Employees are not running as muchafter bigger paychecks anymore. Despite the inevitableincrease in labour force costs, the companyhas not given up on big marketing plans,and work will be continued on them.The enterprise is trying to be more efficient insales and marketing, partners are included aswell – there has been co-operation with othercompanies and that helps to share the costs.Advertising Tallinn will benefit everyone, it isnot the interest of just one company. Hunthopes that the economic growth that is fluctuatingon the negative side this year as well doesnot influence Tallink very directly, because thecompany is directed more to the outside of theEstonian market and the main customer is neverthelessthe export customer. “As long as wecan make Tallinn attractive, all will be well.”TALLINK GRUPP AS 2007Sales (th EEK) 11,903,286Change in sales 188%Net profit (th EEK) 1,049,287Change in net profit 70.6%Number of employees 6,227Investments (th EEK) 2,206,000Return on equity 10.9%November 200845
TOP ESTONIAN ENTERPRISES 2008PHOTO: TOOMAS TUULTourism enterprisesPLACESALES CHANGE NET PROFIT CHANGE RETURN LABOUR COSTS EFFICIENCY PER INVESTMENTS % OFENTERPRISE IN SALES IN NET PROFIT ON EQUITY PER EMPLOYEE EMPLOYEE THE FIRST* group TH EEK PLACE % PLACE TH EEK PLACE % PLACE % PLACE EEK/month PLACE TH EEK PLACE TH EEK PLACE (0 .. 100)1 TALLINK GRUPP AS* 11,903,286 1 188.0 1 1,049,287 1 70.6 10 10.9 10 33,151 1 1,912 2 2,206,000 1 100.0%2 SETOMAA TURISMITALO OÜ 1,476 9 122.8 5 2,215 5 138,365.8 1 174.6 1 6,320 9 246 11 120 10 47.7%3 LUHTRE TURISMITALU OÜ 1,288 10 185.8 2 519 8 105.6 6 172.6 2 6,038 10 429 10 304 8 39.8%4 V.V.TRAVEL AGENCY OÜ 9,063 7 132.9 4 268 10 91.1 7 38.4 6 7,248 8 4,531 1 285 9 35.5%5 360 KRAADI OÜ 3,205 8 150.6 3 1,050 7 277.7 2 86.7 4 10,098 6 458 9 359 6 31.3%6 ESTRAVEL AS* 117,310 2 106.0 10 23,430 2 77.7 8 38.2 7 23,645 3 556 5 2,374 2 24.6%7 KALEVA TRAVEL AS 39,644 4 106.4 9 5,049 4 77.4 9 24.7 9 24,638 2 478 8 324 7 23.0%8 ORU HOTELL OÜ 14,940 6 110.4 8 1,948 6 115.4 4 40.7 5 14,956 4 482 7 603 5 20.2%9 ESTONIAN NATURE TOURS (KUMARI REISID OÜ) 1,006 11 64.6 11 516 9 169.6 3 2,760 11 503 6 9 11 19.0%10 STRAND AS 61,955 3 119.0 6 13,553 3 137.4 3 31.0 8 10,825 5 558 4 1,599 3 18.9%11 SILVA-AGRO AS 25,872 5 112.1 7 217 11 115.1 5 3.9 11 7,428 7 761 3 940 4 13.1%1 EUR = 15.6466 EEK; 1 EEK = 0.0639 EUR; based on 2007 data See also www.konkurents.ee
Competitiveness Ranking 2008The Most Competitive Small and Medium-sized Enterprise 2007KAAMOS KINNISVARA OÜA young enterprise notafraid of ambitious projectsReal estate is a favourite topic for manypeople; a lot of them even considerthemselves to be experts – from agents andhousewives to bus drivers. Real estate is one ofthose fields of activity where competition hasbecome tougher and tougher during recentyears. Hence it is even more difficult to stay inthis complicated and often unsteady market.Kaamos Kinnisvara has succeeded to stay. PriitUustulnd, the CEO of Kaamos Kinnisvara, admitsthat even though he himself ended up inreal estate by chance, the company’s ability tostay in the market has definitely not been accidental.“The slowing-down process of economicgrowth has influenced all enterprises,that can definitely not be denied. Based on thecurrent situation of the economy and thespecifics of our field of business, we weighedKaamos Kinnisvara belongs to KaamosGroup that was founded in the year2003. The company is mainly involvedwith real estate development and propertymanagement services. During thefive years in business, the company hasacquired several significant registeredimmovables with a lot of potential; andon many of those registered immovablesthe development activities have successfullyended and all in all, the projectshave been realized. The biggest projectsthat Kaamos Kinnisvara is working onthis year are Tammsaare Business Centrein Mustamäe, Tallinn; and the commercialand residential land in Filtri tee,Tallinn.PHOTO: TOOMAS TUULPriit Uustulnd, Manager of KaamosKinnisvara prefers to use the termsbalancing or normalization to characterizethe current real estate market.November 200847
TOP ESTONIAN ENTERPRISES 2008over the starting of different projects and wemapped the risks that could occur with one objector another. Our business strategy was todevelop commercial real estate and maintainingliquidity in the financial aspect, so that wewould have a better playing field in the toughereconomic climate. We also managed to keepfrom premature development activities, whichtoday would have definitely influenced thebusiness as a whole,” Uustulnd says.The CEO was surprised that in the secondquarter of last year, there was almost anovernight change regarding residential real estateand it influenced a lot of the real estatecompanies.Last year, they started the construction, developmentand lease of Tammsaare Business Centreand developing an apartment building on10 Jalaka Street in Pärnu. The company’sbiggest development project so far,K-Rautakesko, was sold successfully. Two landunits of Kaamos Kinnisvara (one near Riga andthe other on Kadaka tee in Tallinn) were issueddetailed plans. The Männisalu apartment buildingsproject was ended, the registered immovablesof Valmos technopark in the ruralmunicipality of Audru in Pärnu County weresold, and the large housing project in the ruralmunicipality of Ülenurme in Tartu County wassold as well. Selling residential plots in theresidential district of Mäekuninga in Viimsicontinued in the same way.The real estate market is not fallingTo characterize the current real estate market,Priit Uustulnd prefers to use the terms balancingor normalization. He is convinced thatwhen there is a demand on the customers’ sideand it is supported by cheap loan money thatacts as a catalyst, the market will act based onthe principle of price, not value. By now, thewinnowing process has been successful. Theprojects that are doing well are those that havebeen meticulously planned, stand out amongthe rest and have reasonable prices. The competitionis tougher and only the customer winsin such situations.”Certainly it is more difficult to find to customertoday than it was two or three years ago,you have to do more work. Being hard-workingis one of the keys for success of the KaamosKinnisvara team; we tried not to go along withcheap solutions and convenient circumstanceson the wave of getting rich quickly.”Uustulnd is especially proud of starting the developingof the biggest office building in Estonia,Tammsaare Business Centre, and signinglease contracts with reputable tenants, who inturn value the created environment highly. Theproject itself was a success because they managedto find a concept that works, and a prerequisitefor that was excellent teamwork. “Wetried not to go along with the general euphoricfeel of the real estate market and adhere to ourspecific vision: to invest in quality,“ the CEOsays. Tammsaare Business Centre is the biggestinvestment of last year for the company. A substantialanalysis was done to determine whetherto invest money in the project or not. Finally,there came the sense of recognition that Tallinnneeds an office building exactly like that. “Weare a relatively young company in the marketand considering the ambitiousness of theproject, it was an extremely bold move,”Uustulnd says.The team is the biggest strengthThe CEO firmly states that the Kaamos team istheir biggest strength. „We are all team playersand important strategic decisions are the resultof the intensive work of the team. The creationof Kaamos Ehitus has had a very big part toplay, and efficient co-operation between the twoenterprises has also been important. Our goal isto offer our customers complete developmentand construction solutions.”One of the principles of Kaamos is that whenthe enterprise is doing well, its employees willbe doing well too. The executives are paid inaccordance with their position and there is anincentive bonus based on results.The team has been put together firstly based onthe people’s professional skills and secondly ontheir characteristics, which are both extremelyimportant for synergy to evolve.Specific vision and clear-cut managementKaamos Kinnisvara’s vision is to be one of thebest real estate development enterprises in Estonia.Thanks to the investments made at theright time, the company is hoping to have workin Estonia for at least 5-10 years. Thus far, thecompany has been relatively Estonia-centred inits investments, although they have invested inBulgaria and Latvia as well. In the future, thecompany wishes to grow out of Estonia and operatemore in foreign markets.A wide grasp and ambitious plans demand firstclassleadership and the ability to see the bigpicture. Among other things, the director of agood enterprise must be an excellent teamplayer. “Self-management and the ability todelegate are also important: for the best decisionto arise there are too many important factorsfor only one person to consider.Consequently, it is important to gather a strongteam around you. Good skills of self-expressionand listening are no less important. Consideringwhat demands our field of work has, themost important parts are experience and the socalledmarket sense, because our people willlearn a lot through work.”Speaking of the tasks of the government, Uustulndthinks that the cornerstone of the successof Estonian entrepreneurship has been our taxpolicy and in the current situation they shouldnot deviate from that direction.”On the other hand, both the government andthe local governments could fulfil the dutiesimposed on them by law, and not delegate themto private enterprises. Especially today, whenthe profit margins in entrepreneurship have decreasedand some not foreseen additional workimposed by the local government can very wellbe more than an entrepreneur could handle.Ideally, the government should gather itsstrength during the time of economic growthand the government and the local governmentsshould order all large projects and procurementsduring the slowing-down time of economicgrowth. I would like to emphasize onceagain that it is an ideal to strive for.”Uustulnd thinks that in the long run, Estoniawill only benefit from the slowing down of theeconomic growth. It will make people thinkand make each individual work harder towardsa better goal. In the end, it will benefit everyone.KAAMOS KINNISVARA OÜ 2007Sales (th EEK) 142,625Change in sales 174.8%Net profit (th EEK) 148,913Change in net profit 73.5%Number of employees 20Investments (th EEK) 90,528Return on equity 37.3%Place in the CompetitivenessRanking 2008 9048November2008
TOP ESTONIAN ENTERPRISES 2008Small and Medium-sized EnterprisesPLACESALES CHANGE NET PROFIT CHANGE RETURN LABOUR COSTS EFFICIENCY PER INVESTMENTS % OFENTERPRISE IN SALES IN NET PROFIT ON EQUITY PER EMPLOYEE EMPLOYEE THE FIRST* group TH EEK PLACE % PLACE TH EEK PLACE % PLACE % PLACE EEK/month PLACE TH EEK PLACE TH EEK PLACE (0 .. 100)1 KAAMOS KINNISVARA OÜ* 142,625 2 174.8 19 148,913 1 73.5 154 37.7 101 32,337 15 7,131 10 90,528 1 100.0%2 WIRTGEN EESTI OÜ* 102,700 10 184.3 15 6,569 38 100.0 122 58.8 61 55,796 2 17,117 1 330 118 71.9%3 VARMAPARTNER OÜ 22,645 107 265.4 7 3,237 72 3,404.7 1 187.3 2 19,223 79 11,322 4 2,482 45 71.2%4 PERI AS 135,046 3 158.2 32 46,314 2 134.8 84 41.2 92 40,216 6 4,092 22 48,131 3 71.0%5 TARTU EHITUS AS 128,691 5 171.1 21 14,748 10 642.1 6 156.8 8 19,781 74 3,785 26 476 109 66.3%6 BETOONIMEISTER AS* 144,800 1 152.7 37 6,585 37 53.9 168 26.0 141 31,241 17 3,017 37 68,400 2 63.5%7 AF-ESTIVO AS 66,485 26 666.5 2 2,981 80 545.4 8 87.8 23 25,544 38 3,499 30 49 171 60.1%8 PAG AS 72,444 21 242.2 8 10,460 19 346.3 22 136.0 10 20,959 62 10,349 5 479 108 58.9%9 NORES PLASTIC OÜ 85,012 16 96.8 173 2,866 81 67.8 158 30.8 128 26,399 35 17,002 2 52 168 52.1%10 UWEKO AS 105,051 7 114.1 129 15,731 9 168.4 61 37.9 99 25,669 37 9,550 7 178 50.2%11 TELEGRUPP AS 114,815 6 147.2 51 11,156 16 212.8 44 67.7 49 34,528 13 2,944 40 811 88 49.5%12 COMBIFRAGT EESTI OÜ 92,120 12 141.6 62 9,231 23 415.6 16 76.2 36 23,736 49 4,387 19 149 142 48.8%13 REMEI BALTICA OÜ 23,285 103 139.8 67 4,187 56 157.0 71 74.1 41 68,337 1 5,821 14 769 93 48.6%14 EXCELLENT GRUPP AS 47,237 45 143.9 57 15,811 8 134.6 85 40.2 94 22,074 56 15,746 3 53 166 48.1%15 NET GROUP OÜ 91,571 15 180.6 17 6,966 34 289.5 28 107.6 14 24,851 42 2,954 39 2,198 50 47.8%16 AR AGENTUURI AS 27,033 88 122.0 105 1,788 111 1,391.3 4 74.3 40 22,955 54 1,502 84 1,037 78 46.0%17 KEMIFLORA AS* 133,163 4 117.1 121 10,925 17 123.3 95 29.2 132 28,937 24 3,599 27 2,220 49 45.8%18 FAGEL OÜ* 71,592 22 140.8 65 6,112 44 225.0 43 85.7 25 35,016 12 3,254 33 877 87 43.8%19 AEK OÜ 76,461 20 184.0 16 9,735 22 255.9 33 95.9 18 20,824 65 4,024 24 224 135 43.5%20 SYSTEMAIR AS 104,913 8 121.7 108 10,569 18 112.4 107 32.7 123 27,112 32 5,829 13 126 147 43.1%21 SETOMAA TURISMITALO OÜ 1,476 189 122.8 104 2,215 100 138,365.8 2 174.6 3 6,320 186 246 191 120 149 42.0%22 RUSSIAN ESTONIAN RAIL SERVICES AS 65,389 27 45.0 192 38,670 4 37.5 175 12.4 170 37,725 10 7,265 9 179 41.5%23 ASPERAAMUS OÜ 68,414 25 149.2 49 1,204 134 250.7 38 57.5 64 9,137 169 9,773 6 3,606 32 41.4%24 SKS VÕRU OÜ 92,286 11 99.1 168 3,740 65 41.2 171 22.1 148 39,665 7 5,768 15 429 112 41.3%25 TELORA-E AS 51,652 39 150.7 44 13,618 11 132.3 88 94.0 20 39,258 8 1,435 91 4,711 23 40.3%26 SCHETELIG EV AS 102,838 9 114.0 131 10,371 20 111.4 109 24.4 144 30,997 18 3,546 28 508 106 40.1%27 TVS PARTNERID AS 24,424 97 291.3 6 1,864 109 523.5 10 108.7 13 20,710 67 1,285 98 134 145 39.8%28 LRF PRIVATE OÜ 12,451 143 1,491.3 1 1,119 137 43.8 88 18,300 86 3,113 34 269 128 39.4%29 BDA CONSULTING OÜ 14,376 134 120.6 111 2,842 82 628.3 7 165.8 6 16,513 102 1,106 117 60 160 39.4%30 LOODESYSTEM OÜ 62,935 29 160.0 28 2,227 99 353.7 20 73.6 42 24,385 44 1,614 79 3,376 33 38.7%31 TRETIMBER OÜ* 91,676 14 150.4 46 7,895 28 183.6 54 19.6 157 15,848 108 2,778 44 17,248 6 37.9%32 NURMIKO HULGI OÜ 80,463 19 129.2 89 3,525 68 252.3 36 83.8 26 17,057 94 2,117 65 1,546 62 37.1%33 HAKA PLAST OÜ 56,483 35 158.4 31 3,747 63 244.9 39 91.9 21 16,654 99 3,530 29 698 96 35.9%34 KRAPESK AS* 36,107 66 97.2 171 27,002 6 444.2 14 82.3 30 18,102 88 737 153 2,167 53 35.7%35 PARKLI HL OÜ* 13,835 137 101.3 166 2,162 101 4,239.2 3 21.8 150 13,540 140 922 136 4,037 27 35.6%36 AJ TOOTED AS 34,468 70 115.3 126 8,479 27 122.1 96 55.6 69 25,535 39 6,894 11 5,808 20 35.4%37 HORECA SERVICE OÜ* 81,719 18 129.4 85 4,399 53 102.1 120 76.0 37 20,592 68 2,724 48 1,650 59 35.3%38 ICEFIRE 29,663 80 132.5 76 9,047 24 168.2 62 68.8 46 45,068 4 1,211 106 774 91 35.1%39 IKODOR AS 56,791 34 152.0 41 18,247 7 201.4 49 58.3 62 16,574 101 2,184 63 9,280 14 34.7%40 LINXTELECOM ESTONIA OÜ 68,501 24 151.5 42 2,479 88 11.6 173 35,557 11 2,740 46 14,608 9 34.7%41 BORTER TRADE OÜ 7,068 166 131.8 78 265 179 93.3 134 294.0 1 10,300 160 1,178 110 268 129 33.6%42 GEA WTT BALTICS OÜ 32,816 72 152.7 38 1,470 123 112.2 108 38.6 96 40,750 5 4,102 20 155 141 33.4%43 VIPEX AS 91,849 13 97.5 170 9,912 21 154.2 72 19.7 156 17,257 93 2,870 43 2,488 44 33.0%44 INTEREXPRESS EESTI OÜ 39,841 58 119.8 114 609 160 189.9 51 83.6 27 21,546 59 3,984 25 3,846 29 33.0%45 CV-ONLINE ESTONIA OÜ 22,943 106 93.5 176 29,805 5 272.7 30 75.1 38 28,917 25 740 152 266 130 32.6%46 ROVICO BÜROO OÜ 11,703 146 152.7 39 3,103 78 253.8 34 105.0 16 28,649 27 2,703 51 27 174 32.5%47 KALTSIIT AS 49,719 44 123.5 99 12,539 14 117.7 103 35.7 109 26,441 34 1,243 104 15,350 8 31.9%48 MARFIN PANK EESTI AS 50,840 41 155.7 35 2,242 96 64.3 162 1.1 191 46,215 3 1,640 76 3,268 35 31.8%49 ESTANC AS* 58,035 32 144.4 55 5,687 46 226.0 42 57.3 65 20,580 69 1,382 96 1,853 55 31.6%50 WELLSPA OÜ* 64,442 28 111.0 141 13,408 12 125.4 93 62.9 57 19,041 80 2,079 67 1,000 80 31.3%51 SONA SYSTEMS OÜ 4,098 180 163.8 25 1,780 112 393.2 17 107.5 15 12,336 145 4,098 21 1,007 79 31.2%52 ABSINT OÜ* 36,383 65 295.8 5 6,314 41 141.9 78 67.8 48 17,393 92 1,915 71 5,000 22 31.1%53 RIIGIRESSURSSIDE KESKUS OÜ* 61,977 30 112.0 137 40,238 3 38.9 173 5.9 186 9,071 171 3,099 35 18,383 5 30.9%1 EUR = 15.6466 EEK; 1 EEK = 0.0639 EUR; based on 2007 data See also www.konkurents.eeNovember 200849
TOP ESTONIAN ENTERPRISES 2008Small and Medium-sized EnterprisesPLACESALES CHANGE NET PROFIT CHANGE RETURN LABOUR COSTS EFFICIENCY PER INVESTMENTS % OFENTERPRISE IN SALES IN NET PROFIT ON EQUITY PER EMPLOYEE EMPLOYEE THE FIRST* group TH EEK PLACE % PLACE TH EEK PLACE % PLACE % PLACE EEK/month PLACE TH EEK PLACE TH EEK PLACE (0 .. 100)54 FORANKRA BALTIC OÜ 35,617 68 108.8 147 6,399 39 171.8 58 41.7 90 33,597 14 2,740 47 513 105 30.8%55 TERG OÜ 57,050 33 137.6 71 1,455 124 99.6 125 13.0 169 29,149 23 4,075 23 1,211 68 30.7%56 EXXI AS 12,335 145 164.9 24 2,318 90 162.7 67 56.8 66 37,957 9 3,084 36 106 150 30.7%57 ROOTSI MÖÖBEL AS 83,957 17 119.1 116 12,592 13 81.0 146 31.2 127 15,734 110 1,908 72 3,814 30 30.3%58 BENEFIT AS 46,507 49 116.4 122 5,364 48 122.0 97 44.1 87 30,952 19 2,215 62 952 82 30.1%59 FINLAID OÜ 44,548 52 92.5 178 1,334 126 416.4 15 65.0 54 7,991 175 2,345 59 4,381 25 30.0%60 FINNLAMELLI EESTI OÜ 50,916 40 125.5 96 4,457 52 142.0 77 83.4 28 20,974 61 1,455 88 1,405 63 30.0%61 CENTRALPHARMA COMMUNICATIONS OÜ 20,598 110 129.6 84 1,265 131 373.8 18 50.2 73 28,583 28 981 128 3,046 37 29.9%62 K-PRINT OÜ 24,343 98 143.0 58 3,436 69 171.7 59 57.8 63 31,582 16 1,281 100 6,420 19 29.4%63 TALENT PLASTICS EESTI AS 43,858 53 167.7 22 3,581 67 130.8 90 65.5 51 10,872 153 933 133 23,083 4 29.3%64 ALISTAR GROUP OÜ* 37,389 61 112.8 134 383 173 80.3 149 49.4 75 16,944 96 7,478 8 43 173 29.2%65 VIRAITO OÜ 13,837 136 108.7 148 5,975 45 543.4 9 54.3 70 14,761 123 814 143 6,747 18 29.1%66 SOVEK AS 54,552 36 132.1 77 4,355 54 130.6 91 63.6 56 20,717 66 1,399 94 1,750 57 28.8%67 LUKU SERVICE OÜ 26,095 91 126.5 93 2,837 83 131.7 89 82.4 29 25,948 36 2,899 42 180 28.8%68 FRIENDS TEXTILE OÜ* 43,692 54 123.2 102 7,563 30 146.2 75 45.7 83 24,140 48 2,570 55 566 102 28.7%69 TOPAUTO RAKVERE OÜ 32,764 73 126.1 95 918 146 152.2 9 14,718 124 3,276 32 89 155 28.6%70 VÄRSKA VESI AS 69,502 23 139.3 68 3,106 77 82.3 144 28.1 137 15,792 109 1,616 78 12,718 11 28.6%71 YIT EMICO AS 53,019 38 141.0 64 4,001 57 77.5 34 23,682 51 2,039 69 60 161 28.3%72 LASERSTUUDIO OÜ 4,690 175 186.7 13 435 171 165.5 7 28,426 29 938 132 188 28.2%73 GSMVALVE OÜ 13,362 140 419.6 3 1,051 139 159.7 69 79.8 33 15,234 117 1,028 123 1,250 66 27.9%74 KAESER KOMPRESSORIT OY EESTI FILIAAL 38,809 60 115.0 127 3,382 70 79.9 150 33.5 116 23,524 52 4,851 17 537 104 27.5%75 EFEKT AS 25,595 95 154.9 36 623 158 505.9 11 15.4 163 18,493 84 1,163 111 184 27.4%76 VABA MAA AS 30,528 78 111.3 139 945 143 473.1 13 4.8 188 21,750 57 803 144 3,365 34 27.1%77 GRT EESTI OÜ 17,275 128 114.2 128 2,289 91 334.6 24 32.2 125 30,886 20 1,152 112 185 27.0%78 WINDOOR AS 60,782 31 131.0 80 8,630 26 105.6 115 36.3 107 18,536 83 1,520 83 780 89 26.7%79 VÕRGUVARA AS 54,263 37 161.7 26 3,777 62 97.4 129 25.1 143 20,165 71 2,713 50 248 131 26.7%80 PLANSERK AS 26,715 89 172.1 20 2,267 93 116.4 104 28.9 135 27,855 30 1,571 80 9,678 13 26.6%81 TELCO AS* 26,323 90 139.2 69 5,006 49 157.1 70 59.7 60 25,044 41 1,385 95 2,173 52 26.3%82 A.KANGUST & PARTNERID OÜ 3,565 181 147.0 52 1,222 133 362.3 19 116.1 11 14,621 126 594 168 280 126 26.2%83 AIRWAVE OÜ 45,120 51 165.9 23 6,354 40 98.6 128 49.2 76 14,057 133 3,008 38 1,204 69 26.1%84 ARHDISAIN OÜ 50,833 42 118.0 118 1,229 132 57.2 167 20.5 152 16,350 106 5,648 16 244 133 26.0%85 KOMPRESSORIKESKUS OÜ 46,819 48 101.0 167 2,781 84 66.8 159 30.5 129 28,775 26 2,229 61 348 117 26.0%86 TIPTIPTAP OÜ* 19,617 113 158.5 30 2,760 85 211.5 45 108.8 12 14,718 125 1,032 122 247 132 25.9%87 MASS AS 40,834 57 105.9 154 8,729 25 89.0 139 32.3 124 10,360 158 5,833 12 2,686 40 25.7%88 FELITON OÜ 29,531 82 159.4 29 3,132 75 107.6 114 89.8 22 19,279 77 1,284 99 330 119 25.6%89 TERASVARA OÜ 12,338 144 123.4 100 855 149 652.1 5 16.6 161 12,244 146 514 175 2,756 38 25.6%90 KENTEK EESTI OÜ* 18,949 116 126.4 94 1,050 140 342.0 23 19.0 158 24,200 47 1,895 73 778 90 25.3%91 NELICO OÜ 41,984 55 146.7 53 3,868 60 179.8 56 48.9 78 13,630 139 1,135 115 3,215 36 24.4%92 ALUOJA OÜ* 37,086 63 131.1 79 7,308 32 139.6 81 37.3 105 13,211 141 3,371 31 1,176 72 24.3%93 HELMETAL IMS OÜ 22,987 105 197.0 10 3,335 71 134.4 86 77.2 35 13,992 134 1,197 107 4,389 24 24.1%94 EUREX CAPITAL OÜ* 29,224 83 157.4 33 12,005 15 149.0 73 65.2 52 15,627 113 769 149 1,238 67 24.1%95 VÄRVALTRANS OÜ* 32,285 74 142.9 59 5,515 47 168.6 60 56.0 67 15,638 112 922 135 2,490 43 23.5%96 ECOPRO AS* 41,215 56 121.8 107 6,633 36 139.8 80 37.6 102 18,258 87 1,178 109 1,143 73 23.4%97 NURMIKO AIANDUSKESKUS OÜ 12,810 142 110.6 142 1,165 136 295.7 27 95.5 19 12,995 142 801 146 379 114 23.3%98 AQRIS SOFTWARE AS 20,549 111 107.9 150 6,307 42 202.5 48 48.5 80 24,261 45 604 165 184 137 23.1%99 ELEKTRIMEES OÜ 22,400 108 152.6 40 2,241 97 165.4 66 69.7 45 15,579 114 1,723 74 182 23.0%100 SUJA EHITUS OÜ* 35,374 69 138.1 70 1,627 119 211.3 46 33.9 113 16,490 103 1,179 108 1,180 71 22.8%101 UKSEKODA OÜ 32,101 75 150.3 47 884 148 202.6 47 14.5 165 23,031 53 917 137 1,379 64 22.7%102 SUN TIMBER OÜ 13,525 139 151.4 43 1,180 135 484.1 12 62.7 58 3,370 190 294 188 947 83 22.2%103 PINTAVÄRI EESTI OÜ 19,052 115 101.7 165 2,136 103 95.3 131 37.9 100 25,443 40 2,722 49 667 98 22.1%104 CHEMI-PHARM AS* 30,873 77 116.0 124 4,259 55 182.9 55 34.0 112 20,182 70 965 130 355 116 22.1%105 LUHTRE TURISMITALU OÜ 1,288 190 185.8 14 519 165 105.6 116 172.6 4 6,038 188 429 182 304 121 21.8%106 PROFLINE AS* 25,260 96 113.7 132 2,122 105 99.8 124 35.4 110 23,736 50 2,105 66 54 165 21.7%50November20081 EUR = 15.6466 EEK; 1 EEK = 0.0639 EUR; based on 2007 data See also www.konkurents.ee
TOP ESTONIAN ENTERPRISES 2008Small and Medium-sized EnterprisesPLACESALES CHANGE NET PROFIT CHANGE RETURN LABOUR COSTS EFFICIENCY PER INVESTMENTS % OFENTERPRISE IN SALES IN NET PROFIT ON EQUITY PER EMPLOYEE EMPLOYEE THE FIRST* group TH EEK PLACE % PLACE TH EEK PLACE % PLACE % PLACE EEK/month PLACE TH EEK PLACE TH EEK PLACE (0 .. 100)107 EKTACO AS 23,745 102 102.4 162 2,128 104 124.3 94 39.5 95 26,919 33 879 139 700 95 21.7%108 ET TOREL OÜ 22,106 109 126.8 92 4,474 51 160.0 68 65.0 53 14,874 122 819 142 1,709 58 21.1%109 HAMMER SERVICE OÜ 6,390 169 103.9 159 658 156 296.2 26 46.7 82 19,255 78 1,420 92 49 170 21.1%110 ORGITA PÕLD OÜ 23,022 104 140.6 66 7,416 31 141.0 79 29.5 131 14,557 130 767 150 10,903 12 21.0%111 ISIS MEDICAL OÜ* 27,528 87 129.4 86 1,706 118 109.6 112 49.0 77 14,355 131 2,503 56 134 146 20.9%112 DATA PRINT OÜ 18,561 122 179.4 18 1,565 122 74.8 39 19,833 73 1,237 105 943 84 20.6%113 RAJA K.T. OÜ 47,129 46 130.1 82 4,541 50 81.0 147 26.7 140 9,159 167 1,571 81 5,500 21 20.3%114 PRO FIKSUM OÜ 9,193 157 119.5 115 2,556 86 253.3 35 101.3 17 3,012 191 1,532 82 1,334 65 20.2%115 BCS ITERA AS* 18,593 121 86.9 184 1,310 129 51.5 169 41.5 91 30,501 21 1,033 121 141 143 20.1%116 REALISTER OÜ 6,987 167 333.6 4 609 161 144.9 76 67.9 47 7,283 179 873 140 464 110 20.0%117 360 KRAADI OÜ 3,205 183 150.6 45 1,050 141 277.7 29 86.7 24 10,098 161 458 180 359 115 20.0%118 PORTEX AS 7,489 164 92.7 177 999 142 190.2 50 66.8 50 20,886 64 832 141 51 169 19.9%119 KUNDA MOBIL AS 17,385 126 134.2 73 1,600 120 268.7 31 51.7 72 7,408 178 1,023 124 4,287 26 19.8%120 AW NEOON OÜ 28,107 86 124.4 98 3,809 61 94.9 132 22.5 147 21,241 60 1,004 127 2,666 41 19.8%121 SYSTEMTEST OÜ 20,222 112 105.0 155 3,013 79 103.1 119 33.4 118 24,692 43 1,011 125 300 122 19.5%122 PEETRI PUIT OÜ 33,981 71 63.5 191 6,170 43 79.6 151 33.0 120 11,792 149 944 131 13,700 10 19.4%123 GASPRE OÜ* 30,355 79 88.1 182 3,918 59 65.4 161 28.4 136 20,959 63 1,445 89 1,851 56 19.3%124 TOP MARINE OÜ 11,698 147 87.1 183 1,735 116 147.2 74 50.0 74 15,403 115 1,671 75 7,151 17 19.2%125 AGROTARVE AS 38,995 59 111.4 138 7,738 29 135.2 83 29.0 134 10,885 152 1,083 119 930 86 19.2%126 EESTI MUNATOOTED AS* 45,500 50 119.8 113 452 169 21.9 149 16,369 104 2,167 64 770 92 19.1%127 FIXTEC AS 7,801 162 192.3 12 179 184 20.5 153 30,007 22 1,950 70 181 19.0%128 SVEBA-DAHLEN OÜ 28,788 84 141.6 63 1,374 125 33.1 119 13,920 137 600 167 16,057 7 18.9%129 TSM AS* 35,890 67 82.2 185 6,899 35 93.6 133 9.2 183 16,357 105 2,393 58 47 172 18.9%130 SCHÖTTLI KESKKONNATEHNIKA AS 37,080 64 78.6 187 3,746 64 86.4 141 37.5 104 10,788 155 2,060 68 2,323 47 18.7%131 CHOU OÜ 7,551 163 110.4 144 754 151 258.6 32 80.4 32 10,835 154 260 190 54 164 18.6%132 CLUBBY AS* 8,628 159 144.5 54 641 157 167.7 64 47.7 81 16,724 98 1,438 90 183 18.6%133 MOBICOM AS 8,430 160 122.0 106 438 170 242.5 40 11.7 172 21,611 58 1,405 93 88 156 18.6%134 CV KESKUS AS 18,692 120 125.5 97 6,998 33 125.6 92 64.3 55 8,833 173 1,246 103 1,592 61 18.4%135 BALTI KELLA AS* 13,321 141 106.6 153 2,397 89 105.0 117 42.7 89 15,045 119 2,664 54 1,870 54 18.4%136 KOOPIA KOLM AS* 17,358 127 113.4 133 3,222 73 103.1 118 72.5 43 13,667 138 579 169 2,189 51 18.4%137 TELEEKSPERT AS 37,117 62 156.8 34 566 164 75.2 152 10.7 180 17,465 91 977 129 1,074 76 18.3%138 BLAUINVEST OÜ 18,281 124 200.8 9 1,992 107 121.4 100 71.4 44 5,967 189 381 184 3,966 28 18.3%139 FASHION GARDEN OÜ* 24,028 99 120.9 109 3,222 74 135.8 82 33.4 117 13,929 136 1,502 86 273 127 18.2%140 SÖDERHAMN ERIKSSON EESTI AS* 19,233 114 98.4 169 603 162 26.3 179 5.5 187 27,323 31 2,748 45 309 120 18.1%141 PAJO AS 24,008 100 196.2 11 1,740 115 44.5 85 17,582 89 800 147 204 136 17.9%142 KINDLUSTUSEST KINDLUSTUSMAAKLER OÜ 14,120 135 130.0 83 1,776 113 74.5 153 51.8 71 19,777 75 471 178 622 99 17.3%143 ÕNNE PIIMAKARJATALU OÜ* 25,917 92 101.9 164 3,736 66 95.5 130 10.8 178 16,727 97 603 166 8,887 15 17.3%144 SIGARI MAJA OÜ* 28,530 85 104.5 157 3,933 58 88.5 140 31.6 126 13,943 135 1,502 85 123 148 17.3%145 VÄNDRA SAETERITUS AS 18,786 117 110.2 145 2,537 87 132.6 87 25.2 142 17,550 90 626 163 3,653 31 17.1%146 EDELSTEIN OÜ 4,401 178 144.0 56 885 147 188.2 52 80.9 31 7,113 182 1,100 118 175 139 17.1%147 LAVINTON OÜ 13,701 138 114.1 130 1,992 106 101.6 121 36.2 108 18,785 82 1,305 97 739 94 17.1%148 ESPAK PÄRNU AS 46,870 47 127.3 91 719 154 3.3 180 2.3 190 12,639 143 1,267 102 7,376 16 17.1%149 KAJAX FISHEXPORT AS 49,777 43 91.9 181 2,252 94 84.9 142 9.5 182 8,892 172 1,464 87 2,368 46 17.1%150 JAJAA OÜ 10,195 154 120.9 110 2,157 102 110.2 111 37.2 106 19,588 76 1,133 116 174 140 16.9%151 INLOOK COLOR OÜ 29,650 81 120.1 112 3,112 76 11.2 176 22,261 55 1,140 113 683 97 16.7%152 V.V.TRAVEL AGENCY OÜ 9,063 158 132.9 74 268 178 91.1 136 38.4 97 7,248 180 4,531 18 285 125 16.7%153 REGINETT OÜ 18,753 119 123.3 101 742 152 80.3 148 38.0 98 10,560 157 2,679 53 71 158 16.4%154 KATEKS SISUSTUS AS 25,691 94 117.7 120 1,320 127 72.2 156 12.3 171 19,866 72 676 156 2,238 48 16.3%155 PERFETTO STUUDIO OÜ 11,425 149 104.6 156 1,587 121 168.1 63 55.8 68 7,920 176 1,632 77 79 157 15.9%156 ISOGREEN AS 16,623 129 117.9 119 923 145 118.9 102 23.9 145 16,236 107 1,279 101 451 111 15.9%157 AURE OÜ 10,382 153 123.1 103 1,319 128 73.2 155 27.8 138 16,605 100 2,307 60 91 153 15.7%158 SAMESTI METALL OÜ 2,687 187 96.3 174 51 191 347.1 21 11.5 174 14,943 121 537 173 189 15.7%159 MALMOND OÜ 5,838 171 102.3 163 375 174 100.0 123 15.9 162 18,819 81 2,919 41 17 176 15.6%1 EUR = 15.6466 EEK; 1 EEK = 0.0639 EUR; based on 2007 data See also www.konkurents.eeNovember 200851
TOP ESTONIAN ENTERPRISES 2008Small and Medium-sized EnterprisesPLACESALES CHANGE NET PROFIT CHANGE RETURN LABOUR COSTS EFFICIENCY PER INVESTMENTS % OFENTERPRISE IN SALES IN NET PROFIT ON EQUITY PER EMPLOYEE EMPLOYEE THE FIRST* group TH EEK PLACE % PLACE TH EEK PLACE % PLACE % PLACE EEK/month PLACE TH EEK PLACE TH EEK PLACE (0 .. 100)160 OESE METALL OÜ 6,242 170 108.6 149 498 168 327.5 25 23.2 146 9,426 164 567 171 1,202 70 15.5%161 PÕLVAMAA HOIU-LAENUÜHISTU TUÜ 2,201 188 142.5 60 243 180 239.2 41 11.0 177 18,399 85 440 181 52 167 15.3%162 ORU HOTELL OÜ 14,940 131 110.4 143 1,948 108 115.4 105 40.7 93 14,956 120 482 177 603 101 15.3%163 ESTONIAN NATURE TOURS (KUMARI REISID OÜ) 1,006 192 64.6 190 516 166 169.6 5 2,760 192 503 176 9 190 14.9%164 RUUT EHITUSE OÜ 14,769 132 69.9 189 2,276 92 121.4 99 60.7 59 9,126 170 1,136 114 186 14.7%165 RESTA AS 6,721 168 115.4 125 163 187 165.9 65 29.0 133 16,984 95 395 183 91 152 14.5%166 VÄNDRA TARE AS 31,365 76 102.9 161 1,804 110 90.8 137 34.9 111 6,323 184 729 154 2,693 39 14.5%167 AIK-PROJEKT OÜ 4,642 176 149.0 50 188 183 40.0 172 20.0 154 24,205 46 774 148 67 159 14.4%168 SELF II OÜ 10,599 152 116.3 123 2,231 98 91.2 135 32.8 122 14,597 127 883 138 1,596 60 14.3%169 KLIKO OÜ* 18,779 118 78.6 188 501 167 38.7 174 15.3 164 14,340 132 2,683 52 1,136 74 14.0%170 KIVIRAND OÜ 11,243 150 97.2 172 1,301 130 110.6 110 48.8 79 11,259 151 562 172 289 124 13.5%171 TERMIKS GRUPP OÜ 4,907 174 107.7 151 599 163 69.5 157 30.4 130 12,047 147 2,453 57 614 100 13.1%172 PINUS ABJA OÜ 10,614 151 129.4 87 345 176 251.8 37 7.1 185 9,335 166 354 185 89 154 13.0%173 K & M PROJEKTBÜROO OÜ 5,327 172 134.9 72 1,061 138 175.8 57 44.1 86 6,203 187 666 157 496 107 12.9%174 EESTI TEKSTIIL AS 23,905 101 92.0 180 1,732 117 99.0 126 16.8 160 11,926 148 613 164 176 138 12.9%175 MOBI SOLUTIONS OÜ* 18,439 123 127.8 90 844 150 30.6 177 19.8 155 15,132 118 802 145 95 151 12.8%176 MR STUUDIO OÜ 11,439 148 104.5 158 617 159 119.0 101 18.5 159 14,585 128 572 170 1,058 77 12.8%177 KEMEHH OÜ 5,276 173 132.9 75 923 144 185.9 53 33.6 115 8,370 174 330 186 958 81 12.7%178 E-KATUSED OÜ 4,549 177 92.4 179 164 186 90.3 138 37.5 103 14,571 129 650 160 140 144 12.0%179 RÄPINA PABERIVABRIK AS 17,670 125 129.3 88 2,247 95 84.1 143 11.3 175 9,884 162 465 179 2,604 42 11.8%180 SILVA-AGRO AS 25,872 93 112.1 136 217 181 115.1 106 3.9 189 7,428 177 761 151 940 85 11.6%181 LEKU METALL AS 9,647 155 103.1 160 432 172 82.2 145 13.8 167 15,344 116 643 161 552 103 11.4%182 AUDIITORBÜROO ÕNNE KURVET OÜ 1,186 191 142.0 61 196 182 108.2 113 33.8 114 11,786 150 297 187 191 11.2%183 VÄRVIMEISTER OÜ 8,292 161 149.8 48 111 189 121.8 98 13.1 168 10,327 159 638 162 23 175 11.2%184 ENGLO OÜ 4,128 179 82.2 186 737 153 62.4 163 32.8 121 15,726 111 688 155 55 163 11.1%185 SWIPE EESTI OÜ* 3,186 184 118.5 117 706 155 98.8 127 45.7 84 6,321 185 1,062 120 187 10.9%186 VIRTEL GRUPP OÜ 14,569 133 130.2 81 350 175 61.0 166 8.6 184 10,729 156 662 158 1,119 75 10.4%187 TÕRVA ELEKTER AS 16,115 130 93.9 175 1,769 114 61.5 165 10.8 179 7,237 181 1,007 126 296 123 9.2%188 SANGLA JUVEELISALONG AS 7,457 165 109.2 146 279 177 65.5 160 10.6 181 9,552 163 932 134 15 177 8.6%189 MIKARE BALTIC OÜ 3,178 185 112.5 135 53 190 44.7 170 27.3 139 9,145 168 530 174 415 113 8.2%190 PR FIRMAREKLAAM OÜ 9,248 156 107.4 152 16 192 31.0 176 0.4 192 12,516 144 661 159 60 162 7.9%191 MEENED OÜ 2,714 186 161.2 27 178 185 62.2 164 14.2 166 6,925 183 151 192 192 7.3%192 SAKU TEHNO AS 3,477 182 111.2 140 154 188 26.8 178 20.8 151 9,413 165 290 189 230 134 7.0%1 EUR = 15.6466 EEK; 1 EEK = 0.0639 EUR; based on 2007 data See also www.konkurents.eeSiim RaieDirector General, Estonian Chamber of Commerceand IndustryIn the framework of the Estonian Companies’Competitiveness Ranking initiated by the EstonianChamber of Commerce and Industry,the general ranking of the competitiveness ofcompanies was prepared as well as competitivenessrankings by fields of business. For thesecond year already, in the general category, themost competitive small and medium-sizedcompany was identified in addition to thegeneral winner. This means that the ranking ofcompetitiveness was prepared based on the size(smallness) of companies.This ranking could include all companies ofthe general ranking that have a maximum of 49employees (annual average) and the annual netturnover of not more than MEEK 150, and theparent company or subsidiary of the companyis not a large enterprise.Almost a half of the companies (192) who participatedin the ranking wished to try themselvesout in the new category.The winner was Kaamos Kinnisvara OÜ,a company established in 2002, which achiveda high second place among business serviceand real estate companies as well.52November2008
Competitiveness Ranking 2008The Most Competitive Retail Enterprise 2008VARMAPARTNER OÜThe HSM brand has brought successThe common work of friendsEverything simple is brilliant. This sayingis in every way backed by the activity ofthese men who have decided to cover the Estonianmarket with HSM baling presses. Theidea to sell the HSM presses that are producedin Germany came from the fact that the mana -ger of the enterprise, Riho Saksus, used to workin a waste management company, Cleanaway,as the purchase director for Estonia and theBaltic states, but at some point, the owners decidedupon a change in the board – and Saksushad to leave with the others. Before that,the company had acquired some HSM pressesthat were used to compressing customers’ wastematerials. “And then, as I was walking with mythree-year-old son in the Männiku forest, theGermans themselves called and asked about apossibility to co-operate. I asked for some timeto think it over,” Saksus says. In the end, HSMgave the sole representative rights of its productsin Estonia to Varmapartner. Saksus joinedforces with a friend of his and they returnedfrom Germany with a formal co-operation contract.It might seem easy on paper, but after the machineswere sent to Estonia, it took a couple ofmonths to find the first customer. “Those weredifficult times, and the work was hard, becausethe local consumers did not know anythingabout the possibility to manage waste by compressingthe materials and to earn money fromit. Initially, we set up the machines with ourPHOTO: TOOMAS TUULRiho Saksus, Manager of Varmapartner:“Initially, we set up the machines withour own finances and allowed companiesto test them for free for a month.Luckily, 99% of them thought theycould not continue their business withouta HSM machine.”November 200853
TOP ESTONIAN ENTERPRISES 2008own finances and allowed companies to testthem for free for a month. Luckily, 99% of themthought they could not continue their businesswithout a HSM machine. At some point, we includeda third friend and then a fourth one. Sowe are all friends here, working together.” Themember of the board of the enterprise admitsthat when the company was only starting out,he even talked in his sleep about differentpresses for almost three months in a row. Inorder to cut down on costs, they themselves didnot get any salary for the first 3-4 months.During the entire time of being in business, thegroup of friends have done everything themselves,from installing to repairs. At one point,they tried to hire sales representatives, but itturned out that the training was complicatedand Riho Saksus together with his friends hadto do even more work to make up for the incompetenceof the sales representatives.By the end of the first year, the men managed tofind 8-9 customers. The company’s efforts paidoff, because all the customers were big names intheir particular fields of business. In September2005, the first press was installed in the warehouseof a medical wholesale dealer, MagnumMedical. From then on, there were EnerpointSaare, ML Arvutid, Krimelte, FEB and manyothers. The companies acquired a HSM pressand got rid of their waste containers.What can be compressed with thebaling presses?For a company, using baling presses means thatin principle, they do not need a waste managementcompany anymore. Foil, paper, cardboard,empty and full tin cans, thinner metal,textiles, expanded polyurethane leftovers –everything that deforms can be compressedinto smaller or larger bales. A small press can beinstalled in a corner of an office, a bigger pressthat compresses bales weighing several tons,can be installed in the hubs of shopping centres.“We decided already from the very beginningthat we would not handle waste directly.Only HSM presses are our line of business. Andwe have also explained to our customers eversince the very beginning that after acquiring apress they really do not need a waste managementcompany anymore. A waste managementcompany would earn money from secondarymaterials twice – first when they collected itfrom the customer and another time when theysold it. We ended that. A lot of people active inwaste management have now said that eversince we came along, the market was turnedupside down with our aggressive advertising ofthe machine. In any case, everyone won fromthe situation, even companies involved in buying-up,and the resellers do not have to dealwith waste management companies anymore.”The big market of small EstoniaThis is a list of only a few bigger enterprisesthey have sold equipment to: Saku Õlletehas,A. Le Coq, Altia, Liviko, Elcoteq, Kaupmees &Ko, Rautakesko, Rimi, Selver etc. Last year wasthe year of explosive expansion and they managedto get the idea of waste compressingthrough to the market. Saksus admits thatnamely trade is the sphere where they couldnot enter for a long time, the more so becausethe first investment is expensive as a rule. Tradeis a world of its own, where waste managementcompanies offered a free service for a long time,only in order to get the material. Thanks to recyclingorganizations such as Pakendiringlus(PackCycling) and Eesti Taaskasutusorganisatsioon(the Estonian Recovery Organization),the bigger trade companies such as Selver, Maximaand Prisma started using the HSM machines,and all shops have not been coveredyet. In the central warehouse of Rimi in Jürithere is the largest HSM press in Estonia, whichwas ordered at the beginning of the year for allshopping centres and waste is delivered therefrom everywhere. It is an incredible sight in Jüri– next to the conveyor of a big baling pressthere are two men who keep tossing cardboardor plastic into the machine, and cardboard andplastic bales drop out of the other end of themachine, which could be collected immediately.They have managed to cover almost the entireEstonia with the HSM baling presses, but itseems that there is room for more. Metaphoricallyspeaking, the company has managed tosell the equipment from Sõrve Peninsula toNarva and from Tallinn to Tõrva, altogethermore than 250 presses. This number has beenachieved during the last three years. During mychat with the member of the board of the companywhen I ask when the last shipment arrived,he answers with a smirk, “Today”. TheSelver store in Paide is the latest customerchoosing the new technology. „Hiiumaa andSaaremaa have the largest number of pressesper capita in the world. In 2006, the Germanscould not understand how it is possible to sellthis many presses to a country with a populationof only 1.3 million. I believe that the keyfor our success is that we are focused only onone thing, and hence we are considered to bepartners not resellers. In the year 2006 we wonthe HSM award for being the fastest developingdealers in the European region and last yearwe received recognition for the best marketingactivity. We have invested so much in marketingand advertising that sales have become easier,we do not have to work day and nightanymore,” Saksus is content.Last year, the HSM presses were taken to theconstruction fair “Estbuild”, they supported theHarley Davidson bikers, Kalev footballers andPõlva Serviti handballers; and they also sponsoredthe Palladium Cup. Varmapartner has alwaystried to do unconventional marketing. Forinstance, they displayed presses in the foyer ofthe Selver in Järve, so that people who comefood-shopping could see how to manage waste.“We have always tried things in a different way,not always directly. In the “Estbuild” fair peoplewondered why we were there; this year we werein the car fair „Motorshow”. We thought thatwhen a CEO would come to check out a newcar, they might see our presses and we receivedquite a few orders that way,” Saksus says.What next?The idea to supply a large number of Estonianentrepreneurs with HSM presses is good. Theyhave to think a lot more about the time whenmost companies have already acquired thepresses. Because of their good quality, the life -span of baling presses is at least 20 years andno-one will change them just because. This inturn means that we have to look for new markets.“If you look after the machinery and oil itevery now and then and keep it clean, it willwork for a long time. A car you would want tochange every two years, but this machine willwork. What next? Perhaps the market will befull one day, but we have a specific plan to expandinto the private persons’ sector, and arealso considering developing towards Latvia,”Saksus is certain that they will have enoughwork in the future.VARMAPARTNER OÜ 2007Sales (th EEK) 22,645Change in sales 265.4%Net profit (th EEK) 3,237Change in net profit 3,404.7%Number of employees 2Investments (th EEK) 2,482Return on equity 187.3%Place in the CompetitivenessRanking 2008 554November2008
TOP ESTONIAN ENTERPRISES 2008Retail EnterprisesPLACESALES CHANGE NET PROFIT CHANGE RETURN LABOUR COSTS EFFICIENCY PER INVESTMENTS % OFENTERPRISE IN SALES IN NET PROFIT ON EQUITY PER EMPLOYEE EMPLOYEE THE FIRST* group TH EEK PLACE % PLACE TH EEK PLACE % PLACE % PLACE EEK/month PLACE TH EEK PLACE TH EEK PLACE (0 .. 100)1 VARMAPARTNER OÜ 22,645 28 265.4 1 3,237 21 3,404.7 2 187.3 2 19,223 17 11,322 1 2,482 19 100.0%2 TALLINNA KAUBAMAJA AS* 5,892,423 1 139.0 8 410,836 1 149.6 10 26.2 27 15,550 21 2,080 20 424,255 1 96.5%3 SILBERAUTO AS* 5,334,125 2 133.1 9 232,594 2 107.1 24 35.9 22 26,495 5 7,028 6 274,962 2 94.6%4 ESTOVER OÜ 318,000 10 120.0 23 25,000 8 12,500.0 1 124.3 4 13,225 26 6,913 7 2,700 18 61.7%5 VEHO EESTI AS 1,197,391 4 142.2 6 41,023 6 134.4 13 36.3 21 27,202 4 8,804 4 63,439 6 60.5%6 AMSERV GRUPI AS* 2,364,574 3 125.6 16 85,486 3 125.4 15 45.0 16 26,148 6 5,326 9 103,302 4 59.6%7 ELKE AUTO AS* 903,387 6 118.3 25 57,621 4 113.4 20 43.4 17 28,666 2 8,944 3 14,032 10 55.7%8 CATWEES OÜ* 588,420 8 187.3 2 50,507 5 53.4 34 39.2 19 21,855 13 7,448 5 14,738 9 52.7%9 TATOLI AS 263,867 12 144.9 4 16,189 13 155.9 9 32.5 25 24,867 9 9,194 2 4,945 17 51.3%10 FAGEL OÜ* 71,592 19 140.8 7 6,112 18 225.0 5 85.7 7 35,016 1 3,254 14 877 21 50.3%11 FAKTO AS* 975,730 5 93.6 36 40,340 7 112.1 21 45.3 15 27,320 3 4,879 11 105,413 3 46.5%12 AJ TOOTED AS 34,468 21 115.3 29 8,479 16 122.1 17 55.6 10 25,535 8 6,894 8 5,808 16 42.2%13 VALOOR AS* 163,633 13 125.0 17 9,972 15 124.5 16 40.5 18 24,855 10 4,545 12 56,197 7 40.0%14 BORTER TRADE OÜ 7,068 36 131.8 10 265 36 93.3 27 294.0 1 10,300 33 1,178 32 268 27 36.9%15 LUKU SERVICE OÜ 26,095 25 126.5 13 2,837 23 131.7 14 82.4 8 25,948 7 2,899 15 34 36.8%16 KENTEK EESTI OÜ* 18,949 29 126.4 14 1,050 28 342.0 3 19.0 31 24,200 11 1,895 21 778 22 32.8%17 TAMREX OHUTUSE OÜ 77,378 18 124.4 18 6,901 17 181.0 7 87.5 6 22,621 12 1,382 27 7,839 13 32.8%18 INDOOR GROUP AS 396,328 9 117.3 27 22,114 10 72.1 32 19.9 30 19,859 16 5,017 10 1,668 20 31.3%19 TOPAUTO RAKVERE OÜ 32,764 22 126.1 15 918 30 152.2 3 14,718 22 3,276 13 89 31 30.7%20 UHTNA TALUTEHNIKA AS 118,812 16 114.4 30 10,263 14 197.3 6 55.0 11 20,206 15 2,200 19 12,616 11 29.5%21 CLUBBY AS* 8,628 33 144.5 5 641 34 167.7 8 47.7 13 16,724 19 1,438 26 35 26.0%22 INFOTARK AS 269,713 11 103.9 35 17,927 11 89.2 28 17.0 32 21,173 14 2,697 16 11,060 12 25.2%23 NURMIKO AIANDUSKESKUS OÜ 12,810 32 110.6 31 1,165 27 295.7 4 95.5 5 12,995 27 801 35 379 25 23.8%24 MÖÖBLIMAJA AS* 135,328 15 104.4 34 22,252 9 111.7 22 60.1 9 17,588 18 1,671 23 620 23 23.1%25 ISIS MEDICAL OÜ* 27,528 24 129.4 11 1,706 26 109.6 23 49.0 12 14,355 23 2,503 18 134 29 23.1%26 SAAREMAA TARBIJATE ÜHISTU TUÜ 619,366 7 123.6 19 2,582 24 32.2 35 4.1 36 10,935 30 1,329 28 101,900 5 19.4%27 FASHION GARDEN OÜ* 24,028 26 120.9 21 3,222 22 135.8 12 33.4 23 13,929 25 1,502 25 273 26 18.7%28 ISOGREEN AS 16,623 31 117.9 26 923 29 118.9 19 23.9 28 16,236 20 1,279 29 451 24 18.3%29 REGINETT OÜ 18,753 30 123.3 20 742 31 80.3 30 38.0 20 10,560 31 2,679 17 71 32 17.7%30 VÄRVIMEISTER OÜ 8,292 34 149.8 3 111 37 121.8 18 13.1 34 10,327 32 638 36 23 33 15.4%31 NITTIS OÜ 145,435 14 120.4 22 16,939 12 73.1 31 22.8 29 9,150 36 1,889 22 16,428 8 15.3%32 SIGARI MAJA OÜ* 28,530 23 104.5 33 3,933 19 88.5 29 31.6 26 13,943 24 1,502 24 123 30 15.1%33 LIHULA TARBIJATE ÜHISTU* 90,773 17 116.1 28 3,589 20 144.6 11 33.3 24 9,751 34 1,243 31 5,860 15 14.7%34 ESPAK PÄRNU AS 46,870 20 127.3 12 719 32 3.3 36 2.3 37 12,639 28 1,267 30 7,376 14 12.5%35 SWIPE EESTI OÜ* 3,186 37 118.5 24 706 33 98.8 26 45.7 14 6,321 37 1,062 33 36 10.7%36 EESTI TEKSTIIL AS 23,905 27 92.0 37 1,732 25 99.0 25 16.8 33 11,926 29 613 37 176 28 8.5%37 SANGLA JUVEELISALONG AS 7,457 35 109.2 32 279 35 65.5 33 10.6 35 9,552 35 932 34 15 37 8.1%1 EUR = 15.6466 EEK; 1 EEK = 0.0639 EUR; based on 2007 data See also www.konkurents.eeNovember 200855
Competitiveness Ranking 2008The Most Competitive Wholesale Enterprise 2008MAZEIKIU NAFTA TRADING HOUSE OÜThe team is the keyto all endeavours!It is highly likely that when consumerswould be asked in a petrol station howto spell Mazeikiu, few would know how toanswer. But no-one would stop filling up anddrive from one fuel distributor to another,searching for the best prices; you should rememberthat it is that very same company thatimports most of the fuel of our cars to Estonia.Almost 80% of the petrol sold in Estonia comesfrom the Lithuanian Mazeikiu Nafta factory.Mazeikiu Nafta Trading House (MNTH) hasmanaged to be chosen as the most competitivewholesaler for three consecutive years.In the whirlwind of changes in themarket situationThe previous and, even more, the current yearwill be remembered as the year of a frenziedfuel rally and the abrupt stop of economicgrowth. The Chairman of the Board of MNTH,Tõnu Ääro, says that the economic fall of theyear 2007 has not influenced them much as ofyet, the difficulties have become more obviousnamely since the beginning of the current year.“We will definitely to be changing our businessstrategy because of that this year, but we arelooking into the future already and there willdefinitely be changes in the year 2009,“ headds.The Chairman of the Board considers it impor-Tõnu Ääro, Manager of MNTH: “I havealways been convinced that a good teamis a company’s key for success.”PHOTO: TOOMAS TUUL56November 2008
TOP ESTONIAN ENTERPRISES 2008MNTH started fully operating in Estoniaat the end of the year 2003. Tõnu Ääro,who has been working in the companyever since the beginning, thinks that thecompany has managed to create a goodmarketing system by now. MazeikiuNafta Trading House that was establishedin Lithuania is a fuel wholesalerthat is solely owned by Mazeikiu Nafta.Wholesale companies operating inLatvia, Estonia and Poland are subsidiariesof that enterprise. MazeikiuNafta itself consists of a refinery, an oilpipeline system and the Butinge oil terminal.tant to be constantly ready for changes in themarket situation. “We have to try to design thestrategy of the company in such a way that wewould be able to react to the changes quicklyand flexibly, and it is crucial to foresee all possiblechanges.“Due to the fast increase in fuel prices the consumptionhas decreased by about 10% and ithas naturally influenced the sales capacity ofMNTH. The volume of import has declined almost5%. According to Ääro, the decline inconsumption has not influenced the profits toa great extent. The company has experiencedeven more complicated, almost crisis exercisetimes – for instance in the year 2006 when theRussian Transneft stopped all supplies to theLithuanian factory and also announced that therepairs on the oil pipeline might take the entireyear. The problem has been solved by now.The year 2004 was the time of actively enteringthe market and it called for much effort.The team managed then, as it does now, to successfullyovercome the challenges.“I have always been convinced that a good teamis a company’s key for success and so far, thekey for my success really has been the rightpeople at the right places. I specifically expectspecialists responsible for their own field totake decisions themselves and not wait for solutionsto come from somewhere else andhigher. I consider the delegation of decisionsand responsibility to be important. My maintask is to guide the team towards a commongoal and keep “the machine well-oiled”.”The team is one of the biggest assetsThe Chairman of the Board considers thebiggest challenge of the previous year to havebeen the rescuing of the team from a routinethey had developed during a longer period.People had to be motivated to carry on withnew strength. “Unfortunately, some unpopulardecisions had to be made, but it is clear todaythat those decisions only benefited everyone,because both the internal climate of the companyand the motivation of the team have improvedto a great extent. We refreshed our staffslightly and we are trying to achieve the goalsset for this year with the new forces despite anydifficulties.”Tõnu Ääro has noticed recently that the competitionin the fuel market has become tougher.He says that there have emerged competitorswho are trying to decrease the market share ofMNTH with the help of unethical behaviourand then adds assuredly that it is not somethingthat could happen easily. As a sign of bon tonhe doesn’t mention any names, of course.Ääro is convinced that their company wants tobe the best partner among fuel suppliers for itsco-operation partners. From time to time, therehave been talks in MNTH about expansion andthe idea is still there. The company could definitelygrow out of the rather narrow field ofwholesale some time in the future, Ääro says. Ifit meant that at one point the consumer mightbe filling their car up in a petrol station namedafter the owner of MNTH, Orlen, the Chairmandoes not say for the time being. So far, thepresident of the Orlen group has no plansabout expanding in the retail market of theBaltic countries.Even though the fuel seller does not wish tocomment on politics much, he is neverthelesshonestly open about what he expects from thegovernment. “What the government shouldlook into is the fact that the implementation ofthe state budget that has caused a lot of discussionis connected to the effectiveness of severalagencies, which directly means the accruementof taxes and control over what the governmentcould fix by a great extent.“Tõnu Ääro is the Chairman of the Board ofMNTH for the sixth year already. “Avoidingroutine to emerge is quite an art. Fortunately,there are so many changes occurring in themarket recently, which will not let us doze off,so to speak.“Another thing I consider important is doingsomething in my spare time, it helps to escapethe work routine; and lately I have discoveredcycling for myself and the wonderful CFCsports club. Whenever I can, I participate in theElion bicycling marathon series with otheramateurs and that is exactly what helps themind rest well,” he is convinced.MAZEIKIU NAFTATRADING HOUSE OÜ 2007Sales (th EEK) 5,804,018Change in sales 113.7%Net profit (th EEK) 34,771Change in net profit 113.1%Number of employees 10Investments (th EEK) 284Return on equity 60.5%Place in the CompetitivenessRanking 2008 2November 200857
TOP ESTONIAN ENTERPRISES 2008Wholesale EnterprisesPLACESALES CHANGE NET PROFIT CHANGE RETURN LABOUR COSTS EFFICIENCY PER INVESTMENTS % OFENTERPRISE IN SALES IN NET PROFIT ON EQUITY PER EMPLOYEE EMPLOYEE THE FIRST* group TH EEK PLACE % PLACE TH EEK PLACE % PLACE % PLACE EEK/month PLACE TH EEK PLACE TH EEK PLACE (0 .. 100)1 MAZEIKIU NAFTA TRADING HOUSE OÜ 5,804,018 1 113.7 28 34,771 3 113.1 18 60.5 5 92,217 1 580,402 1 284 26 100.0%2 KEMIRA GROWHOW AS 1,155,417 3 126.4 17 38,572 2 186.7 6 29.7 23 52,383 3 46,217 4 303 25 56.7%3 VIKING MOTORS AS* 405,789 7 136.9 11 13,526 9 103.6 23 39.9 14 27,794 15 3,940 19 52,604 1 54.5%4 PRIKE AS* 628,195 5 153.3 6 24,018 5 190.2 5 58.5 7 28,466 11 6,345 11 3,612 5 53.4%5 ROVICO BÜROO OÜ 11,703 34 152.7 8 3,103 27 253.8 3 105.0 1 28,649 10 2,703 28 27 33 52.0%6 ELME METALL OÜ 1,591,843 2 155.7 5 38,963 1 95.4 28 15.4 34 27,901 14 46,819 3 400 23 51.1%7 WIRTGEN EESTI OÜ* 102,700 15 184.3 1 6,569 20 100.0 25 58.8 6 55,796 2 17,117 5 330 24 49.6%8 FRELOK AS 680,275 4 129.3 15 30,162 4 90.7 30 21.5 30 28,279 12 8,398 10 28,281 2 48.9%9 SUN TIMBER OÜ 13,525 32 151.4 9 1,180 33 484.1 1 62.7 4 3,370 36 294 35 947 15 46.2%10 NURMIKO HULGI OÜ 80,463 20 129.2 16 3,525 25 252.3 4 83.8 2 17,057 27 2,117 33 1,546 10 41.0%11 VBH ESTONIA AS 164,757 10 156.0 4 10,471 12 119.2 16 22.4 28 30,709 8 4,846 17 11,005 3 37.1%12 BALTIC PULP AND PAPER OÜ 619,941 6 130.7 13 19,312 6 142.9 10 29.9 22 12,503 33 103,323 2 933 16 36.6%13 EXCELLENT GRUPP AS 47,237 22 143.9 10 15,811 7 134.6 13 40.2 13 22,074 23 15,746 7 53 31 36.0%14 PUUKESKUS AS 233,460 8 118.1 21 7,092 19 266.8 2 41.0 12 28,253 13 12,970 8 283 27 34.8%15 AIRWAVE OÜ 45,120 24 165.9 2 6,354 21 98.6 27 49.2 8 14,057 31 3,008 23 1,204 11 33.8%16 HORECA SERVICE OÜ* 81,719 19 129.4 14 4,399 23 102.1 24 76.0 3 20,592 24 2,724 26 1,650 9 33.7%17 GEA WTT BALTICS OÜ 32,816 29 152.7 7 1,470 31 112.2 20 38.6 15 40,750 4 4,102 18 155 29 32.7%18 UWEKO AS 105,051 12 114.1 26 15,731 8 168.4 7 37.9 16 25,669 19 9,550 9 34 32.1%19 FRIENDS TEXTILE OÜ* 43,692 25 123.2 18 7,563 17 146.2 9 45.7 9 24,140 21 2,570 31 566 19 29.7%20 ADDINOL MINERALÖL MARKETING OÜ 178,472 9 122.2 19 8,989 15 119.0 17 23.0 27 26,497 17 5,577 15 9,867 4 28.6%21 KEMIFLORA AS* 133,163 11 117.1 23 10,925 10 123.3 14 29.2 24 28,937 9 3,599 20 2,220 7 27.6%22 BENEFIT AS 46,507 23 116.4 24 5,364 22 122.0 15 44.1 10 30,952 7 2,215 32 952 14 27.5%23 SYSTEMAIR AS 104,913 13 121.7 20 10,569 11 112.4 19 32.7 20 27,112 16 5,829 12 126 30 27.4%24 ALUOJA OÜ* 37,086 28 131.1 12 7,308 18 139.6 11 37.3 18 13,211 32 3,371 22 1,176 12 26.6%25 SCHETELIG EV AS 102,838 14 114.0 27 10,371 13 111.4 21 24.4 26 30,997 6 3,546 21 508 21 24.8%26 AGROTARVE AS 38,995 26 111.4 29 7,738 16 135.2 12 29.0 25 10,885 34 1,083 34 930 17 20.3%27 KAESER KOMPRESSORIT OY EESTI FILIAAL 38,809 27 115.0 25 3,382 26 79.9 31 33.5 19 23,524 22 4,851 16 537 20 20.1%28 VIPEX AS 91,849 17 97.5 34 9,912 14 154.2 8 19.7 32 17,257 26 2,870 25 2,488 6 19.8%29 BALTI KELLA AS* 13,321 33 106.6 30 2,397 29 105.0 22 42.7 11 15,045 29 2,664 30 1,870 8 19.5%30 PINTAVÄRI EESTI OÜ 19,052 30 101.7 32 2,136 30 95.3 29 37.9 17 25,443 20 2,722 27 667 18 18.9%31 MEENED OÜ 2,714 36 161.2 3 178 36 62.2 33 14.2 36 6,925 35 151 36 36 17.8%32 SKS VÕRU OÜ 92,286 16 99.1 33 3,740 24 41.2 35 22.1 29 39,665 5 5,768 13 429 22 16.7%33 NORES PLASTIC OÜ 85,012 18 96.8 35 2,866 28 67.8 32 30.8 21 26,399 18 17,002 6 52 32 16.2%34 ARHDISAIN OÜ 50,833 21 118.0 22 1,229 32 57.2 34 20.5 31 16,350 28 5,648 14 244 28 13.9%35 MALMOND OÜ 5,838 35 102.3 31 375 35 100.0 26 15.9 33 18,819 25 2,919 24 17 35 11.5%36 KLIKO OÜ* 18,779 31 78.6 36 501 34 38.7 36 15.3 35 14,340 30 2,683 29 1,136 13 3.5%1 EUR = 15.6466 EEK; 1 EEK = 0.0639 EUR; based on 2007 data See also www.konkurents.ee58November2008
Competitiveness Ranking 2008The Most Competitive Industrial and Energy Enterprise 2008BLRT GRUPP AS2007 is the best year in history!Fjodor Berman, Chairman of the Board ofBLRT, has been working in BLRT formore than 30 years. During such a long timethere have been better and worse times in thecompany. In recent years, Berman has becomeused to the fact that every year, the company’sresults keep getting better, but the year 2007will really go down in history. “Around Christmaswe have a corporate meeting and discussionwhere we draw conclusions of the pastyear – all the managers of different subdivisionsare together and I always start the evening withsaying that this year was better than the lastone. But I can see now that looking at all theprevious periods then indeed, last year was thebest year of all times in the history of BLRT. Weexperienced significant growth – the sales figu -res went up, we managed to expand our sharein the market and buy a company called TurkuRepair Yards. Now we have entered very deepinto the Finnish market. We fought for thatshare of the market and we are very satisfied.”The right investments bring successBLRT is constantly developing new projects,and that is why a lot of investments are made.Last year was the most investment-rich periodfor the company – Berman says that the rightinvestments give the company a lot more selfconfidencefor future activities. Turku RepairYards is the biggest ship repair facility in theNordic countries, and by acquiring that, BLRTbecame the biggest business in the ship repairmarket of the Gulf of Finland and the BalticPHOTO: TOOMAS TUUL”Competition has become stronger and ithas been caused by many reasons. Thetime for celebration in ship building stillcontinues – if you wish to order a shipnow, you would be told to come back inthe year 2011. There are too many ordersand that is why the prospects of shipbuildingare very good. Sea transport hasremained to be the most effective and allin all the cheapest form of transport,”Chairman of the Council Fjodor Bermansays.November 200859
TOP ESTONIAN ENTERPRISES 2008Sea. Currently, BLRT is building an extremelylarge galvanizing facility in Vilnius, which willbe completed by November this year andwhich will become the largest and most modernmetal galvanizing facility in the Baltic countries.”Competition has become stronger and it hasbeen caused by many reasons. The time forcele bration in ship building still continues – ifyou wish to order a ship now, you would betold to come back in the year 2011. There aretoo many orders and that is why the prospectsof ship building are very good. Sea transporthas remained to be the most effective and all inall the cheapest form of transport,” Bermanadds.Several new international conventions ban theuse of ships with old constructions and thereare different reasons for it, either shortfalls infire safety or having a single hull and that iswhy orders keep accumulating – a ship mustbe rebuilt or a company is forced to invest in anew ship instead. It is an interesting situationwhere both the demand and the supply are verylarge. Big countries like Japan, China, Korea,Germany and the Netherlands are trying to findand keep their niche, and Estonia has a lot tosay in all of this.”We do not get orders just like that, we have tofight for them and we must do high qualitywork. The name also matters, so that the potentialcustomers would know who you are.People know us and that is why we get a lot oforders from different regions. Sometimes we aretold that we were lucky for having been at theright place at the right time. That is also thetruth. For example, as far as wind energetics isconcerned, we are told that it does not matterhow much a detail or another will cost, themost important thing is that we are able tobuild all that. And so we have received a substantialorder for building a transformationplatform necessary for building a wind farm inthe North Sea,” Berman is satisfied.Indicators of a sharp crisisThe company did not feel the beginning of theeconomic crisis last year. It was only a topic ofconversation. Berman thinks that when theeconomy is growing, the liberal economic policyis very good, but is it not suitable all thetime. When ten years ago it was very importantthat the companies were not interfered with, itis not possible now to just look and not takeaction. BLRT was ready for worse times just incase; but fortunately, the market is developingwell in the sphere of ship building. The situationis different now. BLRT has 10 differentbusiness directions and even though everythingis very well with ship building and repair, thereare some signs of decline in metal and gas sales.“We also see that bills are paid worse to us andduring a longer period of time. All analysts tellsomething different, some say that things willget better towards the end of the year, but I’mconvinced that the crisis is only starting.” Timesare complicated not only in Estonia – theFinnish ship building company Akeryard is agood example – when there is work in Turku,there is not work in Helsinki and Rauma anymore.That is the reason why Akeryard alreadyentered the repair market as well. Berman saysthat BLRT has participated in state contests andalso won them. “It is evident that no matterhow big the crisis, some decisions always needto be taken. On the other hand, when the economyis growing, everybody is doing well anddecisions have to be brave. Even if you makemistakes then, you will suffer no damages.Problems occur during a decline and that is exactlywhat we are experiencing right now: thereare no more simple decisions any more, nothingon the lines of ‚let’s invest and then we willsee what happens’. Of course it is difficult topredict the future, but if the evaluations noware correct and real, then everything is fine.”BLRT has not cut down on any of its plans, butrather the opposite – the planned growth forthis year is 30%. The Chairman of the Board ofthe company says that they could not expectanything less, because they have invested agreat deal. He says that when a company hasseveral different business directions, things areslightly easier, because the shortfalls of one directioncan be balanced by the positive resultsof another direction. Berman believes that thecurrent year will be better than the last one; theresults of the first six months prove it already.“It is our planned strategy that does not exceedits planned limitations and gives us the senseof security of acting the right way.”No signs of improvement in the labourforce marketAs far as labour force is concerned, there is nogreat improvement in ship building. It is ofsome consolation that there are similarly toughtimes all over Europe. “Last year, there were notenough people in BLRT, there was an abnormalsituation: people without any knowledge ofwork come and demand a high salary. Currently,the situation is slightly different: peoplecome and are willing to accept any work, whichin turn means that the labour force market ischanging. For example: because the transit volumeshave decreased a lot, there is a large surplusof dockers in Estonia – they need almostfive years of training, but orders have to becompleted immediately. That is why we employed50 Chinese people in Lithuania, whoknow their work well and it is obvious nowthat it was the right step. The factory inKlaipeda was purchased in 2001 and it is currentlythe biggest exporter in Lithuania. Wewant to be the best in our line of business anyway,”Fjodor Berman puts it simply.THE HISTORY OF BLRTBalti Laevaremonditehas (The Baltic ShipRepair Yard) was founded in the year1912 – so the company can soon celebrateits 100th birthday. In the beginning,the company built ships for theRussian Navy; and in addition, the companyhad managed to build three linersas well. After the Second World War, thecompany focused on repairing militaryvessels; and in the 70’s and 80’s the mainline of business for the company was repairingfishing vessels. From the year1990, the company started repairingtankers, cargo vessels and cruise liners.Today, the company has several competingship repair yards all over the world.In the year 1996 the company was privatized;and since the year 2000, BLRTis the owner of the former Tallinn SeaFactory. In the year 2001, BLRT Groupacquired the majority of shares in aLithuanian ship repair company, VakaruLaivu Remontas; the biggest investmentlast year was the acquisition of TurkuRepair Yards in Finland.BLRT GRUPP AS 2007Sales (th EEK) 4,619,400Change in sales 132.2%Net profit (th EEK) 507,063Change in net profit 126.2%Number of employees 3,233Investments (th EEK) 625,676Return on equity 26.2%Place in the CompetitivenessRanking 2008 1760November2008
TOP ESTONIAN ENTERPRISES 2008Industrial and Energy EnterprisesPLACESALES CHANGE NET PROFIT CHANGE RETURN LABOUR COSTS EFFICIENCY PER INVESTMENTS % OFENTERPRISE IN SALES IN NET PROFIT ON EQUITY PER EMPLOYEE EMPLOYEE THE FIRST* group TH EEK PLACE % PLACE TH EEK PLACE % PLACE % PLACE EEK/month PLACE TH EEK PLACE TH EEK PLACE (0 .. 100)1 BLRT GRUPP AS* 4,619,400 1 132.2 38 507,063 1 126.2 55 19.8 77 18,898 42 1,429 36 625,676 2 100.0%2 ECOMETAL AS 314,524 23 220.1 3 122,581 5 387.4 7 154.6 2 21,008 29 5,934 2 2,048 67 82.5%3 VKG OIL AS 1,461,883 3 135.7 31 329,392 2 95.6 74 27.9 55 14,904 63 2,449 15 716,187 1 76.8%4 FAVOR AS 309,867 24 122.9 55 65,672 10 674.3 1 130.3 3 20,843 30 1,878 23 15,136 30 69.8%5 REMEI BALTICA OÜ 23,285 80 139.8 27 4,187 58 157.0 44 74.1 13 68,337 1 5,821 3 769 81 65.4%6 HENKEL MAKROFLEX AS* 897,942 5 95.3 95 105,354 6 94.4 76 30.6 51 26,399 16 10,089 1 10,500 34 57.6%7 PALMSE MEHAANIKAKODA OÜ* 215,389 29 148.7 19 29,325 24 251.5 17 93.5 8 30,705 8 4,142 7 18,417 24 56.1%8 ENERGOREMONT AS* 503,063 16 195.8 5 36,178 19 341.7 9 105.8 5 16,144 57 583 85 12,518 31 51.4%9 LASERSTUUDIO OÜ 4,690 98 186.7 7 435 97 165.5 1 28,426 12 938 66 99 47.7%10 ABB AS 1,700,000 2 123.6 52 82,000 9 139.9 48 26.4 59 25,110 18 1,876 24 145,000 3 46.7%11 MAXIT ESTONIA AS 698,865 9 104.4 87 187,818 3 126.7 54 19.4 79 27,421 14 3,994 9 48,200 7 46.4%12 HAKA PLAST OÜ 56,483 62 158.4 12 3,747 61 244.9 18 91.9 9 16,654 54 3,530 11 698 83 45.8%13 HARJU ELEKTER ELEKTROTEHNIKA AS 269,284 27 145.2 22 21,500 27 364.5 8 53.7 26 25,937 17 1,535 34 8,936 38 44.5%14 HEKOTEK AS* 328,688 22 119.7 61 23,391 25 209.6 25 40.3 36 35,179 3 3,460 12 1,965 69 43.4%15 TIKKURILA-VIVACOLOR AS 386,413 18 118.4 64 39,752 15 117.2 60 22.8 70 36,800 2 4,830 5 29,197 16 43.2%16 AFFECT OÜ 5,966 96 465.4 1 258 100 105.8 66 62.6 18 4,967 99 96 100 252 90 42.5%17 SILBETI PLOKK OÜ 103,315 44 166.6 10 19,322 30 239.5 19 101.0 7 13,242 73 638 82 29,215 15 40.7%18 TIPTIPTAP OÜ* 19,617 83 158.5 11 2,760 70 211.5 24 108.8 4 14,718 64 1,032 60 247 91 39.4%19 FILTER AS* 356,644 19 139.7 28 29,366 23 168.4 38 40.9 35 24,194 20 2,426 17 40,837 10 37.8%20 VÄO PAAS OÜ 104,645 43 121.1 59 17,165 34 252.2 15 42.4 34 31,196 7 1,744 26 6,858 41 37.8%21 EFEKT AS 25,595 78 154.9 13 623 93 505.9 4 15.4 85 18,493 45 1,163 51 98 37.7%22 HARJU ELEKTER AS* 731,985 7 117.7 65 85,935 8 165.1 40 14.6 86 29,998 9 1,656 28 43,256 8 37.5%23 TERASVARA OÜ 12,338 87 123.4 54 855 89 652.1 2 16.6 83 12,244 78 514 90 2,756 61 37.4%24 KRIMELTE OÜ 869,700 6 115.1 70 50,400 12 62.5 90 20.9 73 18,280 46 4,676 6 67,000 6 37.2%25 GLAMOX HE AS 265,342 28 128.6 44 37,279 18 197.2 30 46.8 31 22,306 24 2,434 16 10,366 35 37.1%26 TOODE AS 329,573 21 121.9 58 41,445 14 106.4 65 48.7 30 21,177 28 3,582 10 24,707 18 37.0%27 FINLAID OÜ 44,548 66 92.5 98 1,334 83 416.4 6 65.0 16 7,991 96 2,345 18 4,381 51 36.9%28 BLADHS EESTI AS 140,326 39 267.8 2 6,874 48 214.6 23 39.4 37 14,513 65 850 72 5,203 46 36.4%29 K-PRINT OÜ 24,343 79 143.0 25 3,436 63 171.7 37 57.8 21 31,582 5 1,281 46 6,420 43 36.3%30 E-PROFIIL AS 160,701 34 150.8 17 5,145 53 158.9 42 71.7 14 23,618 21 1,086 57 5,876 44 35.6%31 IKODOR AS 56,791 61 152.0 16 18,247 32 201.4 29 58.3 20 16,574 55 2,184 19 9,280 36 35.5%32 REPO VABRIKUD AS 582,482 12 113.3 74 47,881 13 331.3 10 22.5 72 14,209 67 1,393 38 42,477 9 35.1%33 BETOONIMEISTER AS* 144,800 36 152.7 15 6,585 51 53.9 92 26.0 60 31,241 6 3,017 13 68,400 5 34.7%34 WENDRE AS 1,000,906 4 145.4 21 94,975 7 157.0 43 25.7 61 12,275 77 1,571 31 16,456 25 34.4%35 ESTANC AS* 58,035 59 144.4 23 5,687 52 226.0 22 57.3 22 20,580 32 1,382 39 1,853 71 34.4%36 HELMETAL IMS OÜ 22,987 81 197.0 4 3,335 64 134.4 50 77.2 12 13,992 68 1,197 49 4,389 50 34.2%37 PRO FIKSUM OÜ 9,193 92 119.5 62 2,556 71 253.3 14 101.3 6 3,012 100 1,532 35 1,334 76 33.6%38 TECHNOMAR & ADREM AS 574,335 13 132.8 37 155,889 4 171.7 36 23.7 65 10,837 87 1,009 62 37,053 13 33.2%39 RAUAMEISTER AS* 93,774 46 139.3 29 16,307 35 230.3 20 52.8 27 18,154 47 1,116 54 2,000 68 32.5%40 VABA MAA AS 30,528 73 111.3 76 945 86 473.1 5 4.8 97 21,750 26 803 74 3,365 55 32.1%41 TERG OÜ 57,050 60 137.6 30 1,455 80 99.6 72 13.0 91 29,149 10 4,075 8 1,211 77 32.0%42 SANGAR AS 75,823 52 85.6 100 6,899 47 570.8 3 23.8 64 10,852 86 258 99 3,102 58 32.0%43 HAMMER SERVICE OÜ 6,390 94 103.9 88 658 92 296.2 12 46.7 32 19,255 38 1,420 37 49 97 31.6%44 PIPELIFE EESTI AS 387,333 17 116.6 68 1,722 78 12.0 97 1.6 99 28,402 13 5,380 4 31,425 14 31.4%45 AEROC AS 202,594 30 127.5 45 38,427 16 204.4 27 32.6 48 18,008 48 1,688 27 8,493 39 30.9%46 HOBBITON OÜ* 61,252 58 128.7 43 6,870 49 121.1 58 38.1 38 33,657 4 1,178 50 3,095 59 30.8%47 WELLSPA OÜ* 64,442 56 111.0 78 13,408 38 125.4 57 62.9 17 19,041 40 2,079 20 1,000 79 30.5%48 TARKON AS 698,748 10 124.3 50 34,319 20 185.6 33 36.9 39 11,966 81 1,359 41 10,700 33 30.0%49 EDELSTEIN OÜ 4,401 99 144.0 24 885 87 188.2 32 80.9 10 7,113 98 1,100 55 175 92 29.7%50 CHOU OÜ 7,551 93 110.4 79 754 90 258.6 13 80.4 11 10,835 88 260 98 54 96 29.4%51 PAEKIVITOODETE TEHASE OÜ 140,632 38 122.3 57 23,100 26 189.0 31 35.5 42 20,406 33 1,057 58 27,325 17 29.2%52 TALENT PLASTICS EESTI AS 43,858 67 167.7 9 3,581 62 130.8 53 65.5 15 10,872 85 933 67 23,083 20 28.9%53 ESTEL ELEKTRO AS 88,732 48 188.8 6 1,376 81 173.8 35 31.4 49 17,348 51 975 65 1,872 70 28.7%54 KALTSIIT AS 49,719 64 123.5 53 12,539 40 117.7 59 35.7 41 26,441 15 1,243 47 15,350 27 27.8%55 NELICO OÜ 41,984 69 146.7 20 3,868 59 179.8 34 48.9 28 13,630 71 1,135 53 3,215 57 27.6%1 EUR = 15.6466 EEK; 1 EEK = 0.0639 EUR; based on 2007 data See also www.konkurents.eeNovember 200861
Industrial and Energy EnterprisesPLACESALES CHANGE NET PROFIT CHANGE RETURN LABOUR COSTS EFFICIENCY PER INVESTMENTS % OFENTERPRISE IN SALES IN NET PROFIT ON EQUITY PER EMPLOYEE EMPLOYEE THE FIRST* group TH EEK PLACE % PLACE TH EEK PLACE % PLACE % PLACE EEK/month PLACE TH EEK PLACE TH EEK PLACE (0 .. 100)56 BLRT MARKETEX OÜ 542,676 14 184.2 8 4,571 55 23.4 95 28.0 54 17,320 52 1,918 21 1,796 73 27.0%57 PKC EESTI AS 341,448 20 133.1 36 20,413 29 142.4 47 56.2 24 13,908 70 269 97 1,812 72 26.7%58 UKSEKODA OÜ 32,101 72 150.3 18 884 88 202.6 28 14.5 87 23,031 22 917 68 1,379 75 26.2%59 JELD-WEN EESTI AS 633,882 11 124.2 51 38,211 17 87.4 77 22.9 69 11,790 82 865 71 88,139 4 25.0%60 M JA P NURST AS 113,721 41 134.0 35 7,847 44 207.6 26 27.3 57 12,717 74 980 64 22,492 21 24.9%61 RITSU AS 75,929 51 114.1 71 13,891 37 149.3 46 61.5 19 9,990 90 697 78 15,331 28 24.6%62 DELUX DOMOTEX OÜ 154,357 35 134.8 34 17,564 33 130.8 52 43.5 33 10,902 84 1,057 59 8,300 40 24.1%63 ENSTO ENSEK AS 516,577 15 116.6 67 31,493 21 82.5 80 20.7 74 15,659 60 1,825 25 9,200 37 24.1%64 PERFETTO STUUDIO OÜ 11,425 88 104.6 86 1,587 79 168.1 39 55.8 25 7,920 97 1,632 29 79 94 23.8%65 ESTIKO-PLASTAR AS 293,187 26 115.3 69 15,102 36 104.2 67 23.1 67 17,463 50 1,620 30 20,000 22 23.7%66 MARU METALL AS 111,589 42 126.7 47 7,841 45 108.9 64 30.5 52 19,366 37 1,213 48 2,470 64 23.4%67 NUIA PMT AS 64,024 57 113.1 75 7,751 46 137.4 49 27.8 56 22,356 23 889 70 4,993 47 23.4%68 PROMENS AS 180,375 32 109.8 82 21,056 28 100.0 71 34.4 44 16,319 56 1,317 44 18,425 23 23.3%69 OESE METALL OÜ 6,242 95 108.6 83 498 95 327.5 11 23.2 66 9,426 92 567 87 1,202 78 23.0%70 SYSTEMTEST OÜ 20,222 82 105.0 85 3,013 67 103.1 68 33.4 45 24,692 19 1,011 61 300 87 22.9%71 NANSO GROUP EESTI AS 65,094 55 113.7 73 1,886 76 126.1 56 57.0 23 13,377 72 505 91 6 101 22.5%72 ROOTSI MÖÖBEL AS 83,957 49 119.1 63 12,592 39 81.0 82 31.2 50 15,734 58 1,908 22 3,814 52 22.4%73 LAVINTON OÜ 13,701 86 114.1 72 1,992 75 101.6 70 36.2 40 18,785 43 1,305 45 739 82 22.2%74 HARKU KARJÄÄR AS 90,600 47 135.4 32 19,200 31 115.7 61 23.0 68 17,017 53 761 75 15,200 29 21.9%75 TERASMAN OÜ 66,565 54 98.2 92 1,731 77 228.4 21 13.2 90 19,613 36 756 76 4,612 49 21.8%76 AW NEOON OÜ 28,107 76 124.4 49 3,809 60 94.9 75 22.5 71 21,241 27 1,004 63 2,666 62 20.9%77 SAINT-GOBAIN SEKURIT EESTI AS 300,986 25 94.7 96 29,927 22 68.1 87 17.7 80 19,038 41 1,381 40 24,103 19 20.8%78 ESRO AS 79,959 50 125.4 48 8,083 42 67.6 88 10.9 95 20,126 34 1,568 33 6,745 42 19.7%62November 20081 EUR = 15.6466 EEK; 1 EEK = 0.0639 EUR; based on 2007 data See alsowww.konkurents.ee
Industrial and Energy EnterprisesPLACESALES CHANGE NET PROFIT CHANGE RETURN LABOUR COSTS EFFICIENCY PER INVESTMENTS % OFENTERPRISE IN SALES IN NET PROFIT ON EQUITY PER EMPLOYEE EMPLOYEE THE FIRST* group TH EEK PLACE % PLACE TH EEK PLACE % PLACE % PLACE EEK/month PLACE TH EEK PLACE TH EEK PLACE (0 .. 100)79 TERMIKS GRUPP OÜ 4,907 97 107.7 84 599 94 69.5 86 30.4 53 12,047 80 2,453 14 614 85 19.7%80 LOKSA LAEVATEHASE AS* 701,046 8 134.8 33 2,928 68 16.6 96 1.2 100 18,535 44 1,089 56 39,972 11 19.4%81 VÄNDRA SAETERITUS AS 18,786 84 110.2 81 2,537 72 132.6 51 25.2 63 17,550 49 626 83 3,653 53 19.3%82 FEIN-ELAST ESTONIA OÜ 73,990 53 110.2 80 8,045 43 85.4 78 17.6 81 19,075 39 1,358 42 937 80 19.2%83 MIVAR AS* 190,643 31 122.4 56 12,082 41 159.5 41 19.4 78 10,097 89 579 86 12,171 32 18.9%84 KIVIRAND OÜ 11,243 89 97.2 94 1,301 85 110.6 63 48.8 29 11,259 83 562 88 289 88 18.3%85 RAJA K.T. OÜ 47,129 65 130.1 39 4,541 56 81.0 83 26.7 58 9,159 94 1,571 32 5,500 45 18.2%86 PINUS ABJA OÜ 10,614 90 129.4 40 345 99 251.8 16 7.1 96 9,335 93 354 95 89 93 18.1%87 RAPALA EESTI AS 144,790 37 99.0 91 51,194 11 96.1 73 34.9 43 8,453 95 523 89 1,649 74 17.8%88 ENERPOINT SAARE OÜ* 137,000 40 129.2 42 4,461 57 102.0 69 20.2 75 12,215 79 901 69 100 17.7%89 IPM ELEKTROONIKA AS 52,735 63 127.5 46 2,880 69 114.7 62 19.9 76 14,905 62 488 92 3,571 54 17.6%90 NEFAB EESTI AS 166,227 33 98.0 93 6,754 50 51.4 93 13.9 88 20,606 31 1,319 43 3,304 56 17.4%91 SUWEM AS 42,347 68 152.8 14 3,050 66 152.5 45 25.5 62 2,777 101 706 77 2,458 65 17.4%92 SVEBA-DAHLEN OÜ 28,788 75 141.6 26 1,374 82 33.1 46 13,920 69 600 84 16,057 26 16.7%93 KATEKS SISUSTUS AS 25,691 77 117.7 66 1,320 84 72.2 85 12.3 92 19,866 35 676 80 2,238 66 16.2%94 INLOOK COLOR OÜ 29,650 74 120.1 60 3,112 65 11.2 94 22,261 25 1,140 52 683 84 16.0%95 ENGLO OÜ 4,128 100 82.2 101 737 91 62.4 91 32.8 47 15,726 59 688 79 55 95 14.7%96 KUUSAKOSKI AS 1,254 101 93.4 97 17 101 27.4 94 0.0 101 29,098 11 5 101 38,635 12 13.8%97 LEKU METALL AS 9,647 91 103.1 89 432 98 82.2 81 13.8 89 15,344 61 643 81 552 86 13.7%98 K.MET AS* 37,227 71 111.1 77 2,095 74 65.0 89 15.5 84 14,315 66 483 93 4,920 48 13.4%99 RÄPINA PABERIVABRIK AS 17,670 85 129.3 41 2,247 73 84.1 79 11.3 93 9,884 91 465 94 2,604 63 12.7%100 MS BALTI TRAFO OÜ 41,209 70 102.8 90 4,643 54 75.7 84 16.7 82 12,283 76 280 96 2,942 60 12.1%101 TNC-COMPONENTS OÜ 97,645 45 90.6 99 462 96 10.7 98 1.8 98 12,381 75 827 73 270 89 7.7%1 EUR = 15.6466 EEK; 1 EEK = 0.0639 EUR; based on 2007 data See also www.konkurents.eeNovember 200863
Competitiveness Ranking 2008The Most Competitive Food Industry Enterprise 2008SAKU ÕLLETEHASE ASCompetitive and initiative market leaderMember of the Management Board ofSaku Õlletehase AS, Inga Kuusik, is acheerful woman who is not at all ashamed tosay that she consumes more beer than theaverage person. Working “in beer” every dayhas made her a real patriot of her field of work,who says that true experiences should beoffered for drinkers of Saku beer and otherbeverages. Last year was a year of good resultsfor Saku itself and naturally, of some challengesand overcoming them.Did the economic decline last year influenceyour business much? How did you prepareyourself for it, what were your businessstrategies?Brewing beer is one fascinating branch of industry.The brewer’s possibilities of success areinfluenced by a variety of things, of which oneof the most important is weather and seasonality.My gut feeling says that the current beermarket of Estonia is much more influenced bythe rainy and cool summer than by the slowingdown of the economic growth.In the Estonian economy’s current stage ofslowing down of previous fast growth, there areno record-breaking financial results or a massiveincrease in production volume. There aredifferent ways of handling the situation. One ofthe keywords is export.Beer has a very local feel to it, but Saku is neverthelessvery popular among the Finns, andwe have had some success in the export marketsof Great Britain, Denmark, the Nether-PHOTO: TOOMAS TUULInga Kuusik, member of the Board ofSaku Õlletehas: “Saku has always beenand will always remain a symbol of ournational pride.”64November 2008
EESTI PARIMAD ETTEVÕTTED 2008lands, Belgium, Germany, Ireland and Canada.We can also talk about the cost optimizing – itis now a natural part of Estonian companies.At the same time, we cannot forget that Saku isthe leader of the Estonian beer market and thusit dictates the behaviour of other producers byits activity. That is why we have to keep ourstandards high, in quality, branding, the fieldof social responsibility and as an employer. Weare not afraid of challenges that may come toour way in the future. We have actually survivedworse times.What was the biggest challenge last year?How did you overcome it?The biggest challenge last year was the sales restrictions.It was a pity to witness a situationwhen you could not buy beer from a shop aftereight o’clock. Summer days are long and beer isa kind of thing you buy just before consumingit. If you were planning a sauna evening to startat ten and you got to a shop at nine, it wouldmake you really bitter – what am I going todrink in the sauna now? Luckily, the rules are abit more relaxed now and I think the politiciansmade a reasonable decision in the end.There has always been heavy competition inthe beer market – how would you assess thecompetition now, has it become tougher?Competition is always a positive occurrence. Asthe market leader Saku has the initiative, theinnovativeness and the edge. Our competitorhas a noticeably easier life – they can do similarthings to us after we do them and try to beatus with that. But Saku’s speed of activity has alwaysbeen faster and everything that the competitordoes is usually slightly copied.At the same time, there could very well be morecompetitors and they could be more diverse,because two big names in a market are a worseoption for the consumer than five or six. Therejust are not many alternatives.Because beer is so closely intertwined with thesense of nationality, namely the domestic producerscould provide the consumers with moreoptions. The market share of foreign beers inEstonia is marginal and does not influence us asdirect competition.At the same time, the competition is a lottougher within other product groups than withbeers. There is a very wide selection of tablewater in the shops, also ciders, cocktails andlong drinks. When we leave beers out of theequation, then as far as products are concerned,the market really is much more colourful andinteresting.What was the biggest investment last yearand why did you decide to invest moneythere?Naturally, we have constantly updated the productionlines, in order to guarantee the topquality of our products. That is the basis foreverything. From then on, the second most importantinvestment has been put into the reputationand marketing of our brands. As Sakuidentifies itself foremost as a modern brewer,an important task for it is to develop domesticbeer brands. Additionally, we have invested alot in the reputation and marketing of otherdrinks.One might start feeling sorry for the moneyspent on advertising, but it is obvious that ourbrands are one of the strongest in Estonia andthey cannot lead a life of their own, they mustbe guided as well. Thirdly: people. Qualifiedwork force is the key for everything for abeverage producer.Beer has a symbolic meaning because it carriesthe sense of national pride: no-one is very likelyto love the beer of their neighbours, unless theyhappen to be visiting. Saku has continuouslyinvested in national projects and projects thatincrease our self-pride, such as co-operationwith the art museum KUMU, Estonian topskiers, athletes and Viljandi Folk Music Festival.It is also no secret that we are the most importantco-operation partner of our national hero,Gerd Kanter.What has surprised you the most lately?What surprised me the most was indeed whenour own politicians wanted to slightly damagethe economic success of Estonia by imposingdifferent restrictions. No matter what, the alcoholproducers are one of the top tax payers in acountry and our success is really a source of incomefor the country as well.Saku has unarguably been a success story of theeconomy of the time of restoration of Estonianindependence. The secret behind this successhas been a precise and right starting push at thebeginning of the 90’s. And the guarantee forthat success is that the positions gained havebeen held correctly. As Estonia’s independencewas being restored, foreign partnerships helpedSaku to break through the „Žiguli-era“ at theright time. Saku was the first sign of somethingachieved in the new era, an example of somethingold and mediocre actually becoming asymbol of top quality.Saku showed that the cleverness of Estoniansonly needed a tiny push from the foreign capitalto really get going and handle the expectationsof the market.I think that Estonians love Saku namely becausevery good beer was available practicallyovernight. From my personal experience I cansay that for many people, the beer era in Estoniastarted 15-16 years ago, when Saku releasedits brand new Originaal to the market.What is the vision of the company, whatwould you like to achieve? Are there anyfields of business you will never enter?The vision of Saku Õlletehase AS has a rathersimple wording – to offer people thrills, emotions,and a refreshing experience. I think thatin our field of business it is important to offertrue enjoyment for the fans of Saku beer andother beverages.The beer is really one of many enjoyments, butdrinking beer is usually accompanied by saunaevenings or gatherings with your friends andfamily, barbecue parties, good food and latenighttalks.I think that throughout the time of restorationof independence Saku has been the companywith the best vision in Estonia. Saku has investedin it to a great extent as well. I am gladthat it has been recognized and praised in manyplaces. In the end, beer is the national drink ofEstonians, and also the drink of intelligent andreasonable people. Beer culture is a part of ournational culture, and as the market leader wemust keep the standards high.Besides beer, Saku really makes very goodciders, long drinks, different cocktails and a lotmore. Every product that comes out of our facilitieshas to be the creme de la creme. Thathas been agreed on and it will remain like that.What we will probably never produce, however,is whiskey, calvados and brandy. No-onecould simply do it here, there is no experiencein that field and let it stay like that!How would you assess the Estonian economicpolicy? What do you think could bedifferent in the tax policy, for instance?What do you think about the change in therestriction of alcohol sales?The liberal economic policy of Estonia has recentlystarted to ignore the needs of alcoholmanufacturers. It is a pity because Saku has alwaysbeen and will always remain a symbol ofour national pride and I would not want thepoliticians to be irresponsible about it.Sales restrictions, sky high alcohol excise andadvertising restrictions account for just a few ofthe examples. I am absolutely certain that noNovember 200865
TOP ESTONIAN ENTERPRISES 2008restrictions can fight against the real problems;these things start from elsewhere – from homes,schools, streets. According to studies, the reasonfor the problems of our nation is strong alcohol.Alcohol problems in Estonia do not startwith beer.Unfortunately, the fight against overconsumptionis not influenced by the fact that minorswould not be able to buy alcohol from theshops, but rather the fact that young peopleshould have more possibilities for spendingtheir free time and having hobbies. If I were apolitician, I would not put all my efforts intocomplaining about the consequences, but Iwould rather try to find solutions for the reasons.In fact, everything that happens in the surroundingenvironment influences Saku – Sakuis a part of the entire surrounding environment,not just the economy. A company this big is inevitablylinked to our social, cultural and alsoregional networks. Through several initiativesand also by setting a personal example we havemade the society understand that we are aresponsible company, and Saku will definitelycontinue being one in the future as well.Is there any significant difference between awoman or a man working with beer?Men tend to admire themselves more maybe,but women have the chance to make a biggerteam think and converse. The ability to listenand sense their work environment in ethicalcategories may be the factors that give womenthe edge in management today. At the sametime it does not really matter, because it is notappropriate to ask professionals their gender.In the 21st century it would simply be discriminatory.Beer as a quality product has become more andmore a women’s drink as well, and that is whywomen are an equal executive force in thebrewery with men.How big of a beer drinker are you personally?What product are you particularlyhappy about?I might drink a bit more than the average consumer.I prefer lighter brews. Among myfavourites are definitely On Ice, Kuld andOriginaal. At Christmas – porter, of course.I am glad that Saku brews the best beers inEstonia and I couldn’t really pick a certain brew.In the end, the beers that tough men like todrink in front of small country shops must alsohave the best quality and taste. When the labelon the bottle spells Saku, quality should be thefirst thing it brings to mind.What keeps your spirit rejuvenated? How doyou keep yourself motivated?I keep my spirit fresh with travelling, readingand thinking. A good book, the sea and mountainsmotivate me far more than a luxuriouslifestyle or a fast car. My three children are veryimportant to me. I like heights, I have climbedKilimanjaro, I have been to the K2 base camp inPakistan, and I plan to reach the bottom ofMt Everest. On top of that I like the Estoniannature. And well, it would not be a bad idea tohave a pint of good beer next to all of that.SAKU ÕLLETEHASE AS 2007Sales (th EEK) 911,685Change in sales 118.4%Net profit (th EEK) 100,923Change in net profit 87.9%Number of employees 300Investments (th EEK) 88,343Return on equity 139%Place in the CompetitivenessRanking 2008 139Food Industry EnterprisesSALES CHANGE NET PROFIT CHANGE RETURN LABOUR COSTS EFFICIENCY PER INVESTMENTS % OFENTERPRISE IN SALES IN NET PROFIT ON EQUITY PER EMPLOYEE EMPLOYEE THE FIRST* group TH EEK PLACE % PLACE TH EEK PLACE % PLACE % PLACE EEK/month PLACE TH EEK PLACE TH EEK PLACE (0 .. 100)1 SAKU ÕLLETEHASE AS 911,685 2 118.4 6 100,923 2 87.9 6 26.5 5 26,708 1 3,039 1 88,343 2 100.0%2 RAKVERE LIHAKOMBINAAT AS* 1,888,061 1 111.1 8 124,759 1 68.9 10 13.0 9 14,111 5 1,379 6 142,900 1 87.5%3 SPRATFIL AS 89,605 7 103.2 9 25,791 4 54,928.7 1 106.6 1 12,266 9 622 11 442 11 57.3%4 PÕLTSAMAA MEIEREI JUUSTUTÖÖSTUS OÜ 151,000 5 121.8 4 21,100 5 151.5 3 56.1 3 10,972 10 2,517 2 6,500 6 49.4%5 PÕLTSAMAA FELIX AS 284,440 3 151.7 1 7,423 7 126.7 4 7.5 11 14,077 6 1,361 7 39,358 3 46.6%6 KRAPESK AS* 36,107 11 97.2 10 27,002 3 444.2 2 82.3 2 18,102 2 737 10 2,167 8 44.7%7 VÄRSKA VESI AS 69,502 8 139.3 2 3,106 9 82.3 8 28.1 4 15,792 4 1,616 4 12,718 4 42.6%8 EESTI MUNATOOTED AS* 45,500 10 119.8 5 452 11 21.9 7 16,369 3 2,167 3 770 10 36.8%9 SALVEST AS 169,400 4 123.5 3 15,706 6 126.2 5 17.5 8 12,658 8 1,137 8 10,704 5 30.4%10 MELECO AS 111,839 6 114.7 7 7,001 8 75.6 9 22.7 6 13,287 7 1,086 9 1,437 9 23.7%11 KAJAX FISHEXPORT AS 49,777 9 91.9 11 2,252 10 84.9 7 9.5 10 8,892 11 1,464 5 2,368 7 9.3%PLACE66November20081 EUR = 15.6466 EEK; 1 EEK = 0.0639 EUR; based on 2007 data See also www.konkurents.ee
Competitiveness Ranking 2008The Most Competitive Construction Enterprise 2008OMA EHITAJA ASThe time of breakingthrough the competitionOma Ehitaja is a rather new agent in theEstonian construction market. The year2007 was the second full year of business in thehistory of the company. “Our biggest challengelast year was to prove that the company OmaEhitaja that was founded in October 2005 isnot a short-term project, but that it was establishedfor a long-term activity in the Estonianconstruction market. It is good to say now thatjoint work efforts have created a stabile-runningcompany,” Kaido Fridolin, the CEO of the companyis convinced.The CEO was very satisfied with the previousyear – the turnover grew almost two times andthe profit more than six times. “We secured ourposition and fame in the Estonian constructionmarket. Because of that, last year can be consideredto have been successful in every way.We can also be satisfied with the fact that wemanaged to duly fulfil all our obligations to ourcustomers, and the relations with subcontractorsand partners have so far been constructiveand active. During 2007, the following largerconstruction objects were completed and givenover to the customers: the expansion of theshopping centre “Kaubamajakas” in Pärnu, theoffice building of Pärnu City Government, anoffice building (the restaurant Mercado) inÜlemiste City in Tallinn, the production facilityof the catering kitchen of AS A-Selver in the in-PHOTO: TOOMAS TUULKaido Fridolin, Manager of Oma Ehitaja:“We secured our position and famein the Estonian construction market. Becauseof that, last year can be consideredto have been successful in every way.”68November 2008
TOP ESTONIAN ENTERPRISES 2008The primary activity of Oma Ehitaja,founded in the year 2005, is constructionplanning and building using themethods of general contracting, designand build contracting or projectmana gement with full responsibility; thecompany is also involved with real estateand project development and projectmanagement. In real estate development,the company does everythingnecessary starting from the detailedplanning of lots and ending with salesand warranty services. One of the morerecent and bigger projects for the companyis the construction of the undergroundparking lot on Vabaduse square.The work will be finished by summernext year.dustrial park in Lasnamäe, and the office buildingand factory of AS Sarkop in the rural municipalityof Rae.The people are the greatest assetThe economic decline last year did not influenceOma Ehitaja. It is only natural because theeconomic growths and declines influence thebuilding sector only after a delay of a year oreven longer. This year, the company has takenthe changes into account and according to theCEO, one of the more important keywords area good-quality service, honouring agreements,balanced decisions and effectiveness.Right at the start of the chat Fridolin reachesthe importance of people working for a company.“The biggest asset of Oma Ehitaja is itspeople. Even though Oma Ehitaja is a relativelyyoung enterprise, people who work there havea long-term construction experience. Duringtheir careers, our specialists have worked forboth smaller enterprises and in the workingconditions of an international group (FKSM,YIT) and managed several large buildingpro jects. The more important decisions aretaken in co-operation with the colleagues. Becausethe Estonian economic environment andeconomic growth are showing signs of coolingdown, especially regarding the real estate developmentand the building sector, then wehave no reason to plan a great expansion for thenext coming years. At the same time, a normalportfolio of contracts guarantees stability andprofitable business for a company.” Accordingto the CEO, the employees of the company aremotivated by stability and the fact that their resultsare valued.The good thing is that even when a year ago,problems with work force were perfectly ordinaryoccurrences in the construction market,then now the situation is a little bit different.“Good specialists have always been sought afterand they have no problems with finding work.Oma Ehitaja has a good and balanced team ofspecialists. We have both specialists with along-term construction experience and youngpeople who are eager to learn. We have consciouslytaken this direction when developingthe work force.”Competition in the Estonian constructionmarket has become significantlyheavierIt takes some courage to jump into the heavycompetition in the Estonian construction market.Oma Ehitaja did succeed with that leap offaith. When comparing the current situationwith the years 2005 and 2006, the competitionhas clearly become tougher and staying on themarket isn’t the easiest of tasks. Kaido Fridolinis convinced that the situation today is rathersimilar to the years 1998/1999, so the situation10 years ago. He says that at the same time,competition is always a welcome and healthyphenomenon. During recent years, constructioncompanies have constantly been enteringand disappearing from the market. He thinksthat only strong companies will remain stabilein their business.The important characteristics of agood leaderA good leader should be a role model for his employeesand the engine of the company, Fridolinis certain. Adhering to agreements is also important,of course. “One of my mottoes has been totreat people or employees equally, regardless oftheir gender, nationality or position on the careerladder. The employee’s contribution to the developmentof the company is also important andit should be valued. Training is definitely necessary.A precondition for that is that the personhimself wants to develop and learn, because youcannot force someone to be wise. Thus, individuallearning also plays a big part. A lot is learnedthrough doing something. In our company, thereis great co-operation and study between an experiencedproject or object manager and a youngconstruction specialist with a wish to develop.”The fact that Kaido Fridolin ended up in thebuilding sector was not accidental. After graduatingfrom TPI and getting the diploma of a constructionengineer he fully dedicated himself tothat line of work. By now, he has been involvedin construction for 20 years of his continuousworking life. “Construction is a sector wherethere are no standard solutions, as a rule. Everyproject is unique. What you do will be seen fordecades.” The formula for motivation is simplefor the CEO, “I like this job, and it gives me achance to provide my family with normal livingconditions.”OMA EHITAJA AS 2007Sales (th EEK) 576,027Change in sales 199.4%Net profit (th EEK) 43,037Change in net profit 677.5%Number of employees 60Investments (th EEK) 1,095Return on equity 128.1%Place in the CompetitivenessRanking 2008 4November 200869
TOP ESTONIAN ENTERPRISES 2008Construction EnterprisesPLACESALES CHANGE NET PROFIT CHANGE RETURN LABOUR COSTS EFFICIENCY PER INVESTMENTS % OFENTERPRISE IN SALES IN NET PROFIT ON EQUITY PER EMPLOYEE EMPLOYEE THE FIRST* group TH EEK PLACE % PLACE TH EEK PLACE % PLACE % PLACE EEK/month PLACE TH EEK PLACE TH EEK PLACE (0 .. 100)1 OMA EHITAJA AS* 576,027 9 199.4 4 43,037 10 677.5 1 128.1 3 79,327 1 9,600 4 1,095 38 100.0%2 NORDECON AS* 3,779,188 2 149.9 19 392,371 2 113.7 35 40.0 32 37,529 5 3,292 15 413,583 1 90.3%3 MERKO EHITUS AS* 5,510,760 1 124.8 35 545,049 1 93.7 43 30.2 42 40,864 3 5,273 7 84,497 4 84.5%4 EESTI EHITUS AS* 3,752,028 3 149.9 20 289,771 3 154.1 21 44.7 31 34,861 8 3,402 14 222,287 2 75.9%5 PAG AS 72,444 28 242.2 3 10,460 29 346.3 7 136.0 2 20,959 24 10,349 3 479 42 71.8%6 TARTU EHITUS AS 128,691 25 171.1 11 14,748 22 642.1 2 156.8 1 19,781 31 3,785 13 476 43 68.8%7 KAAMOS EHITUS OÜ 166,501 23 182.3 8 14,473 24 145.4 24 92.3 9 35,422 6 16,650 1 290 47 65.9%8 TVS PARTNERID AS 24,424 47 291.3 2 1,864 46 523.5 3 108.7 5 20,710 29 1,285 38 134 50 64.6%9 MERKO TARTU AS 356,022 12 131.3 27 22,882 17 136.7 29 55.5 24 35,368 7 16,183 2 460 44 54.8%10 EBC EHITUS AS 230,903 17 194.4 6 25,531 14 427.8 4 116.6 4 17,262 38 1,471 30 5,960 18 53.8%11 LINNAEHITUS AS 655,519 8 121.6 37 74,562 4 110.5 36 56.1 23 58,683 2 8,740 5 2,344 30 53.2%12 MAPRI PROJEKT OÜ 395,602 11 198.3 5 31,503 12 163.4 15 95.7 7 33,259 9 1,958 21 5,349 21 48.1%13 AEK OÜ 76,461 27 184.0 7 9,735 30 255.9 10 95.9 6 20,824 26 4,024 11 224 48 46.3%14 ABSINT OÜ* 36,383 40 295.8 1 6,314 33 141.9 27 67.8 17 17,393 37 1,915 22 5,000 22 44.9%15 EHITUSFIRMA RAND & TUULBERG AS* 1,008,785 5 163.3 12 50,154 9 198.3 12 51.7 25 26,493 13 3,941 12 10,894 13 43.1%16 FERDMASTER OÜ 181,718 22 177.3 10 19,010 18 274.4 9 84.1 11 19,001 33 2,089 19 16,607 10 42.7%17 LOODESYSTEM OÜ 62,935 31 160.0 13 2,227 44 353.7 5 73.6 15 24,385 15 1,614 27 3,376 28 41.1%18 TELORA-E AS 51,652 37 150.7 18 13,618 27 132.3 30 94.0 8 39,258 4 1,435 35 4,711 23 40.6%19 TEEDE REV-2 AS 877,990 6 103.1 41 58,058 7 189.8 13 78.7 13 26,178 14 2,523 16 37,058 5 40.0%20 ESTON EHITUS AS 290,785 14 182.2 9 23,365 16 156.9 20 33.0 39 28,374 12 5,014 8 858 40 37.8%21 ASPI AS* 1,228,340 4 125.0 34 68,476 5 143.1 25 33.1 38 24,351 16 1,783 23 92,155 3 36.7%22 ELWO AS* 213,656 20 156.0 16 17,549 19 287.1 8 58.5 21 20,730 27 876 48 6,953 16 35.0%23 IREST EHITUSJUHTIMISE AS* 414,949 10 140.4 23 24,769 15 97.2 42 57.6 22 13,337 49 5,844 6 4,332 25 32.4%24 FELITON OÜ 29,531 46 159.4 14 3,132 41 107.6 37 89.8 10 19,279 32 1,284 39 330 45 32.2%25 FINNLAMELLI EESTI OÜ 50,916 38 125.5 33 4,457 36 142.0 26 83.4 12 20,974 23 1,455 32 1,405 35 30.0%26 ELEKTRIMEES OÜ 22,400 48 152.6 17 2,241 43 165.4 14 69.7 16 15,579 43 1,723 24 53 29.7%27 HARJU EHITUS AS* 261,792 15 119.6 38 36,768 11 101.3 40 47.2 29 21,759 19 4,593 10 5,516 20 29.5%28 LASBET AS 220,566 19 124.7 36 66,864 6 139.7 28 47.5 28 23,242 18 1,050 43 27,780 8 29.1%29 RAPLA TEED OÜ 226,588 18 142.9 21 15,584 21 117.7 34 46.7 30 20,428 30 1,462 31 30,839 7 27.7%30 YIT EMICO AS 53,019 34 141.0 22 4,001 38 77.5 14 23,682 17 2,039 20 60 51 27.7%31 SOVEK AS 54,552 33 132.1 26 4,355 37 130.6 31 63.6 19 20,717 28 1,399 36 1,750 32 26.9%32 ELEKTRITSENTRUM AS* 253,808 16 134.1 25 13,689 26 154.0 22 30.1 43 21,654 22 1,511 29 9,374 14 24.7%33 ET TOREL OÜ 22,106 49 126.8 32 4,474 35 160.0 17 65.0 18 14,874 46 819 50 1,709 34 24.7%34 TALTER AS 741,622 7 94.6 45 51,220 8 104.8 39 27.5 46 21,673 21 2,194 18 26,752 9 24.2%35 SUJA EHITUS OÜ* 35,374 42 138.1 24 1,627 50 211.3 11 33.9 37 16,490 41 1,179 40 1,180 36 23.6%36 VALMAP GRUPP AS 66,396 30 115.7 39 14,500 23 157.5 19 50.0 26 16,817 39 935 47 5,846 19 22.7%37 MARU EHITUS AS* 302,929 13 77.3 53 14,448 25 90.4 46 22.9 47 29,766 11 4,660 9 3,531 27 22.6%38 VÄNDRA MP OÜ 123,072 26 126.8 31 12,554 28 98.7 41 29.1 44 21,733 20 1,619 26 16,091 11 21.7%39 WINDOOR AS 60,782 32 131.0 28 8,630 31 105.6 38 36.3 35 18,536 35 1,520 28 780 41 21.0%40 TEEDE TEHNOKESKUS AS 52,279 36 115.6 40 3,272 40 130.3 32 14.4 49 31,277 10 830 49 1,733 33 19.7%41 HOTRONIC AS 68,933 29 128.2 30 1,865 45 161.9 16 17.3 48 18,798 34 1,352 37 5,961 17 19.5%42 TOP MARINE OÜ 11,698 53 87.1 50 1,735 49 147.2 23 50.0 27 15,403 44 1,671 25 7,151 15 19.2%43 SILBET AS 153,704 24 90.0 48 25,927 13 158.2 18 36.6 34 12,794 50 1,114 42 31,342 6 19.2%44 SAMESTI METALL OÜ 2,687 55 96.3 44 51 55 347.1 6 11.5 50 14,943 45 537 55 55 18.8%45 TELEEKSPERT AS 37,117 39 156.8 15 566 52 75.2 50 10.7 53 17,465 36 977 45 1,074 39 16.8%46 MATEK AS* 182,964 21 96.6 43 15,765 20 82.7 48 32.4 41 16,499 40 1,441 34 4,648 24 16.3%47 RUUT EHITUSE OÜ 14,769 51 69.9 54 2,276 42 121.4 33 60.7 20 9,126 53 1,136 41 54 15.0%48 GASPRE OÜ* 30,355 45 88.1 49 3,918 39 65.4 51 28.4 45 20,959 25 1,445 33 1,851 31 14.2%49 E-KATUSED OÜ 4,549 54 92.4 47 164 54 90.3 47 37.5 33 14,571 47 650 53 140 49 13.4%50 VÄNDRA TARE AS 31,365 44 102.9 42 1,804 47 90.8 45 34.9 36 6,323 55 729 51 2,693 29 11.8%51 TSM AS* 35,890 41 82.2 52 6,899 32 93.6 44 9.2 54 16,357 42 2,393 17 47 52 11.4%52 VIRTEL GRUPP OÜ 14,569 52 130.2 29 350 53 61.0 53 8.6 55 10,729 52 662 52 1,119 37 10.4%53 PEETRI PUIT OÜ 33,981 43 63.5 55 6,170 34 79.6 49 33.0 40 11,792 51 944 46 13,700 12 9.9%54 TÕRVA ELEKTER AS 16,115 50 93.9 46 1,769 48 61.5 52 10.8 51 7,237 54 1,007 44 296 46 6.4%55 SAARE EREK AS 53,001 35 86.7 51 1,607 51 15.8 54 10.7 52 13,842 48 576 54 4,010 26 5.8%70November20081 EUR = 15.6466 EEK; 1 EEK = 0.0639 EUR; based on 2007 data See also www.konkurents.ee
Competitiveness Ranking 2008The Most Competitive Communication and IT-services Enterprise 2008EESTI TELEKOM ASConstant readiness for innovationsEesti Telekom wishes to be one of the bestcustomer service companies’ group inEstonia. “Considering our field of business, wewould also like to be the pioneers of the informationsociety,” says Valdo Kalm, chairman ofthe board of Eesti Telekom.Last year was a successful year for EestiTelekom and the decline in economic growthwas felt only at the end of the year as the salesof goods decreased. It means that there werenot any great changes regarding services, butfewer computers, TV-s and phones were sold.So the influence was not significant. Despite allthis, the company looks towards the future andinitiated some effectiveness programmes in itssubsidiaries already in the second half of lastyear, and those programmes will be continuedthis year as well.“Signs that the economy would become weakerwere visible already in spring last year, and wediscussed different plans with the members ofthe board. Because as a rule, the cyclical natureof economy does not influence the main line ofbusiness of Eesti Telekom to a great extent, wehave not planned any major changes,” Kalmstates. The CEO adds that he was surprised thatthe changes in the economy were noticed veryValdo Kalm, the CEO of Eesti Ttelekom:“The current economic situation needsmore control over the economy and lessliberalism.”PHOTO: TOOMAS TUULNovember 200871
TOP ESTONIAN ENTERPRISES 2008late. “The current economic situation needsmore control over the economy and less libera -lism,” he thinks.The courage of re-evaluatingdecisionsManaging a great company can sometimesmean re-evaluating decisions. Many rememberthe flexible behaviour of EMT at the time whenthe company decided to charge calls by theminute. This decision was followed by an angryreaction of the consumers and a general beatingin the press. Valdo Kalm says explicitly that inthe mobile business, they underestimated theinfluence of billing principles on the consumer,and therefore they had to re-evaluate the olddecision based on the market situation. Theydiscarded the idea of minute-based billing andthe new system of benefits that was going tocompensate for it, and all contractual customerskept their second-based billing of themobile services. Decisions like that call for determinationand admitting of mistakes, whichcan be seen only in very few companies. “Welistened to our customers and we understoodthat the market is not ready to let go of the currentsecond-based billing,” Kalm states.Competition in the field of telecommunicationshas traditionally been very tense in Estonia andlast year was no exception to that, perhapsthere were even more tricks noticeable to lurecustomers from competitors. “It seems to mesometimes that the methods of fighting of thecompetitors in the telecommunications sectorsare somehow rough, but maybe I am wrong ...,”Kalm says. There is certainly some truth aboutthe opinion of CEO of the large company. Almosteveryone has noticed the price fight overcustomers and people are used to the fact thatan advertisement for one operator can containcovert and sometimes quite overt criticism ofanother operator.”Competition in our branch of economy istough indeed, especially in the mobile sector.At the same time, I have noticed that the competitorsare trying to copy EMT as the marketleader more and more.”Investments for the picky customerThe biggest investments last year were madeinto the development of broadband in Elionand the 3G network in EMT namely becausethe future services will be based on broadbandinternet and content services. Because the localcustomer is quite picky, the company has to beable to offer something new all the time. Oncethey have won the customer over, they cannotrest on laurels. In the field of telecommunicationswhere technology is constantly developing,they must be up-to-date. “Estoniancustomers value the quality of both the serviceitself and the customer service. Because we areable to offer that, our customers are loyal to us.At the same time, we must be involved with innovation.A few of the innovations introducedlast year were the mobile ID-card in EMT thathas altogether 10 000 users and theDigiTV rental service used in Elion that hasaltogether 25 000 users by now. For instancelast year, Microlink introduced to the marketthe so-called incubator service for startingbusinesses.”EESTI TELEKOM AS 2007Sales (th EEK) 6,261,002Change in sales 108.6%Net profit (th EEK) 1,511,548Change in net profit 115%Number of employees 2327Investments (th EEK) 862,510Return on equity 35.9%Place in the CompetitivenessRanking 2008 3THE HISTORY OFEESTI TELEKOM1993Founding of the joint venture EestiKaugotsing in co-operation with TelecomFinland – this meant a new field ofactivity for Eesti Telekom.1997The former state enterprise was restructuredas the joint venture Eesti Telekom;and in the same year, the governmentdecided to sell up to 49% of thetelecommunications company by meansof a public auction.1999The initial public offering of shares(IPO) took place at the beginning of theyear 1999; and as the result of that, institutionaland private investors purchased49% of the shares that hadbelonged to the Republic of Estonia.Eesti Telekom became a public companywith shares listed on the Tallinn andLondon stock exchanges.2005At the end of October, EMT was the firstin Estonia to launch a commercial 3Gmobile communications network togetherwith mobile TV, video calls, fastermobile Internet and other new generationmobile communication services.Elion acquired the Estonian operationsof MicroLink Eesti, the leading IT companyin the Baltic states. The acquisitionof MicroLink enabled the company tooffer an even larger selection of IT andtelecommunications services and integratedsolutions to its customers.2006In April, AS EMT purchased 51% ofSerenda Invest OÜ, which owns thetrademark Rate and administers thewebsite Rate.ee, an online communicationenvironment primarily intended foryoung people.Elion introduced DigiTV to the market,which was offered to customers as a partof the Kodulahendus (Home solution)triple package.72November2008
TOP ESTONIAN ENTERPRISES 2008Communication and IT-services EnterprisesPLACESALES CHANGE NET PROFIT CHANGE RETURN LABOUR COSTS EFFICIENCY PER INVESTMENTS % OFENTERPRISE IN SALES IN NET PROFIT ON EQUITY PER EMPLOYEE EMPLOYEE THE FIRST* group TH EEK PLACE % PLACE TH EEK PLACE % PLACE % PLACE EEK/month PLACE TH EEK PLACE TH EEK PLACE (0 .. 100)1 EESTI TELEKOM AS* 6 261 002 1 108,6 23 1 511 548 1 115,0 19 35,9 18 29 077 12 2 691 11 862 510 1 100,0%2 EMT AS * 3 904 000 2 112,0 22 935 000 2 109,2 21 58,9 9 31 685 8 7 284 2 330 000 3 83,5%3 CYBERNETICA AS 92 669 10 218,7 1 16 218 8 430,9 1 98,3 4 27 655 13 986 19 1 450 10 76,9%4 BALTRONIC OÜ* 307 776 5 159,0 6 54 088 5 286,4 4 129,3 1 26 391 15 5 596 3 1 851 9 73,6%5 NET GROUP OÜ 91 571 11 180,6 2 6 966 13 289,5 3 107,6 2 24 851 18 2 954 7 2 198 7 65,7%6 TELE2 EESTI AS 1 898 719 4 112,1 21 526 042 4 109,5 20 24,1 24 22 254 21 12 410 1 182 078 4 62,9%7 SONA SYSTEMS OÜ 4 098 26 163,8 4 1 780 22 393,2 2 107,5 3 12 336 26 4 098 5 1 007 12 62,5%8 ELION ETTEVÕTTED AS* 3 086 758 3 108,4 24 592 563 3 115,7 18 29,1 20 22 893 20 1 866 12 536 618 2 58,6%9 Max 123 AS 161 921 7 154,5 7 9 510 11 168,8 10 73,1 5 29 182 10 5 060 4 322 19 54,5%10 EXXI AS 12 335 23 164,9 3 2 318 20 162,7 13 56,8 11 37 957 2 3 084 6 106 24 53,9%11 TELEGRUPP AS 114 815 9 147,2 11 11 156 10 212,8 7 67,7 7 34 528 5 2 944 8 811 13 53,9%12 ICEFIRE 29 663 17 132,5 14 9 047 12 168,2 11 68,8 6 45 068 1 1 211 15 774 15 52,1%13 WEBMEDIA AS 134 509 8 146,6 12 22 096 6 136,9 15 52,3 12 32 128 7 801 23 4 861 6 41,1%14 ANDMEVARA AS 49 613 16 149,5 9 6 040 15 218,4 6 36,5 17 29 142 11 719 24 712 16 40,5%15 PROEKSPERT AS* 61 904 13 131,9 15 12 130 9 120,2 17 57,8 10 34 118 6 967 20 782 14 39,7%16 TELCO AS* 26 323 18 139,2 13 5 006 16 157,1 14 59,7 8 25 044 16 1 385 14 2 173 8 38,3%17 LINXTELECOM ESTONIA OÜ 68 501 12 151,5 8 2 479 19 11,6 27 35 557 3 2 740 9 14 608 5 33,5%18 COLUMBUS IT PARTNER EESTI AS* 57 475 14 148,0 10 3 428 18 34,5 19 34 860 4 1 084 17 124 23 33,3%19 POSTIMEES AS 246 628 6 122,4 17 19 567 7 177,4 9 37,1 16 24 946 17 1 142 16 1 300 11 32,5%20 VÕRGUVARA AS 54 263 15 161,7 5 3 777 17 97,4 22 25,1 23 20 165 23 2 713 10 248 20 31,4%21 AQRIS SOFTWARE AS 20 549 20 107,9 25 6 307 14 202,5 8 48,5 13 24 261 19 604 25 184 21 31,1%22 MOBICOM AS 8 430 24 122,0 18 438 25 242,5 5 11,7 26 21 611 22 1 405 13 88 27 28,4%23 EKTACO AS 23 745 19 102,4 26 2 128 21 124,3 16 39,5 15 26 919 14 879 21 700 17 26,1%24 BCS ITERA AS* 18 593 21 86,9 27 1 310 23 51,5 23 41,5 14 30 501 9 1 033 18 141 22 22,1%25 RESTA AS 6 721 25 115,4 19 163 26 165,9 12 29,0 21 16 984 24 395 27 91 26 21,3%26 MOBI SOLUTIONS OÜ* 18 439 22 127,8 16 844 24 30,6 25 19,8 25 15 132 25 802 22 95 25 13,5%27 MIKARE BALTIC OÜ 3 178 27 112,5 20 53 27 44,7 24 27,3 22 9 145 27 530 26 415 18 8,6%1 EUR = 15.6466 EEK; 1 EEK = 0.0639 EUR; based on 2007 data See also www.konkurents.eeNovember 200873
Competitiveness Ranking 2008The Most Competitive Forestry and Agricultural Enterprise 2008OILSEEDS TRADE ASA farmer is eternally rich!Veikko Vahar, the CEO, describes himself asan initiator and he is inspired by the startingand initiating new projects. An initiative likethat was much needed during the first stages ofthe creation of the company. “We were employeesin the Tallinn office of Werol, when they announcedto us that the office in Tallinn will beclosed. We offered to the management of Werolthat we would create a trading company next toWerol based on the office in Tallinn, but that offerdid not find any support. Because we had faithin the endeavour and we had the contacts andthe know-how, it seemed to be the only logicalstep. So our enterprise was born. As we werestarting out, the main problem was the lack ofturnover capital, but thanks to the faith SampoBank (Danske Bank by now – ed.) had in us andthanks to out own savings we got started, and inaddition I would like to send my special thanksto Heino Harak, who has supported us throughthe hard times,” Vahar says.Ideas must be grandThe CEO says that among the circle of ownersthey have jokingly said that the problem of Estoniansif the absence of grand plans, but that fortunately,they do not have that problem. Withoutgreat plans you could not work in Oilseed’s fieldof business, because the competition is verytough. They must be able to compete in the marketwith the subsidiaries of big groups such asKesko, Kemira and Farmplant.The CEO thinks that last year was rough but suc-PHOTO: TOOMAS TUULVeikko Vahar, the CEO of OilseedsTrade: “Our knowledge of rapeseed isgood and the future development inbiotechnology is definitely involved withrapeseed – so the perspective or the demandexists. At the same time, one ofour sections that needs developing isdefinitely marketing. We want to bereally well-known among farmers!”November 200875
TOP ESTONIAN ENTERPRISES 2008cessful. They managed to establish themselveswell in the Estonian purchase market. “I couldnot even give you the secret behind our success,but certainly the most important issue is thededi cation and skills of the team. From then onit is about decent sales’ channels, good purchaseprices and a sense of security for the farmer ofgetting his money quickly and definitely – we payto the farmer for his crop within five workingdays after receiving the bill,” Vahar ascertains.Speaking of the team, Vahar uses interesting comparisons.He thinks that a good leader should beable to give the team a direction where to run.During the running they will certainly experiencethirst (a thirst for knowledge that can be alleviatedwith the help of right training), fatigue (aleader must be able to motivate the team by findingthe right motivators) and injury (problemsthat the leader must be able to solve fairly). If youadhere to all of that, the company will run well.Despite the fact that there is more and more talkin Estonia about a worsening economic situation,it has not had a direct influence on OilseedsTrade. At the same time, the sale of rapeseed andgrain depends on the season and that is why arather significant amount of additional financingis required during some periods. According toVahar, banks have become more reluctant to giveloans and you getting a loan is a matter of a lot oftime and effort. “So, the main change in our businessstrategy has happened in the change of agriculturalcredit policy,” Vahar says.You have to admit to making wrongdecisionsThe CEO is not afraid to name some wrong decisions– with hindsight, there was the strategicallywrong decision regarding Russia in springlast year. “We were planning the flow of goodsfrom Russia through Estonia, but because of theBronze Soldier the Russian railway organizationsdid not give cars for the Estonian direction. Becauseof that we could not fulfil our agreementswith Russia and we could not get quite a few millionkroons of profit. In conclusion, the bad relationshipbetween Estonia and Russia hasdirectly slowed down our growth – we could notachieve our planned turnover and profit.” As faras the dealings of the politicians are concerned,Vahar was surprised by the short-sightedness regardingthe relationship between Russia and Estonia,and its consequences to the Estonianeconomy. Mainly because of these consequences,last year was quite difficult for the company;there was even a motivational crisis becauseeveryone had fresh memories of the great setbacksfrom the Russian market. “The solutionwas extremely simple – the owners showed theirfaith in a successful upcoming season in Estonia,and when the season started, the team had faithin the company again,” Vahar speaks of the ordealsand assures that their team has always beenunified. What he considers to be very importantis the common vision of the owners regarding thedevelopment and strategy of the company.2007 – the year of important decisionsThe last year was important for the company, asit was decided to significantly increase the numberof employees. “When in 2007 our companyhad only 5 employees, then today that figure is12, and in addition to those we have 20 employeeson the agricultural side. At the beginning ofthis year the new structure of the team was madeofficial. So far, we had tried to keep the costsmini mal, i.e. have as few employees as possible,which resulted in a situation where one personwould have many different functions. Hiring newemployees was automatically taking a risk – whatwould happen if the company does not do aswell as planned? Recruiting employees also involvessocial responsibility – every person has afamily, loans. Independent of how good or bad acompany is doing, people have to be paid theagreed salary at the right time,” the CEO says responsibly.By now, the increase in the number ofemployees has paid off in every way.Last year it was decided to start agricultural producing,in addition to the existing line of businessof purchasing, and the company is nowinvolved with growing grain and rapeseed,Oilseeds currently cultivates already 2500hectares of arable land. There were several reasonsfor this direction of investments, but themain one for the company was that the businesshas perspective, especially considering the factthat there is still a global food shortage. VeikkoVahar adds cheerily, “Because we know the producevery well ourselves and we can sell it well,this choice seemed logical. As the saying goes –a farmer is eternally rich! “Oilseeds has grand plans for the future – theyshould be developing rapeseed oil pressing andmanufacturing biodiesel. Both of these venturesrequire a lot of capital, however. The CEO saysthat in order to make all that a reality, they haveto gather some strength or find additional resourcesby acquiring reliable partners. “Ourknowledge of rapeseed is good and the future developmentin biotechnology is definitely involvedwith rapeseed – so the perspective or the demandexists. At the same time, one of our sections thatneeds developing is definitely marketing. Wewant to be really well-known among farmers!”The trademark Oilseeds covers two enterprisesthat are based fully on Estoniancapital – AS Oilseeds Trade and OÜOilseeds Agro. AS Oilseeds Trade is arelatively new enterprise that was establishedin the year 2005. The main line ofbusiness for the company is buying andselling of rapeseed and cereal grains. Inaddition to that, the company is activelyinvolved in trading rapeseed cake andcrude rapeseed oil; and the company offersfarmers fertilizers, seeds intendedfor sowing and other goods necessaryfor farming.The company has an especially longtermexperience in the internationaltrade of cereal grains, rapeseed, rapeseedoil and rapeseed cake. Additionally,Oilseeds has operated in internationaltrade with bio-diesel, glycerol and cerealgrains. Among the customers of thecompany are several fodder crop and oilcrop processing facilities in the Baltic Searegion. This year, the company successfullyembarked on the new directions ofselling fertilizers, weed and pest control;and seeds intended for sowing. In additionto that, the purchase assortmentwas expanded by cereal grains. The goalfor the current year is to achieve a shareof 10% of the Estonian market of cerealgrain and rapeseed market, and thecompany’s total turnover should exceed300 million kroons.OILSEEDS TRADE AS 2007Sales (th EEK) 163,114Change in sales 212.1%Net profit (th EEK) 2,051Change in net profit 148.8%Number of employees 12Investments (th EEK) 314Return on equity 58.5%Place in the CompetitivenessRanking 2008 16676November2008
TOP ESTONIAN ENTERPRISES 2008Forestry and Agricultural EnterprisesPLACESALES CHANGE NET PROFIT CHANGE RETURN LABOUR COSTS EFFICIENCY PER INVESTMENTS % OFENTERPRISE IN SALES IN NET PROFIT ON EQUITY PER EMPLOYEE EMPLOYEE THE FIRST* group TH EEK PLACE % PLACE TH EEK PLACE % PLACE % PLACE EEK/month PLACE TH EEK PLACE TH EEK PLACE (0 .. 100)1 OILSEEDS TRADE AS 163,114 3 212.1 1 2,051 9 148.8 5 58.5 1 9,560 11 23,302 1 314 10 100.0%2 HOLMEN METS AS* 419,210 1 124.4 7 895 12 61.1 11 9.7 11 44,123 1 19,962 2 11 87.6%3 EKSEKO AS* 339,045 2 105.0 10 10,995 1 15.8 12 3.6 12 12,702 8 1,813 4 22,593 2 69.3%4 NURMIKO AS* 99,995 4 129.2 6 7,387 5 83.5 9 14.0 8 13,208 7 885 5 43,215 1 69.2%5 TRETIMBER OÜ* 91,676 5 150.4 2 7,895 2 183.6 4 19.6 7 15,848 4 2,778 3 17,248 3 68.6%6 SAGRO AS* 65,872 6 103.9 11 7,423 3 1,795.9 1 30.6 4 10,704 9 451 11 5,638 8 68.2%7 VIRAITO OÜ 13,837 11 108.7 9 5,975 7 543.4 2 54.3 2 14,761 5 814 7 6,747 7 65.4%8 ORGITA PÕLD OÜ 23,022 10 140.6 3 7,416 4 141.0 6 29.5 5 14,557 6 767 8 10,903 5 56.7%9 RAIKKÜLA FARMER OÜ 47,928 7 109.7 8 7,002 6 112.0 7 12.7 9 19,734 2 871 6 14,855 4 47.0%10 KEMEHH OÜ 5,276 12 132.9 4 923 11 185.9 3 33.6 3 8,370 12 330 12 958 9 27.9%11 ÕNNE PIIMAKARJATALU OÜ* 25,917 9 101.9 12 3,736 8 95.5 8 10.8 10 16,727 3 603 9 8,887 6 27.1%12 NURMIKO AIANDID OÜ 30,082 8 129.9 5 1,198 10 66.6 10 26.6 6 9,965 10 579 10 92 12 23.7%1 EUR = 15.6466 EEK; 1 EEK = 0.0639 EUR; based on 2007 data See also www.konkurents.ee
Competitiveness Ranking 2008The Most Competitive Business Service and Real Estate Enterprise 2008MAINOR ASA wide grasp for successMainor is a special enterprise, regardingfor instance how many companies in Estoniahave managed to include education, realestate and timber industry in one group. In additionto that, a metal working company, DvigatelRegital, belongs to Mainor and theenterprise has also started doing business in theline of environmental protection and windfarming... Not many companies have managedto accomplish that. A couple of years ago, significantinvestments were made into four timbercompanies, for instance, and it is now clearthat those small companies produce good-qualityniche products, are competitive and theirturnover is constantly growing. A member ofthe management board of Mainor, Ants Pilving,proudly says that during the past couple ofyears it has become very obvious that all companiesbelonging to the Mainor Group haveconstantly moved upwards as far as theirturnover is concerned – this year, the turnoverin every field grew by at least 25%. “All this hasof course happened because we made the investmentsat a very right time and we now possessa very clear competitive edge. We also owna metal working company, for instance, whichhas developed stable partnerships and whichhas proved itself in a matter of two or threeyears. On the market, two factors are of the utmostimportance: quality and deadlines. We arePHOTO: TOOMAS TUULA member of the management board ofMainor, Ants Pilving says:“We are very positive about the next yearas well. We cannot help but be optimistic,really – big investments havebeen made, the markets are there andgrowth will surely occur.”78November 2008
TOP ESTONIAN ENTERPRISES 2008very positive about the next year as well. Wecannot help but be optimistic, really – big investmentshave been made, the markets arethere and growth will surely occur. In conclusion,we will see the production definitelygrowing by 20%, if not more,” Pilving is certain.Ülemiste City major projectOne of the biggest real estate projects that hasswallowed Mainor as a whole is Ülemiste Cityin Tallinn. Mainor is the core shareholder ofÜlemiste City (ÜC), which is a part of workingout ÜC’s development strategy and the organizationof funding the project. The concept ofÜC, known as the Smart Business Centre, isworked out and implemented by ÜlemisteCity’s strong team led by the chairman of themanagement board of ÜC, Gunnar Kobin.Ülemiste City has developed very aggressivelynamely during the past two years – last year,457 million kroons was invested in ÜlemisteCity. All in all, the company manages a territoryof 33 hectares in that area, together with productionand office buildings, in the vicinity ofÜlemiste Shopping Centre and Tallinn Airport.This year, their activity has been slightly moremodest, the focus is more on design, in order toconstruct two additional ten-storey buildingsto the existing brand new office buildings. Aservice building that would house a wide varietyof services is also being built: there couldbe spaces for kindergartens, gyms and medicalinstitutions, for example. In addition to that, anew, smaller office building will be built. Theconstruction will probably start already at theend of this year or at the beginning of next year– the exact order will depend on the specific financingplan. The development of the area wasquickened by the decision made a few years agoto fully develop and construct roads and moderncommunications before constructing thebuildings – that made it possible for the companyto move forward fast and to make use ofthe relatively good market situation.“Ülemiste City took action at the right time: acouple of years ago, the market was rather goodas far as office buildings were concerned. Theconstruction of the buildings was finished atthe right time. Now I see that a small problemmight occur because the two office buildingsthat were finished have mostly been sold outand there might be a gap when we do not haveanything to offer for the potential customer.The construction of one office building takesapproximately a year and a half. Previously, thespaces had been sold in advance but it is morecomplicated to achieve it now, as the customerhas more choices,” the member of the managementboard of Mainor confirms.Ülemiste City has built the previous officebuildings taking into consideration the interestsof the anchor tenants. Acquiring financingfrom the banks is also easier if the company canshow a list of companies certain to come to abuilding. A few years ago, a major problem wasthe traffic management in Ülemiste, severalcompanies were initially reluctant to relocatetheir offices, fearing that access to them mightbe difficult. Nevertheless, the real situation is alot more positive. The changes in traffic on theintersection of Tartu Road, Suur-Sõjamäe Streetand Järvevana Road; the reconstruction ofSuur-Sõjamäe Street and the building of theSmuuli road bridge have made the situation significantlybetter. In the near future, a crossing isplanned to be constructed from Suur-SõjamäeStreet directly to Järvevana road.Customers have already now said that eventhough traffic management continues to be aproblem, they are quite happy with their accessand the access is not at all worse than in otherareas in Tallinn.Can the company feel the fall of thereal estate market?Pilving admits that they are experiencing difficultiesin finding customers. He thinks that thecurrent situation should not be taken too dramaticallyand extremely pessimistically. “Wealso own the Kuhlbars registered immovableand it indeed has a rather heavy traffic of tenants– different small companies move out ofthe premises and are replaced by others. Theadvantage of Mainor’s own business is that weare specialized in a wide variety of things, notjust real estate. One of the advantages ofÜlemiste City is free parking. They are creatinga Smart Business City here, a centre for innovativeenterprises and people, which offers a varietyof different services with new ones beingconstantly added to the list. Ülemiste City alsohas production and warehouse buildings.Strong crane parks have remained here fromthe past and the existence of hoisting cranesbinds our customers. Metal working companiesare also doing well here in Ülemiste, not onlyare office spaces being built, but also, for instance,the production building of ML Arvutidis brand new here. There is plenty of room fordevelopment here,” Pilving says. He hopes thatmaybe in 10-15 years they will manage to buildsomething on all the available office spaces: altogether,the company has 1 million square metresof building rights and they act upon demand– when someone comes and asks for productionspace, the company is ready to providethem with it.The company has not wanted to build residentialhouses in Ülemiste City because one of thecompany’s principles from the very beginninghas been that everything will remain the propertyof Ülemiste City and they will not sellapartment ownerships. According to Pilving, itwould make the ownership relations very complicatedand the area could not develop freelyanymore. They will certainly create the opportunityfor people to reside in the area, butwhether it will be a case of apartment buildingsfor rent or a hotel instead will be decided in thefuture.The history of ÜlemisteMainor’s connection with the Ülemiste area hasa long history. It all started in the year 1991when Dvigatel was situated on that territory. InAugust, when times were difficult in Estonia,Ants Pilving was working in the Ministry of Industryand Energy. “We were told to go andtake over Dvigatel. In essence, it was a productionplant, it did not have any air of a militaryfactory anymore; cranes, big equipment for drycleaning, the dairy industry etc were producedthere. They were focused on the Russian marketand at that time that market was disappearing,although some producers neverthelesssurvived. They wanted to enter the Westernmarket and establish joint companies with theFinns. Nothing special came out of it, but wegained an experience nevertheless.” Mainor becameactively involved in the year 1995 whenDvigatel was privatized; and a couple of yearsago, Mainor acquired the shares of severalsmaller shareholders and thus, the majoritystake. Because of the clearer ownership structure,the company is experiencing easier negotiationswith banks and easier funding. Theactive construction work started in theÜlemiste area only when Mainor acquired themajority of the shares.Ants Pilving emphasizes that even though thereis still room for development in Ülemiste, itcannot be achieved by destroying everythingthat is old. It is certainly easier and cheaper tooperate on an empty piece of land, but it wouldnot be beneficial for the bigger picture. “We aretrying to create a new look, a new value and environmentin Ülemiste City, but not by erectingnothing but glass walls. We are trying to preservethe existing environment and buildingsas much as possible,” Pilving says.November 200879
TOP ESTONIAN ENTERPRISES 2008Indeed, as soon as you enter Ülemiste City, youcan feel its history. The old limestone walls havebeen preserved; and the buildings have beendeveloped in unison with those sections, seeminglybeing both modern and historical.One should be able to find new lines ofbusinessMainor has always tried to be a small stepahead of others in its activity. So, the idea wasborn to become involved in wind energy andMainor is trying to advance very quickly in thatfield. The company is currently working on aproject of small windmills; they have plannedto build them in a way that even the smallerfarmsteads could produce their own energy. Asone of the shareholders, Mainor is also participatingin the development of wind farms inHiiumaa and in the rest of Estonia. The companyhas a subsidiary company, DvigatelEnergeetika – the former energy producer,which supplied electricity, gas and water toÜlemiste area. It is now being expanded so thatan electricity and heating co-production plantcould be built for the office buildings; and aninvolvement in wind energy projects would bepossible.Only recently, the company decided to enterthe field of environmental protection. In orderto achieve that, a joint company was foundedwith the Finns who provide them with theknow-how of studies on environmental protection.The company has already received the firstcouple of orders and Pilving is of the opinionthat the new endeavour has a lot of potential. Inthe Estonian market, the company is mostly involvedwith storm water treatment systems.Mainor is also sharply focused on listing thecompany on a stock exchange. The companyhad planned that already last year, but becausethe markets fell, the endeavour was decided tobe put on hold. The preparations have beenthorough and the decision is currently waitingfor better times. Whether only Ülemiste City orthe entire Mainor Group will be listed on thestock market is yet to be decided upon. Neitheroption has been excluded.The enterprise is certain to continue to surpriseothers with new lines of business; and it is impossibleto notice a lack of ideas on their part.A member of the management board, AntsPilving, is certain that the most important partin the company’s business is to have a very widebusiness grasp and to search for new ideas andthoughts – then, success will come.MAINOR AS 2007Sales (th EEK) 263,795Change in sales 109.3%Net profit (th EEK) 437,134Change in net profit 143.4%Number of employees 368Investments (th EEK) 482,176Return on equity 52.6%Place in the CompetitivenessRanking 2008 44Business Service and Real Estate EnterprisesPLACESALES CHANGE NET PROFIT CHANGE RETURN LABOUR COSTS EFFICIENCY PER INVESTMENTS % OFENTERPRISE IN SALES IN NET PROFIT ON EQUITY PER EMPLOYEE EMPLOYEE THE FIRST* group TH EEK PLACE % PLACE TH EEK PLACE % PLACE % PLACE EEK/month PLACE TH EEK PLACE TH EEK PLACE (0 .. 100)1 MAINOR AS* 263,795 2 109.3 10 437,134 1 143.4 4 52.6 5 14,691 5 717 8 482,176 1 100.0%2 KAAMOS KINNISVARA OÜ* 142,625 4 174.8 1 148,913 3 73.5 8 37.7 6 32,337 1 7,131 2 90,528 3 99.9%3 ARCO VARA AS* 727,188 1 150.4 2 235,511 2 108.4 6 17.6 10 22,778 3 1,212 6 47,204 4 98.5%4 BDA CONSULTING OÜ 14,376 9 120.6 6 2,842 9 628.3 1 165.8 1 16,513 4 1,106 7 60 11 81.8%5 ARTIG KV OÜ 178,727 3 110.8 9 48,706 4 44.8 9 24.6 8 14,189 7 44,682 1 241,276 2 72.9%6 RIMESS OÜ 46,100 6 147.3 3 8,000 7 235.3 3 95.2 3 23,159 2 536 10 7,100 6 70.2%7 A.KANGUST & PARTNERID OÜ 3,565 10 147.0 4 1,222 10 362.3 2 116.1 2 14,621 6 594 9 280 9 66.6%8 CV KESKUS AS 18,692 8 125.5 5 6,998 8 125.6 5 64.3 4 8,833 11 1,246 5 1,592 8 27.8%9 MASS AS 40,834 7 105.9 11 8,729 6 89.0 7 32.3 7 10,360 8 5,833 3 2,686 7 17.0%10 RIIGIRESSURSSIDE KESKUS OÜ* 61,977 5 112.0 7 40,238 5 38.9 10 5.9 11 9,071 10 3,099 4 18,383 5 12.4%11 SAKU TEHNO AS 3,477 11 111.2 8 154 11 26.8 11 20.8 9 9,413 9 290 11 230 10 6.2%80November20081 EUR = 15.6466 EEK; 1 EEK = 0.0639 EUR; based on 2007 data See also www.konkurents.ee
Competitiveness Ranking 2008The Most Competitive Financial Brokerage Enterprise 2008GILD PROFESSIONAL SERVICES ASGoal: to increase the wealth of its customersThe last year was very successful in thehistory of GILD. The net profit of thecompany was almost 81 million kroons, i.e.three times as much as the year before. “Weopened offices in Sofia and London and increasedthe ratio of fund investments in the regionof Central and Eastern Europe. We startedwith a new line of business – private banking,consulted almost twice as many merger and acquisitiontransactions compared to 2006, andincreased the volume of assets in the GILDfunds by almost 30%. We are extremely satisfiedwith these accomplishments, butconsider ing the abilities of our team, our goalsand the favourable market situation in investmentbanking, we would not have settled foranything less,” says Rain Tamm, the ManagingPartner of the enterprise.Tamm compares the work of an investmentbanker with that of a gardener who sees thefruits of the garden he has cared for only aftera certain time. It is the same for some of theGILD projects and investments – their resultscan be seen only after several years. “Today weare getting ready to raise new funds and expandingour team, and we hope to reap thebenefits of those actions not sooner than in fiveAccording to Rain Tamm, the ManagingPartner of the Gild Professional Services,the main question is how to be competitiveand effective at the same time.PHOTO: TOOMAS TUUL82November 2008
TOP ESTONIAN ENTERPRISES 2008years. It is certain that we will not slow down,because the changing economic environmentoffers good new possibilities.”Fortunately, the company was able to foreseethe economic decline in the domestic marketsa long time in advance, because for instance therapid development in the real estate sectorcould not last for long. So it was decided notto restrict their geographic span of businessonly with the Baltic countries, but carry outtransactions and manage investments in all thecountries in Europe and close to Europe thathave big development potential and whereGILD had good local co-operation partners.“The strategy we have chosen works and thegood economic results of the first half of 2008prove it. In investment banking and foremostin our business directions the volatility of thegrowth rate of the economy means a lot of attractiveopportunities – for instance there mightoccur beneficial opportunities for companieswho have enough capital for growth; and theneed to include alternative investments has alsogrown significantly,“ Tamm says. Financial intermediationis always influenced by the economicclimate and the low tide of the Estonianeconomy is unfortunately happening at thesame time as the global financial crisis. InGILD, everyone is certain that small economieshave the ability to adjust and change theircourse faster.A wide grasp: Emerging Europe andthe unique GILDGILD has strategically defined its areas of businessto be all those European countries wherethe potential for economic development is stillvery promising and diverse. In English there isa good short term for it – Emerging Europe. Agood example for this is GILD Arbitrage, thefirst multi-strategy hedge fund regulated in Estoniaand the Baltic countries. By now, almost60% of the investments of the fund are outsideof the Baltic states for the enterprise: in Armenia,Bulgaria, the Ukraine, and elsewhere. Themain emphasis of the new investments is ongrowing markets of Central and Eastern Europeand markets of their nether regions, but theyare searching for productive enterprises also inEstonia and other Baltic states, where theycould invest money that comes from the increasein the amount of foreign investors.Competition in managing alternative funds, investmentbanking and private banking is verydifferent. “We might say that GILD as a wholeis unique in the Baltic countries because of itsstructure that is based on partnership, its areaof business and operating in a niche section ofinvestment banking. All of these three lines ofbusiness have different direct and indirect competitorsin the different countries we operate in.In general, we are focused on a very specificcustomer group, to whom we offer solutionsthat are flexible and innovative in the financialworld. For instance, our flagship of alternativefunds, GILD Arbitrage is to this day the onlymulti-strategic hedge-fund in the Baltic countriesthat is currently operating with direct investmentsin the entire Central and EasternEuropean region. As a second example I cangive the fact that in the unit of investmentbanking, most of the co-operation projects arethe result of direct negotiations with the customers,which means that we have very rarelyhad to compete over the customer’s mandatewith other service providers,” Tamm says. Eventhe newest line of business – private bankingdoes not have an alternative service provider,because we cover those people for whom thepackage of our services is the best choice.”New challenges for experienced professionalsEven though by now, the key team of GILD hasbeen a strong part of the financial sector fornearly ten years, the year 2007 was the first fullyear under the new brand name, which had tobe introduced to the existing and new customerbase. Another challenge was to enhance thepartnership system and its principles, and actuallytaking it to another level. In a relativelyshort period of time, the company has managedto overcome these challenges. The whole teamworked last year also to grow out of the BalticStates. An important sign about it is breakingthrough to the circle of international investors,which became possible after a change in thefund structures. The first investment bankingtransactions were finalized in the Ukraine andthe company managed to implement and startother investment banking projects in new markets.In October last year, the company publishedthe GILD TOP 100, where for the first time 100most valuable companies were listed. “It causedsome extra work for the company and demandedenergy, not to mention all the doubtsabout whether undertaking such a big project isworth it. The list we compiled and the positivefeedback we received diminished all our doubtsand I can say that we managed that great challengevery well,” Tamm is certain.The key issues of Estonian economyThe director of the company has his certainopinion about the current economic policy. Accordingto Tamm, the main question i show tobe competitive and effective at the same time.He thinks that innovation should quickly bevalued at a wider scope – in addition to changesin IT and gene engineering developments, forinstance business innovation should be appreciatedand encouraged more.”In order to attract more foreign capital andforemost the big international enterprises, thefirst step is to provide a wider judicial and taxenvironment that favours business and the creationof a strong governmental surveillance system.The developing of first-class financialservices benefits both the capital city and Estoniaas a whole – it would mean a larger numberof highly paid jobs, more opportunities for topspecialists with international experience andbackground, an increase in the ratio of advancedbusiness services with a lot ofknow ledge both in the local market and in export,etc.“Tamm thinks that taxation in Estonia shouldbecome attractive for holding-structures. AlthoughEstonia is known as a country with aliberal tax system, we cannot offer favourableconditions to large international groups and enterprisesregarding the taxation of dividends,for instance. He thinks that the state can alsogreatly assist through signing agreements withas many other countries as possible that wouldavoid double taxation.Visions and trumpsGILD is an ambitious enterprise and its directorRain Tamm is convinced that their goal is to bethe leading investment bank in the carefullychosen niches of their main markets, but foremostin the Baltic countries. Tamm is assuredthat they would like to help the companies oftheir target markets to grow, expand and createa new value. “We wish to offer our reputable investorsof an international calibre the most effectiverisk capital productivity in Central andEastern European areas and to guarantee a profitablepersonal assets management for well-offentrepreneurs based on the whole assets principle.Our continual long-term goal is to increasethe wealth of our customers.”The manager operating in investment bankingcannot stand by idly when his employees areworking, he must know about everything thatis going on. The financial sector is changingrapidly and the investment banking within it ischanging even more rapidly. Rain Tamm hasbeen active in the financial sector for a verylong time and compares a successful entrepre-November 200883
TOP ESTONIAN ENTERPRISES 2008neur with a top athlete who can be characterizedby strong internal motivation and spirit ofcompetition. “In regard to that, the most motivatingpart is not always winning the goldmedal after competing with other rivals, but instead,achieving the personal goals and overcomingchallenges. Knowing that you solved acomplicated situation or came quite close to itinspires you to do great new deeds.”Tamm forecasts several interesting developmentperspectives. For instance, he thinks that theimportance of alternative asset managementwill grow and the entrepreneur customers willhave a bigger interest in fund investments andprivate banking. There are more and morehard-working people who are not satisfied withthe humble interest they get on their bankaccount.GILD considers its trumps for achieving all thisto be the very same clear focus, structure basedon partnership and a long co-operation experience– the partners and a big part of the teamhave managed funds together and carried outtransactions for almost ten years. “One of ourgood sides is the right size – we are not quite aninvestment banking boutique where the bestaccomplishments have all occurred thanks to afew shining personalities. At the same time weare not a big financial institution where flexibilityand individuality would inevitably diminish.GILD is a unique combination ofindividual and collective management,” thehead of the company says in conclusion.GILD PROFFESSIONALSERVICES AS 2007Sales (th EEK) 133,960Change in sales 224.5%Net profit (th EEK) 80,532Change in net profit 319.9%Number of employees 58Investments (th EEK) 1,373Return on equity 103.3%Place in the CompetitivenessRanking 2008 23Financial Brokerage EnterprisesPLACESALES CHANGE NET PROFIT CHANGE RETURN LABOUR COSTS EFFICIENCY PER INVESTMENTS % OFENTERPRISE IN SALES IN NET PROFIT ON EQUITY PER EMPLOYEE EMPLOYEE THE FIRST* group TH EEK PLACE % PLACE TH EEK PLACE % PLACE % PLACE EEK/month PLACE TH EEK PLACE TH EEK PLACE (0 .. 100)1 GILD PROFESSIONAL SERVICES AS* 133,960 6 224.5 1 80,532 5 319.9 1 103.3 1 43,826 3 2,310 3 1,373 7 100.0%2 BALTI INVESTEERINGUTE GRUPI PANK AS* 629,000 3 204.9 2 177,000 2 101.7 7 45.2 6 15,851 10 1,709 5 15,000 2 80.5%3 3 STEP IT OÜ 213,186 5 155.9 5 4,817 8 217.1 4 48.8 5 51,701 1 8,883 1 10 80.3%4 IF EESTI KINDLUSTUS AS* 1,239,076 1 109.6 11 213,118 1 99.1 8 21.3 8 27,029 4 3,030 2 12,833 3 79.3%5 TAVID AS* 107,827 7 200.1 3 64,338 6 236.1 3 61.3 3 24,125 6 1,269 8 3,001 6 64.1%6 ERGO KINDLUSTUSE AS* 932,020 2 113.6 10 106,324 3 87.7 9 17.2 9 17,743 9 1,610 7 19,527 1 59.9%7 EESTI KREDIIDIPANK AS 322,978 4 126.1 9 82,692 4 109.3 6 30.0 7 26,706 5 1,736 4 7,608 4 46.1%8 MARFIN PANK EESTI AS 50,840 8 155.7 6 2,242 9 64.3 11 1.1 11 46,215 2 1,640 6 3,268 5 35.2%9 EUREX CAPITAL OÜ* 29,224 9 157.4 4 12,005 7 149.0 5 65.2 2 15,627 11 769 9 1,238 8 34.1%10 PÕLVAMAA HOIU-LAENUÜHISTU TUÜ 2,201 11 142.5 7 243 11 239.2 2 11.0 10 18,399 8 440 11 52 11 25.1%11 KINDLUSTUSEST KINDLUSTUSMAAKLER OÜ 14,120 10 130.0 8 1,776 10 74.5 10 51.8 4 19,777 7 471 10 622 9 19.3%84November20081 EUR = 15.6466 EEK; 1 EEK = 0.0639 EUR; based on 2007 data See also www.konkurents.ee
Competitiveness Ranking 2008The Most Competitive Service Enterprise 2008OLYMPIC CASINO EESTI ASThe leader and pioneer of its fieldThe Managing Director of Olympic EntertainmentGroup (OEG), Andri Avila, admitsthat it is highly probable that these aretougher times for the casino industry than everbefore. The most important thing this year is toendure the fall of the market. They will certainlycontinue investing a rather great deal inthe development of the enterprise and continuetheir international expansion. On the grouplevel, OEG has promised to be a casino operatorin at least ten different countries by the year2010.How was the performance of the OlympicCasino Group influenced by the decelerationof the economic growth last year?The performance of 2007 was not influencedmuch by the economic decline. But because thesigns of warning were very clear, we startedpreparing for the possible decline in 2008.I would mainly point out the additional analysisof costs and finding new ways to cut downon expenses. Additionally, we evaluated our investmentplans even more conservatively thanbefore.How did you reach the solutions – did you useAndri Avila, the Managing Director ofOlympic Entertainment Group: "Thecompetition is tough and it is highlylikely that the economic decline and amore up-to-date legislation will be accompaniedby changes in the gamblingmarket."PHOTO: TOOMAS TUULNovember 200885
TOP ESTONIAN ENTERPRISES 2008your gut instinct or did you co-operate withyour colleagues?Running an organisation is teamwork and nodecision in the OEG is made in a quiet office, soto speak.How would you assess competition in yourfield of business, have there been any majorchanges?The competition is tough and it is highly likelythat the economic decline and a more up-todatelegislation will be accompanied by changesin the gambling market.How important is the team in your enterprise,how has the chain of decision been organized?Our group is based on the principle of matrixmanagement. According to the current structureof OEG, the Board and the Chairman ofthe Board, Armin Karu, are responsible forstrategic international developments. TheManaging Director together with the ChiefOfficers of different fields of work are responsiblefor the day-to-day management of thegroup and also implement the developmentplans. In every country we have expanded to,there is a different team who is responsible forthe management of the enterprise in thatparticular market.What was the largest investment last yearand why did you decide to do it?In Estonia, the biggest investment was acquiringKristiine Kasiino in spring 2007, and theinvestments that resulted from the integrationof the two organizations and utilizing the newbrand. Of the casino operators in the Estonianmarket, Kristiine Kasiino was certainly thecloses to Olympic Casino regarding its businessphilosophy, so when the opportunity arose andthe price was right, it was a very logical decisionin every way. The sum total of OEG investmentswas approximately 1.5 billionkroons, of which less than a fifth was investedinto the Estonian market and the main emphasishas been on international expansion for severalyears already.What was the biggest ordeal, obstacle, challengelast year? How did you overcome it?Definitely the acquisition of Kristiine Kasiino.A successful and painless integration of twowell-developed organizations is always a greatchallenge. It is a challenge for the people, thetechnology and the customers. By now, theprocess has ended and I think it has beenhighly successful. On a group level, the differenttasks we had to do have been similar, becauseduring the past year four casino operatorswere acquired in different countries and allof them had to be successfully integrated intoOEG.What are the plans for this year? Where willyou develop next?The most important keyword in Estonia thisyear is to endure the fall of the market. We willdefinitely invest into some new casinos or themodernization of existing ones. Offering casinoentertainment is a field of business that requiresa lot of investments, for instance a modern slotmachine costs as much as a family car. In oursector, technology has developed rapidly alreadyfor the last ten years and Olympic Casinohas always kept pace. Several new games andother modern solutions have been used namelyin Estonia as the first ones in Europe.What is the general vision of the enterprise,what would you like to achieve?In Estonia, we want to be the strong leaders andpioneers of our field of business. For years, wehave been the no 1 provider of casino entertainmentand we are not going to settle for anythingless in the future either. On a group level,we have promised to be operating in at least tendifferent countries by the year 2010. The newvision of Olympic Entertainment Group has asignificantly wider outlook for the future, i.e.we will not restrict ourselves geographicallywith Central and Eastern Europe, but we willlook for new markets all over the world.What surprised you the most last year?The biggest surprise was the influence of theeconomic decline to the gambling sector, becauseas a rule, that sector has endured economicdecline in various places of the worldrelatively well. It is probably a confirmation ofthe fact that the problems in the economy arewider, and I do not mean only in Estonia, butfrom a global point of view. At the same time,we have managed to understand the signs ofwarning early enough and accordingly makeour plans for the current year.How would you assess the economic policyin Estonia? What could be different, in thetax policy or general control?The Estonian economic policy is generally quitegood, in my opinion. Some decisions may havebeen made hurriedly or some steps have beentaken in accordance with a short-term politicalprofit, but I believe that it happens everywhere.Broadly speaking, Estonia has managed well. Atthe same time, a country with an open economicenvironment, like Estonia, is much morevulnerable to any influences from an externalenvironment.With hindsight, what has/have been themost difficult year(s) for the enterprise?Probably the current year, 2008, is complicatedfor the entire Estonian gambling market. Hopefully,the preparations that Olympic Casino hasmade for the current period of decline are sufficientto continue successfully. In other countriesas well – in those where there has been nodirect regress – the slowing down of the growthis clearly visible.What is the most difficult aspect in the fieldof business of Olympic Casino?We already mentioned the big scale of investments.That is one thing. The biggest challengeis definitely offering people truly memorablepositive experiences. Additionally, in Estoniathere is the work regarding the reputation ofthe field – when in the US, more than 80% ofthe people consider casino entertainment to bea perfectly normal way of spending time, thenin Estonia those figures are up to ten timessmaller for now. The casino field is verystrongly controlled by different legislative acts,which makes it much more complicated comparedto most of the other fields of business.Last but not least, we must put emphasis onresponsibility – as with many other fields ofbusiness, our field has a negative side as well:compulsive gambling. Even though based ondifferent studies, the danger of becoming addictedexists only for 1-2% of the adult population(several times smaller than compared toalcohol, for instance), we take the issue very seriously.In all the countries we are operating in,we have developed a programme that warnsour customers of possible dangers, providesthem with assistance to those with problemsand we are also training our staff on a regularbasis, those employees that deal with customerson a daily basis.How big are the changes that you predict tooccur in your field of business?I believe that the market will go through somesort of a consolidation in the coming years.There are many operators and gambling placesand the economic decline should make theprocess faster. At the same time, Estonia doesn’thave a big and respectable, state of the art, representativecasino, like Olympic Casino Voodooin Riga or RAY Casino in Helsinki. So, there is86November2008
TOP ESTONIAN ENTERPRISES 2008room for investments and developments.In general, what is the idea and goal behindyour actions?I will quote the mission of Olympic Casino verbatim,“To offer a good-quality and entertainingcasino experience and modern gambling foractive customers that value a good service, in afriendly and safe environment, dominatingwith our good reputation and fame everywherewe operate now and in the future.“What should a good director of an enterprisebe like? How much attention do you pay ontraining both yourself and the team?The director of an enterprise must give a directionto and motivate the team. Both the developmentof the team and the personaldevelopment of its members is one of the keyissues regarding that. In Olympic Casino, allemployees take part in trainings aimed at raisingjob-related professionalism and personaldevelopment. The Olympic Academy providesgood possibilities for development and careeropportunities within the enterprise. The ratioof training investments within work force costsis probably one of the highest in the entire region.What gives you strength to work? How doyou keep yourself motivated?OEG is in my opinion the most internationalEstonian company and it is probably an importantmotivator for a lot of our people. To beworking in an Estonian enterprise that is alreadysuccessfully operating in eight differentcountries is emotionally a strong argument.When you add a good team, modern workingconditions and a decent income to that, themain motivators have been enumerated,I think.OLYMPIC CASINOEESTI AS 2007Sales (th EEK) 794,786Change in sales 123.7%Net profit (th EEK) 309,160Change in net profit 100%Number of employees 585Investments (th EEK) 372,292Return on equity 34.5%Place in the CompetitivenessRanking 2008 61
Service EnterprisesPLACESALES CHANGE NET PROFIT CHANGE RETURN LABOUR COSTS EFFICIENCY PER INVESTMENTS % OFENTERPRISE IN SALES IN NET PROFIT ON EQUITY PER EMPLOYEE EMPLOYEE THE FIRST* group TH EEK PLACE % PLACE TH EEK PLACE % PLACE % PLACE EEK/month PLACE TH EEK PLACE TH EEK PLACE (0 .. 100)1 OLYMPIC CASINO EESTI AS 794,786 3 123.7 25 309,160 1 100.0 32 34.5 30 20,629 21 1,359 19 372,292 2 100.0%2 TALLINNA VESI AS 820,772 2 118.4 35 277,840 2 112.0 26 23.3 40 20,144 24 2,581 7 285,953 3 93.0%3 AF-ESTIVO AS 66,485 14 666.5 2 2,981 25 545.4 3 87.8 2 25,544 15 3,499 3 49 46 81.7%4 EESTI LOTO AS 410,155 4 144.5 14 77,666 6 189.7 9 72.0 8 21,078 19 8,371 1 1,242 24 79.6%5 RAMIRENT AS 308,200 6 130.4 20 106,758 3 128.0 21 40.6 23 28,136 12 2,186 11 191,005 4 69.0%6 RONDAM GRUPP AS* 375,906 5 127.5 23 43,131 8 151.0 16 39.0 24 17,346 32 1,663 16 392,000 1 68.7%7 PERI AS 135,046 12 158.2 10 46,314 7 134.8 19 41.2 22 40,216 1 4,092 2 48,131 6 67.0%8 K GRUPP TURVATEENUSED OÜ 33,779 24 154.4 11 4,525 18 1,070.3 1 128.1 1 8,290 46 184 49 12,042 8 62.7%9 NORMA AS* 1,263,942 1 120.7 32 105,928 4 123.6 22 11.9 47 17,240 33 1,300 20 42,487 7 60.8%10 LRF PRIVATE OÜ 12,451 38 1,491.3 1 1,119 39 43.8 20 18,300 28 3,113 4 269 37 58.5%11 UPM-KYMMENE OTEPÄÄ AS 306,577 7 139.8 17 89,937 5 193.0 7 49.8 16 19,354 27 2,071 13 62,657 5 54.7%12 AIR MAINTENANCE ESTONIA AS 166,701 9 120.1 33 9,685 11 85.5 3 32,916 3 1,378 18 5,539 11 51.4%13 CV-ONLINE ESTONIA OÜ 22,943 30 93.5 47 29,805 9 272.7 5 75.1 5 28,917 8 740 37 266 38 48.2%14 FORANKRA BALTIC OÜ 35,617 23 108.8 40 6,399 14 171.8 13 41.7 21 33,597 2 2,740 6 513 30 47.3%15 KAARLI HAMBAPOLIKLIINIK OÜ 64,373 15 133.0 19 1,399 36 205.7 6 64.5 13 32,075 4 619 42 48 45.6%16 CENTRALPHARMA COMMUNICATIONS OÜ 20,598 31 129.6 21 1,265 38 373.8 4 50.2 15 28,583 11 981 25 3,046 16 44.8%17 PARKLI HL OÜ* 13,835 36 101.3 43 2,162 29 4,239.2 2 21.8 41 13,540 42 922 28 4,037 12 43.2%18 GSMVALVE OÜ 13,362 37 419.6 3 1,051 41 159.7 15 79.8 4 15,234 37 1,028 24 1,250 23 42.9%19 HANSAB AS* 130,296 13 127.7 22 9,471 12 103.7 29 21.1 42 28,955 7 2,391 8 454 33 38.7%20 KPMG BALTICS AS* 148,906 10 121.2 29 5,096 16 61.7 39 44.1 19 30,151 5 756 36 1,063 26 37.7%21 SUNOREK AS* 178,887 8 123.9 24 11,063 10 93.0 34 68.1 10 20,178 23 840 31 3,627 14 37.5%22 PLANSERK AS 26,715 27 172.1 9 2,267 27 116.4 25 28.9 36 27,855 13 1,571 17 9,678 9 36.1%23 KOMPRESSORIKESKUS OÜ 46,819 19 101.0 44 2,781 26 66.8 38 30.5 34 28,775 9 2,229 10 348 35 35.7%24 DATA PRINT OÜ 18,561 33 179.4 8 1,565 35 74.8 6 19,833 25 1,237 21 943 29 35.2%25 PORTEX AS 7,489 45 92.7 48 999 42 190.2 8 66.8 12 20,886 20 832 32 51 45 34.6%88November20081 EUR = 15.6466 EEK; 1 EEK = 0.0639 EUR; based on 2007 data See also www.konkurents.ee
Service EnterprisesPLACESALES CHANGE NET PROFIT CHANGE RETURN LABOUR COSTS EFFICIENCY PER INVESTMENTS % OFENTERPRISE IN SALES IN NET PROFIT ON EQUITY PER EMPLOYEE EMPLOYEE THE FIRST* group TH EEK PLACE % PLACE TH EEK PLACE % PLACE % PLACE EEK/month PLACE TH EEK PLACE TH EEK PLACE (0 .. 100)26 FIXTEC AS 7,801 44 192.3 7 179 48 20.5 43 30,007 6 1,950 15 47 34.0%27 REGIO AS 52,474 17 97.1 46 3,537 23 178.9 11 27.1 38 28,669 10 772 35 1,975 20 33.2%28 PROFLINE AS* 25,260 28 113.7 38 2,122 31 99.8 33 35.4 29 23,736 17 2,105 12 54 44 32.9%29 VÄRVALTRANS OÜ* 32,285 25 142.9 15 5,515 15 168.6 14 56.0 14 15,638 36 922 27 2,490 17 30.3%30 REALISTER OÜ 6,987 46 333.6 4 609 44 144.9 17 67.9 11 7,283 47 873 30 464 32 29.9%31 SÖDERHAMN ERIKSSON EESTI AS* 19,233 32 98.4 45 603 45 26.3 44 5.5 48 27,323 14 2,748 5 309 36 28.7%32 CHEMI-PHARM AS* 30,873 26 116.0 37 4,259 19 182.9 10 34.0 31 20,182 22 965 26 355 34 28.6%33 ECOPRO AS* 41,215 21 121.8 28 6,633 13 139.8 18 37.6 26 18,258 29 1,178 22 1,143 25 28.0%34 KOOPIA KOLM AS* 17,358 35 113.4 39 3,222 24 103.1 31 72.5 7 13,667 41 579 43 2,189 19 27.8%35 JAJAA OÜ 10,195 42 120.9 31 2,157 30 110.2 27 37.2 28 19,588 26 1,133 23 174 40 26.8%36 PAJO AS 24,008 29 196.2 6 1,740 34 44.5 17 17,582 31 800 33 204 39 25.7%37 TAASTAVA KIRURGIA KLIINIK AS 45,257 20 119.8 34 4,726 17 103.5 30 30.2 35 21,213 18 566 45 3,198 15 25.6%38 AURE OÜ 10,382 41 123.1 26 1,319 37 73.2 37 27.8 37 16,605 34 2,307 9 91 41 25.2%39 TRIO LSL AS* 47,842 18 122.9 27 3,842 21 129.9 20 38.3 25 17,889 30 514 46 1,022 28 25.2%40 AIK-PROJEKT OÜ 4,642 48 149.0 12 188 47 40.0 42 20.0 44 24,205 16 774 34 67 42 24.0%41 BLAUINVEST OÜ 18,281 34 200.8 5 1,992 32 121.4 23 71.4 9 5,967 49 381 47 3,966 13 23.7%42 SCHÖTTLI KESKKONNATEHNIKA AS 37,080 22 78.6 49 3,746 22 86.4 36 37.5 27 10,788 45 2,060 14 2,323 18 21.7%43 SELF II OÜ 10,599 40 116.3 36 2,231 28 91.2 35 32.8 33 14,597 39 883 29 1,596 22 20.3%44 QUATTROMED AS* 55,000 16 145.5 13 1,896 33 57.2 40 24.9 39 16,037 35 679 38 5,916 10 20.2%45 MERINVEST OÜ 135,983 11 121.0 30 3,884 20 50.9 41 18.8 45 14,663 38 632 41 1,860 21 18.3%46 K & M PROJEKTBÜROO OÜ 5,327 47 134.9 18 1,061 40 175.8 12 44.1 18 6,203 48 666 39 496 31 17.8%47 AUDIITORBÜROO ÕNNE KURVET OÜ 1,186 49 142.0 16 196 46 108.2 28 33.8 32 11,786 44 297 48 49 16.9%48 MR STUUDIO OÜ 11,439 39 104.5 42 617 43 119.0 24 18.5 46 14,585 40 572 44 1,058 27 16.3%49 PR FIRMAREKLAAM OÜ 9,248 43 107.4 41 16 49 31.0 43 0.4 49 12,516 43 661 40 60 43 8.2%1 EUR = 15.6466 EEK; 1 EEK = 0.0639 EUR; based on 2007 data See also www.konkurents.eeNovember 200889
Competitiveness Ranking 2008The Most Competitive Transportation and Logistics Enterprise 2008TALLINNA SADAM ASThe Port of Tallinnin the winds of changeELast year was not an easy year at all forthe Port of Tallinn. The overall decline inthe economic growth had its impact, but in particular,the steep decrease in the transit fromEast made the company act in a different way.Also, the amount of passengers that used theport last year decreased a little, probably due toa decline in the tourism sector.“Despite the fact that we had already consideredthe possibility of the decline in the amountof transit goods from East to West, the steep fallin the amount of shipments last year was definitelya sizeable challenge for the company.What it meant was that the plans that weremade for a longer period of time had to be realizedsignificantly quicker. In the developmentof a port things do not happen overnight and itis obvious that re-orientating our business anddeveloping the necessary infrastructure takestime, and we definitely have to consider a certainlowpoint in our business,“ says Ain Kaljurand, the head of the port. Fortunately, thewinds are changing not only at sea but in theport, and because the activity and profit of theenterprise do not depend only on transit, butan important source of income is the servicingof passengers, then the port has reason to feel alittle relief this year – the number of passengerskeeps rising rapidly.PHOTO: TOOMAS TUULAin Kaljurand, the head of the port :“Despite the fact that we had alreadyconsidered the possibility of the declinein the amount of transit goods from Eastto West, the steep fall in the amount ofshipments last year was definitely a sizeablechallenge for the company.”November 200891
TOP ESTONIAN ENTERPRISES 2008Poor economic situation is forcing toimplement plansWhile quite a few companies are rearrangingtheir plans to be smaller and not expecting anygreat successes, things are different in the port.They have even forced some of their plans inorder to re-orientate as quickly as possible inthe new market situation and thus create acompetitive edge for themselves in the region.“It is mainly in regard to the increasing containerflows and servicing new passenger carsfrom West to East. The demand for the servicingof both goods groups is growing rapidlyand the existing possibilities in the ports on theeastern coast of the Baltic Sea will soon be exhausted.By reacting quickly we have a chanceto get our foot through the door, so to speak.Fortunately, the Port of Tallinn still has roomfor development, which cannot be said of manyof our competitors. On top of all that there areour natural and geographical advantages, so weare quite hopeful about the future,” Kaljurandis optimistic.The Port of Tallinn – The Port ofNingboCo-operation between the Port of Tallinn andChina is not a piece of news anymore. The portconsiders one of the biggest successes of lastyear to be the rapid development in co-operationwith China and most of all with the Port ofNingbo, which culminated in signing a co-operationcontract in January this year. The headof the port says that it is something they hadworked hard on for many years, and despite thesigned agreement being an intermediate stagebefore finally achieving actual co-operation, it isstill a major progress in their relationship. Anachievement as important as that is that all inall, the port nevertheless managed to endurelast year relatively successfully and it did nothave to carry out any radical changes in itsplans. Co-operation with the Chinese is developingaccording to the plan. “Currently thereare two specialists from Ningbo who are becomingacquainted with the situation, and soonthe heads of the Port of Ningbo will arrive, andwe will hopefully mark the next stages in ourfuture co-operation together.”Kaljurand says that it has happened onlythanks to a team effort and a consistent and determinedactivity. “Team work is the basis of allour business. Real specialists of their fieldswork for us, and they have enough motivationand dedication to make an effort for a commongoal. According to our structure we have twomembers of the board, each of whom is supervisingtwo divisions, which in turn are dividedinto departments. Guidelines for activitiesmove according to the respective chain of command.While a decision is being prepared,everyone involved has an opportunity to givetheir input and it usually happens as well. Onthe levels of mid-level executives and the board,our team today is well put together. There areplaces where it would be necessary to cut backon work force, but hopefully it will be on aminimal level.”Investments and new plansLast year, the reconstruction of the Old CityHarbour quays demanded the most investments.A lot of money was spent on new passengergalleries and ramps, to be ready on theirpart for servicing new ships that will start operatingthis year. Currently, some of the biggerprojects include the expansion of the MuugaContainer Terminal area and constructing newquays and territories of the Paldiski South Harbour.Kaljurand hopes that during this year, anotherstep closer will be taken to signing the final cooperationagreement with the Chinese. “Due tothe fact that the there has been a decline in theamount of shipments, we have extra free resourcesthat could be used. We are activelyworking in that direction. This year hasbrought a totally new quality as far as passengertraffic is concerned, when in a very short time,three brand new ships have started operating,and two of those ships are big and fast and cansail to and from Helsinki all year round. Inorder to service those ships the port had to doa lot of work by constructing the necessarybuildings. But looking at the large growth in thenumber of passengers, we can say already nowthat the right steps have been taken,” the headof the port is certain.A new beginning for the port of TallinnLooking back, Kaljurand considers the firstcouple of years to have been the toughest forthe enterprise, the time when the old systemfell apart and a new one had not been built yet.“The Port of Tallinn has not become the largestport on the Baltic Sea overnight or by accident.In a way, today is a new beginning for us aswell, i.e. our current activity in servicing theeast to west transit in its old form is probablyover and we really have reassessed our activities,but from a totally different platform than atthe beginning of the 90s.“The Port of Tallinn has its own vision to givethe space by the sea its biggest possible value,so in other words, the Port of Tallinn is usingevery available possibility to use the space itowns by the sea in a way that would producethe best economic profit. Ain Kaljurand doesnot forget to add that all this is of course donein accordance with the strictest environmentaland nature conservation conditions. “And evenif today the Port of Tallinn does not handlegoods, own ships or is not involved in real estatedevelopment, the situation could change,”the manager of the port is quite convinced.Even though the history of the ports ofTallinn is thousands of years old, thePort of Tallinn as a company is still ayoung enterprise. The public enterprise,the Port of Tallinn, was founded in April1992. In the year 1996 the public enterprisewas changed into a public limitedcompany, with the Republic of Estoniaas its only shareholder. The Port ofTallinn has expanded out of Tallinn aswell: some of the harbours are locatedquite far outside from the city limits.The Port of Tallinn consists of five differentharbours – the Old City Harbour,Muuga Harbour, Paldiski South Harbour,Paljassaare harbour and Saaremaaharbour.TALLINNA SADAM 2007Sales (th EEK) 1,162,445Change in sales 98.7%Net profit (th EEK) 335,831Change in net profit 56.4%Number of employees 553Investments (th EEK) 853,000Return on equity 7.5%Place in the CompetitivenessRanking 2008 3792November2008
TOP ESTONIAN ENTERPRISES 2008Transportation and Logistics EnterprisesPLACESALES CHANGE NET PROFIT CHANGE RETURN LABOUR COSTS EFFICIENCY PER INVESTMENTS % OFENTERPRISE IN SALES IN NET PROFIT ON EQUITY PER EMPLOYEE EMPLOYEE THE FIRST* group TH EEK PLACE % PLACE TH EEK PLACE % PLACE % PLACE EEK/month PLACE TH EEK PLACE TH EEK PLACE (0 .. 100)1 TALLINNA SADAM AS* 1,162,445 1 98.7 11 335,831 1 56.4 12 7.5 14 26,526 6 2,102 7 853,000 1 100.0%2 COMBIFRAGT EESTI OÜ 92,120 6 141.6 3 9,231 6 415.6 2 76.2 2 23,736 7 4,387 5 149 11 75.1%3 AR AGENTUURI AS 27,033 12 122.0 6 1,788 10 1,391.3 1 74.3 3 22,955 9 1,502 10 1,037 10 74.7%4 ASPERAAMUS OÜ 68,414 7 149.2 1 1,204 12 250.7 5 57.5 4 9,137 13 9,773 1 3,606 8 70.6%5 LENNULIIKLUSTEENINDUSE AS 230,805 3 110.4 10 82,309 3 115.0 7 34.3 10 45,132 1 1,832 8 34,005 3 63.5%6 INTEREXPRESS EESTI OÜ 39,841 9 119.8 7 609 13 189.9 6 83.6 1 21,546 10 3,984 6 3,846 7 62.9%7 SPACECOM AS* 603,843 2 83.0 13 135,789 2 66.8 11 30.2 12 27,612 5 4,681 4 45,549 2 62.9%8 ALISTAR GROUP OÜ* 37,389 10 112.8 9 383 14 80.3 9 49.4 6 16,944 11 7,478 2 43 12 53.8%9 DPD EESTI AS 97,985 5 147.7 2 5,371 7 69.3 10 47.7 7 23,107 8 1,517 9 1,260 9 51.2%10 GRT EESTI OÜ 17,275 14 114.2 8 2,289 9 334.6 3 32.2 11 30,886 3 1,152 11 14 47.4%11 ESTEVE TERMINAL AS 132,170 4 128.1 5 12,446 5 81.3 8 34.7 9 27,653 4 1,041 12 24,600 4 46.5%12 RUSSIAN ESTONIAN RAIL SERVICES AS 65,389 8 45.0 14 38,670 4 37.5 13 12.4 13 37,725 2 7,265 3 13 41.6%13 KUNDA MOBIL AS 17,385 13 134.2 4 1,600 11 268.7 4 51.7 5 7,408 14 1,023 13 4,287 6 41.3%14 ASSOTRANS AS 36,339 11 90.8 12 3,373 8 47.3 8 10,729 12 498 14 6,723 5 25.7%1 EUR = 15.6466 EEK; 1 EEK = 0.0639 EUR; based on 2007 data See also www.konkurents.ee
TOP ESTONIAN ENTERPRISES 2008Swedbank special prize 2008 – the Most Successful Expander in the Baltics – Toode ASThe whole world looks at the BalticStates as a common economic area; businessactivity does not recognise stateborders and there are more and morecompanies that are active in all threeBaltic States. There is plenty of potentialfor additional inner growth on the Balticmarkets. By wishing to recognise thecompany who was the most successfulin expanding its activity in the Baltic regionin 2007, this year, Swedbankawards a special prize “The Most SuccessfulExpander in the Baltics“. The exploitationand exceeding of thedifferences between the three BalticStates at creating competitive advangate,the development of cross-border cooperationand the turning of foreign marketsinto the “home market“ of the companyare worth noticing.Roof builders think two stepsaheadIf at some point, Aivo Rosenberg and MatiKitt, the owners of AS Toode, which deals withsteel roofs and rain water systems, should becometired of their business and become men ofindependent means, they could easily write atextbook on the innovation of the businessmodel because they know the art of cleverly developinga company and taking it to foreignmarkets to every detail. The turnover of Toode,which at its time was one of the first privatecompanies in Estonia, has become ten-fold inten years, and will reach MEEK 350 this year.The company is active in the Baltics, Finlandand Russia.The mentioned textbook should definitely containthe following eight chapters:Chapter I – Do it yourselfKitt and Rosenberg, the men at Toode, are constantlytwo steps ahead of time and competitorsin their decisions. The company startedbusines in 1991. As there was not much constructionmarket in Estonia at that time, metaland sheet metal contract works were made fora Finnish roof manufacturer. Estonia was facingconstruction growth and the men decidedto manufacture roofs on their own. The firstroof manufactured by Toode was sold in 1993and a few years later, the company was goingstrong in Estonia. As the Finnish market hasbeen well-known for a long time, it is not aproblem to sell there today.Chapter II – Sell it yourselfIn the middle of the 1990s, roofs and rain watersystems were sold by large construction stores.They suppressed the prices of manufacturers toearn a maximum amount of commission.“We offered roofs for the same price and fromthe same material as did our competitors,which is why we stores were not interested inus. And it was good that no-one was interestedbecause then we invited the clients directly tous, got better feedback and a better final price,which was a very good step!“ says Rosenberg.Toode gained considerable advantages over thecompetitors, as well as a noticeable marketshare, which has increased by 36% in Estoniaby today. According to Rosenberg, the wholeworld is moving towards the same directionnow: for example, Baltika, which once producedgoods for warehouses and stores, is nowMonton – a chain store.Chapter III – Be thoroughToode does not only sell roofs and rain waterpipes, but also puts the roof on your house togetherwith all additions starting from roof windowsand finishing with chimney caps. TheSaue factory of Toode is visited by developers,construction companies, apartment associationsand private persons who all get theturnkey service. “We manufacture as much aspossible on our own, as much as is possiblyprofitable,” says Rosenberg.Chapter IV – Invest during hard timesIn 1999, the Estonian economy was in a propercrisis. Several businesses withdrew, but the menat Toode decided to expand to Latvia, doublingthe marketing budget. “On the border, we metthe banks and insurance companies who all escapedfrom Latvia,” Rosenberg recalls. The resultwas that the turnover of many companiesdecreased that year, but not for Toode. In 2000,business was started in Lithuania. The proportionof Latvia and Lithuania makes up 27% ofthe turnover of Toode today, but there is plentyof room for growth in these countries.Chapter V – In the good times, thinkabout the bad timesFirst, it must be said that Rosenberg does notbelieve that there will ever be such a consumptionorgy again in Estonia as there was in theyears 2002-2007. In the recent years, there hasbeen a real construction boom here, theturnover of Toode has increased by 30% everyyear. By today, while many companies are onlylooking for alternatives for the cooled down Estonianmarket, the men at Toode are active inRussia and Finland for the third year.“In St. Petersburg, we are a manufacturer andsell the chain, feeling how the store suppressesthe prices. Knowledge of the market and competitorsis important there, keeping the foot inthe door,“ says Rosenberg. In Finland, Toodeprovides a full service, just like in the Baltics.According to Rosenberg, during the peak of theboom, new ways and possibilities must alreadybe sought as at the end of the boom, you will behopelessly late with it.Chapter VI – Be patientTo succeed, one needs initiative and courage,but also patience. You cannot give up rightaway if the sale on a foreign market is not successful.The men at Toode know that for example,it takes at least two years to understand theoperation and risks of the Russian market. “InRussia, we compete with the Finns whose “finskajakatshestva“ is very much honoured there.We have spent a lot of time proving to ourRussian partners that we provide the same goodquality, but with more flexibility and for morefavourable prices,” Rosenberg notes. Today,Toode expects the greatest turnover growthfrom Russia and Finland.Chapter VII – Be from EuropeA decade ago, slogans such as “prefer Estonian!“were waved. Today, the global is preferred.Initially, Toode approached the Latvian andLithuanian markets in the so-to-speak nationbasedmanner – in Latvia, the company wasnamed Tode and in Lithuania, Todesas. Thecommon Toode group was formed only in2007. “Just like Hansapank is turning intoSwedbank, we felt that there will be trust towardsone who is large and global. We wantedto give our company a touch of the EuropeanUnion.” Rosenberg says.Chapter VIII – Be carefulThis chapter could be summarised as follows:think through your risks and dangers, even ifthese have not formed. According to Rosenberg,Toode must see that none of its clients becomestoo big and important for the companyas then it would also become dangerous and apotential competitor.94November2008
TOP ESTONIAN ENTERPRISES 2008Best Student Company 2008MATHECOElin Mänd, the sales manager of Math-Eco: “We want our product to becomean additional study material in the future.Also, we will try to sell it outsideEstonia.“PHOTO: TOOMAS TUULThe students at Luunja makemathematics interestingMathEco, the best student company of 2008,wishes to contribute to making exact scienceinteresting and through that, to the improvementof the entire European competitiveness.The company established by Olavi Ala, EvenVohla, Ahti Maa, Elin Mänd and Eva Knoll,pupils at Luunja High School, develops andproduces a fascinating mathematical dominogame. The mission of the company is to makethe studying of mathematics simpler for child -ren by the aid of an interesting logics game, atthe same time developing logical thinking andmental calculation skills. There are several differentgames comprising addition, subtraction,mulitiplication and division. The games alsohave different hardness levels starting from thekindergarten and finishing with high school.According to Elin Mänd, the sales manager ofMathEco, the domino idea came to one of thefounders of the company when looking aroundat a toy shop. The idea was introduced to othersand they started developing the idea together.So, a product was born that wasimproved on the basis of the feedback receivedfrom fairs. Mänd says that for example, twocolourdomino stones were replaced by multicolourstones and the initial black and whiteproduct became a product with eight differentcolours. In addition to the mathematic domino,the company now has the language domino aswell. The company offers two different versionsof the product; one is wooden and meant foruse at schools and the other from laminatedcardboard, for families. The students dividedthe production tasks of the domino betweenthemselves. The boys cut out small dominostones from a large sheet of veneer and polishedthem smooth. The girls printed the covers ofthe products together with the sheets and gluedthem on the stones. The stones with themathe matical operations were packaged in abox with marketable appearance, orderedseparately. The furniture company Sarkop hasprovided the materials for MathEco.MathEco got its first sales experience at the fairof the student companies of the school, whereboth students and teachers were greatly interestedin the domino. After that, the companyhas sold its products at various fairs of studentcompanies across Estonia. For example, inRapla at Konsum Christmas fair, in Pärnu atPort Artur department store, in Tallinn at PelgulinnaGymnasium and in Tartu at ForseliusGymnasium, also at Kristiine Centre. The productsof MathEco sold the best in Rapla wheresales numbers were better than expected andall products sold very quickly.The students at MathEco believe that the productmainly satisfies the need for unity as thegame can be played by several people at a timeand if someone knows mathematics, they donot feel bad or sillier than others. Knowledgeof mathematics provides people with confidenceand a smaller chance to be cheated. Thename MathEco is derived from the wordsmathe matics and economic. The name wasgiven to the company rather recently; earlier, itwas known by the name M.T.K, which meant“Mõistus tule koju!“ (“Reason, come home!“).At Luunja High School, student companies areactive for the nineth year already. The instructorof MathEco, Ülle Tõnutare, the teacher ofeconomics at Luunja High School, is proud ofthe achievments of her students and is convincedthat once they graduate from highschool, they will definitely establish their ownreal company.Due to the experience from the student company,the students at MathEco said they foundout what the establishment and operation of acompany mean. It was also a good way to get toknow economy and its twists and turns. In thefuture, the students plan to finish the schooland found their own real company. The industrialdesign protection for the mathematicaldomino is being applied for. “We want ourproduct to become an additional study materialin the future. Also, we will try to sell it outsideEstonia,“ Mänd says.November 200895
TOP ESTONIAN ENTERPRISES 2008European Enterprise AwardsRecognise promoters of enterprise 2008"Recognise promoters of enterprise” is thenational preliminary round organised inthe framework of the pan-European contest“European Enterprise Awards”, which is aimedat identifying, recognising and presenting to thewider public the outstanding initiatives and activistswho have contributed to the promotionof the business environment.“As a result of the contest “Recognise promotersof enterprise”, two main prizes wereawarded this year, to the project “Youth businessplans contest “Ajujaht““ by BDA ConsultingOÜ, and the project “A learning village“ bythe non-profit association Estonian VillageMovement Kodukant. The jury also announcedwinners of the subcategories of the Estonianpreliminary round. In the EntrepreneurshipDevelopment category, the project “Youth businessplans contest “Ajujaht““ by BDA ConsultingOÜ was awarded, and the EntrepreneurshipPromotion Award was given to the project“Business incobator as a base structure for thepromotion of small business enterprise“ by theTallinn Business Incubators Foundation. TheInvestments in Skills Award was awarded bythe jury to the project “Invention training“ bythe foundation Ida-Viru Enterprise Centre; theResponsible and Inclusive EntrepreneurshipAward was given to the project “A learning village“by the non-profit association Estonian VillageMovement Kodukant. The jury alsodecided to award a special prize for the promotionof business education to the project“Entrepreneurship promotion at vocationalschools“ by Foundation Innove.For identifying the winner and selecting thebest, the common pan-European methods wereused. At assessment, the originality of an initiative,the effect on local economy, both shortterm and long-term, and the sustainability ofthe project were proceeded from. Also, it wasconsidered how much various interest groupshave been included in the elaboration and implementationof the project and what the possibilitiesfor applying the experience in otherregions are.The jury of the national contest “Recognise promotersof enterprise 2008“ consisted of StrategyDirector of the State Chancellery KeitKasemets, who was the Chairman of the jury,Head of the Economic Development Departmentof the Ministry of Economic Affairs andCommunications Lauri Tammiste, Head of theLabour Market Department of the Ministry ofSocial Affairs Thor-Sten Vertmann, Member ofthe Management Board of EAS Ülari Alamets,Director General of the Estonian Chamber ofCommerce and Industry Siim Raie and Memberof Management Board of the ExecutiveTraining Centre of EBS Madis Sander.The main prize of “Recognise promoters of enterprise2008” and the Enterprise PromotionAward were given to the project “Youth businessplans contest “Ajujaht““ submitted by BDAConsulting OÜ.Research has shown that young people aged16.24 are mainly seen as future entrepreneurs.Several support programmes are aimed atyoung entrepreneurs, but it is still hard to startwhen one has no prior experience in entrepreneurs.So, Enterprise Estonia launched a contestfor the business plans of students. Theproject was implemented by BDA Consultingtogether with partners.“Ajujaht“ consisted of three stages. First, a massivenotification campaign was organised,which included about 1,000 young people;after that, the participants submitted 104 businessideas that were advised by experts in runningorder. 24% of the ideas were personalservices, 20% Internet services, 15% transportand logistics and the rest of the projets belongedto the field of information and communicationtechnology, design, software andmobile solutions. These business ideas wereturned into 24 business plans (teams) whichwere provided top-level training in the followingthree months and if possible, mentors werefound for the teams. After the trainings, the improvedbusiness plans were assessed. The firstprize of the Ajujaht contest was awarded to amobile service solution with voice commands,the second place to a warehouse shelves systemin field of logistics, and the thid place to a possibilityfor marking texts on the Internet. Theprize fund amounted to EEK 875,000. Today,all teams that won are active and have usedtheir prize money for starting their own companies.The project team has decided to continue theorganisation of the Ajujaht contests and set upan ambitious goal to be the most prestigiousand attractive development programme for theEstonian youth by the year 2013, with the aimof growing a new generation of innovative andknowledge-extensive entrepreneurs.With regard to this project, the jury was especiallyimpressed by the great implementation,thorough knowledge of the target group, as wellas elaborated communication and of course,positive feedback grom all parties to the project.The second main prize of “Recognise promotersof enterprise 2008“ as well as the Responsibleand Inclusive Entrepreneurship Award weregiven to the project “A learning village“ by thenon-profit association Estonian Village MovementKodukant“.The activity of the non-profit association EstonianVillage Movement Kodukant is focusedon the development of rural life via trainings,distribution of information and other projects.The recurring idea in the project “A learningvillage“ was to establish lifelong learning centresin the regions that are farther from the centres,and launch study companies there. Studycompanies are a new initiative in Estonia, helpingadults acquire management, marketing,communication, accounting, business plancompilation and other skills in a year throughthe development and implementation of theircommon product or service. Within the frameworkof the project, 77 people from differentvillages participated in the activities, and theprogramme was successfully completed by 15study companies from various fields rangingfrom the provision of babysitting services to thepreparation of whetstones.In the course of the project, study companymethods aimed at adults were developed, andin the final stage of the project (April 2008),1,000 copies of the study materials introducingthe methods of a study company were printed.96November2008
TOP ESTONIAN ENTERPRISES 2008By the end of the project 17 people weretrained on the methods of a study company,that is, on how to organise practical businesstraining for adults. The training also providedinformation on the opportunities of a village societyand the organisation of lifelong learning.This laid the basis for the continuation ofsimilar activities and trainings in the future.The feedback to the project “A learning village“was positive – several people have become orplan to become sole proprietors, several havefound a suitable extra job or can sell their skillsbetter. The participants have also improvedtheir understanding of the roles of an entrepreneurand of their ability to be an entrepreneur;the courage to act and interact has increased,as well as cooperation with municipalities.Among other great projects that participated inthe contest, “A learning village“ stood out forthe jury with its fresh focus and a strong regionaleffect. The use of study companies andthe strong binding thereof with local communitieshas potential to solve local life problems,too, in addition to the promotion of enterprise.The Enterprise Award was awarded to thepro ject “Business incubator as a base structurefor the promotion of small business enterprise“by the Tallinn Business Incubators Foundation.Incubators have been of use for many companiesin their starting days. The Tallinn BusinessIncubators Foundation has two incubators inwhich 21 companies are using the incubationservice. The incubation service allows an entrepreneurto get counselling, study cooperationand rent working premises for favourableprices. In the future, it is planned to make theincubators more specialised; as the next step ofthis process, an incubator will be opened at theend of 2008 for the entrepreneurs active in thecreative sector.The Investment in Skills Award was given bythe jury to the project “Invention training“ bythe Foundation Ida-Viru Enterprise Centre.The invention training project proved that almosteveryone can be an inventor and that inventingdoes not presume great knowledge andcan be a very practical activity, not a hobby forfreaks. As a result of the project, 12 inventionswere given the certificate of a utility model,which made up as much as 9% of the annualnumber of utility models in Estonia.The jury also decided to award a special prizefor the promotion of business education to theproject “Entrepreneurship promotion at vocationalschools“ by Foundation Innove.As a result of the project, 1,500 students and 79teachers participated in the entrepreneurshiptraining. The objective was to increase theknowledge of students and teachers of vocationalschools of enterprise. Practical study materialswere prepared, as well as a simulation gamePizzeria, which allowed to experience the effectof one’s decisions on a virtual company.“As a result of the contest “Recognisepromoters of enterprise”, two mainprizes were awarded this year, to theproject “Youth business plans contest“Ajujaht““ by BDA ConsultingOÜ, and the project “A learningvillage“ by the non-profit associationEstonian Village MovementKodukant.The jury also announced winners ofthe subcategories of the Estonianpreliminary round. In the EntrepreneurshipDevelopment category, theproject “Youth business plans contest“Ajujaht““ by BDA ConsultingOÜ was awarded, and the EntrepreneurshipPromotion Award wasgiven to the project “Business incobatoras a base structure for the promotionof small business enterprise“by the Tallinn Business IncubatorsFoundation.The Investments in Skills Award wasawarded by the jury to the project“Invention training“ by the foundationIda-Viru Enterprise Centre; theResponsible and Inclusive EntrepreneurshipAward was given to theproject “A learning village“ by thenon-profit association EstonianVillage Movement Kodukant.The jury also decided to award aspecial prize for the promotion ofbusiness education to the project“Entrepreneurship promotion atvocational schools“ by FoundationInnove.November 200897
TOP ESTONIAN ENTERPRISES 20082007 – year of the cooling down of conomyPHOTO: PRIIT SIMSONLeev Kuum Estonian Instituteof Economic Research.The development of Estonia in the pastfour years of the present economic cyclehas been diverse enough by years to characteriseeach one of these with different keywords:• 2004 – year of acceleration• 2005 – year of active market• 2006 – year of overheating• 2007 – year of cooling down• The year 2008 could be named the hard anddifficult time of adaptation.2007 earned the title of the year of coolingdown mainly due to a considerable slowingdown of economic growth. Unlike the ordinaryslowing down of economic growth (whichshould be handled as a negative phenomenon),2007 was a situation that can be called the preventionof overheating. In other words – a significantfeature of 2007 was the recovery fromthe real estate boom that culminated by the beginningof 2006. If the latter had continued fora long time, it might have caused many problemsfor the economy of the state. Thus, the aftereffectsof the overheating can be felt even in2008 and this mainly in the form of acceleratinginflation and the continuous rise in theprice of labour force. The end of the real estateboom was contributed to by the active reactionof the construction and real estate sectors towardsthe increase in the demand for housingby increasing supply. As a result, the high demandthat had formed by the aid of cheap loanswas satisfied rather quickly – already in the firsthalf of 2007 (however, on a remarkably higherprice level than earlier).The record-breaking rise in the price of labourforce was another significant keyword of 2007.The increase in the average wages was thatstrong that it gives a reason to talk about theexhaustion of the former, so to speak, cheapstate life model of Estonia. The reason was therapid increase in the demand for labour force inthe construction sector and the ability of thelatter to pay significantly higher wages than theaverage in the conditions of the boom. Thecompanies who wished to keep their employeeshad to support the rise in wages. Of course, allcompanies could not do this, but many could.To characterise the year 2007, high inflation asa third keyword cannot be overlooked. The reasonsfor this were factors from the side of bothdemand and supply, mainly, the joint effect ofthese factors. The prices of several types of rawmaterial and energy carriers went up and so didlabour force, of course. The fast increase in incomesallowed entrepreneurs to lay the costs ofthe rise in the price of production on the buyersby increasing the prices without it having aconsiderable negative effect on the sales numbers.Many purchases were made by people inthe fear that due to the continuing rise in theprice of inputs, the increase in the prices willcontinue. Price competition between companieswas weak.Let us have a closer look at all this now. In 2007,the gross domestic product (GDP) increased by7.1% at constant prices and amounted to EEK243 billion (increase at constant prices EEK 36billion or 17.4%). Compared to the year 2006,real growth slowed down by 4.1 percentagepoints or more than a third. Economic growthslowed down (decelerated) quarter by quarter:in the first quarter, the growth was 10.1%, in thesecond quarter, 7.6%, in the third quarter, 6.4%and in the fourth quarter, 4.8%. The main reasonsfor this slowdown were the real estate,rentals and business activity sector, wholesaleand retail sale, processing industry, warehousingand communication sectors. Financially, theslowing down of the economic growth was the98November2008
TOP ESTONIAN ENTERPRISES 2008most affected by the real estate, rentals and businessactivity sectors.The calculation of GDP by the consumptionmethod shows that in 2007, private consumptioncosts increased by 8.9% and investmentsinto fixed assets by 7.8% (all at constantprices). Compared to 2006, developmentslowed down considerably in both fields: by6.2 percentage points in private consumptionand by 14.6 percentage points in investments.Of the added value created, 31.9% was investedand 51.7% consumed by private persons,which shows that in 2007, there were more orless reasonable proportions between consumptionand investment.As a result of the slowing down of economicgrowth, the creation of new job positions alsoslowed down, but the number of employedpeople still increased by an annual average ofabout 1.4% or 9,000 employees (in 2006, byalmost 40,000 employees). The average numberof employed people in 2007 was 655,000people, of whom about 600,000 were wageearners (the rest were entrepreneurs). It wassomewhat surprising that the increase in thenumber of employed people was the highest inconstruction: according to the data from thethird quarter, there were 85,900 people employedin construction, which is 22,000 morethan in the same period in 2006. The numberof employed people increased actively also inthe hotels and restaurants sector (7,000 people)and in financial intermediation (3,500 people).The average rate of unemployment of theyear dropped to 4.7%, or by 1.2 percentagepoints. The number of unemployed people inthe fourth quarter was 28,100, a half of whomhad been unemployed by less than 12 months.The actvity rate increased by 0.6 percentagepoints in the year and amounted to 66%.Labour resources were practically exhausted,which is why lack of labour appeared as themain problem for the labour market, characteristicof almost all fields of business. As a result,the pressure on wages increased evenfurther (compared to 2006) and formed into aconsiderable problem for companies and fieldsof business engaged in simple work.Throughout the entire year, economic analystswere focused on the increase in consumerprices, which exceeded even the most pessimisticexpectations. The annual level of inflationwas 6.6% and in the fourth quarter,consumer prices increased by 9% compared tothe same period last year, and by 3% whencompared to the third quarter. Inflation acceleratedby 2.2 percentage points compared tothe year 2006. It is an extremely undesirablesituation that only partially can be justified withseveral objective factors from the side of supplyand demand (increase in the price of rawmaterials, energy carriers and labour force, increaseof income). At the same time, the increasein incomes weakened the pricesensitivityof consumers, allowing companiesto “slightly“ increase prices without losing theircompetitiveness. In 2007, the prices of foodand housing increased faster than the average(9.3% and 14.6%, respectively), hitting familieswith lower income hard. The fast increasein the consumer prices brought along an increasein claims for the increase in wages.In 2007, the export of goods increased by3.8%, which was considerably less than expectedand than was in 2006 (in 2006, 25.1%).Partially, this can be explained by the rise in theprices of production and as a result, the decreasein international competitiveness (productionprice index of industrial production8.3%, export price index 7.5%). What is positiveis that the slowing down of the growthspeed of export (but also a drop in some commoditygroups) mainly occurred in commoditygroups with low added value (mineralproducts, etc.), which is why its hindering effecton the economic growth was not verystrong. The companies of the processing industrywere able to mostly keep the proportionof export on the same level as before, which atthe initial estimate was 57% of the sale of industrialproduction this year. Traditionally, theproportion of export was higher in the field ofradio equipment (97%), precision instruments(88%), metals (86%), electric machines (85%)and chemical products (85%). The list of countrieswhere goods were exported to expandedby a couple of dozen of countries and reachedalmost 160 in 2007. Major partners for exportwere still Finland (18%), Sweden (13%) andLatvia (11%). As the export of goods wasmainly based on imported raw material andsemi-finished goods, the drop in the growthspeed of export made it possible to slow downthe import increment. According to the initialestimate, the import of goods in 2007 increasedonly by 5.4%, a year ago, this indicator hadbeen 30%. The deficit in the trade of goodsamounted to EEK 51.6 billion, which is about10% more than in 2006. The foreign trade balanceof services was positive as always (EEK13.3 billion), but in spite of this, the negativecurrent account balance was again very high –EEK 43.2 billion or 17.7% of the GDP.The lack of labour force and the continuouslyactive creation of new job positions (especiallyin the construction sector) increased the pressureon wages on the labour market. This, inturn, was supported by the faster increase inconsumer price. This resulted in the growth ofwages, which was remarkably faster than expected,amounting to a record-breaking 20% asthe average of last year, and took the averagewages up to EEK 11,336. At the same time, thefigures of the growth speed of productivity weredeteriorating and the anticipatory increase ofwages over production continued. All this intensifiedthe conclusion made already in 2006that the cheap state model that has broughtsuccess to Estonia in international competitionfor a long time is becoming exhausted. The increasein wage costs turned out to be a problemespecially in labour force extensiveindustrial companies and companies that wereactive on international markets. However, itmust be noted that an increase in wages is apositive result, from the viewpoint of the standardof living. In addition, it makes companiespay more attention to product developmentand innovation. By fields of business, the highestaverage monthly wages were in financial intermediation– EEK 21,200, and the increase ofwages in the sector amounted to 25.4%.Regardless of the high inflation, real wages increasedby a record-breaking 12.4% in 2007.The real estate market dropped that much in2007 that it can rightfully be called the end ofthe real estate boom that began in 2004-2005.The reason was the saturation of the market, thatis, fast increase in supply accompanied by highprices. Compared to the record-breaking 2006,the number of notarised real estate transactionsdropped by 17% (from 60.2 thousand to 50thousand transactions) and the value of salestransactions by 21% (from EEK 73.8 billion toEEK 58.5 billion). The average cost of a real estatetransaction dropped from 1,225 thousandkroons to 1,170 kroons, or 4.5%. By the numberof transactions, the real estate market receded tothe level of the year 2004 and by turnover, to thelevel of 2005. The real estate market showed adownwards trend throughout the year, but thedrop became quicker in the second half-year, especiallyin the fourth quarter. In the last quarterof the year, the volume of the market made upNovember 200899
TOP ESTONIAN ENTERPRISES 2008only a bit more than a half of the record-breakingfourth quarter level of 2006.The loan market continued expanding, andeven more so than in 2006. This regardless ofthe fact that the average interest rate increasedand the Bank of Estonia made the loan conditionsof commercial banks stricter. The totalloan portfolio of companies and private persons(together with leasing) increased from EEK 178billion to EEK 240 billion in the year, that is,by EEK 62 billion (EEK 52 billion a year ago).Borrowing promoted economic growth to a significantdegree, but of course, a developmentbased on loans cannot be sustainable.The loan balance of people increased by EEK28 billion in the year and amounted to EEK109 billion at the end of the year (equal to thewages fund of about 1.3 years), and these weremainly housing loans. These were accompaniedby leases, the volume of which amounted toEEK 7.5 billion at the end of the year (EEK 5.6billion at the end of last year). At the same time,the savings of people at commercial banksmade up EEK 53.7 billion or about a half of theloans. The savings of people at commercialbanks increased by EEK 7 billion in the year.The activity (turnover) of commercial enterprisesin the main fields of business in 2007 is characterisedby the following data: industrial production(volume index) increased by 6.7%, the retailsale of goods (volume index) increased by 15%and the volume of construction works (volumeindex) increased by 9%. At that, the cost of constructionworks made at one’s own expensemade up EEK 37 billion in 2007. All these indicatorsare positive, but show a decrease in thedevelopment speed compared to 2006. Then,the volume of industrial production increased by9.9%, the volume of retail sale by 19% and thevolume of construction works by 23%.There is only yet to add that the annual balanceof payments had an EEK 5 billion surplus andthe state budget an EEK 7 billion surplus.The year 2007 took the standard of living of theinhabitants of Estonia closer to the EU-27 ave -rage. According to the initial estimate, it is 72%now and Estonia is on the 20th position in thisranking. Further development depends on howfast the Estonian commercial enterprises can increasethe performance of their employees. Thebest way to do this is via changing the productionstructure, renewing technologies, productdevelopment and innovation.ASSESSMENTS OF INTERNATIONALRATING AGENCIES TO ESTONIA(as at 1 April 2008)• International Competitiveness Rating (IMD)The 22nd position among 55 countries. The rating characterisesthe Estonian business environment, export capacity,openness, development of infrastructure. Compared to lastyear’s indicator, the rating has dropped by 2 places.• Global Competitiveness Rating (World Economic Forum)The 27th position among 131 countries. The rating characterisesthe ability of a country to ensure sustainable economicgrowth in a medium term period. It is based on the informationthat characterises the development stage of a country regardlessof whether the development takes place on the basisof resources, technology or innovation. Compared to last year’sindicator, the rating has dropped by 2 places.• International Human Development Index (UN)The 44th position among 177 countries. The index takes intoaccount the level of education of people, lifespan, developmentlevel of economy, etc. Has dropped by 4 places since 2004.• Index of Economic Freedom (The Heritage Foundation)The 12th position among 157 countries. Has not changed in ayear. The assessment is based on trade policy, state intervention,monetary policy, the proportion of the black market inthe economy, etc.• International Corruption Perceptions Index(Transparency Internatsional)The 28th position among 179 countries. In the country that ison the first position, corruption is the lowest. A year ago, theposition of Estonia was 4 places higher.• International Long-Term Credit Rating(Standard & Poors)A/negative/A -1. It is based on the structural reforms made in acountry, the volume of direct investments, fiscal and monetarypolicy. The rating “A” means that a country is completely reliable.• International Information Technology Index (World EconomicForum)The 20th position among 125 countries. It is based on the useof IT at the promotion of the economy of a country. Estoniahas gone up by 3 positions in a year.• Bertelsmann Transformation Index(Bertelsmann Media Worldwide)Estonia is on the 3rd position among 125 countries. Characterisesthe development of market economy and democracy inthe country via the speed and efficiency of respective reforms.• Tourism Competitiveness Index (World Economic Forum)Estonia is on the 26th position among 130 countries. Theindex considers the security of the country, transport and ITinfrastructure, natural and cultural resources, healthcare andhygiene conditions, etc100November2008
Enterprise Estonia as the implementer of theEstonian economic objectivesEnterprise Estonia is a support system for enterprise and the implementationunit of the Structural Funds of the European Union inEstonia, offering support programmes, counselling, cooperationpossibilities and trainings.Enterprise Estonia is operating to ensure:• more sustainable and fast-growing companies in Estonia,• the ability of companies to export more and become more international,• a higher product development and technological capacity of companies,• higher tourism income for Estonia,• the integral and balanced development of the regions.We work towards these objectives to contribute to the achievementof a better business environment and greater public wellbeing.The new financing period of the StructuralFunds of the European Union for 2007-2013means significantly more activities for EnterpriseEstonia. From a total of more thanEEK 53 billion of structural aid to Estonia,Enterprise Estonia can implement 13 billion.In addition to the programmes co-fundedfrom the EU Structural Funds, other programmesalso serve to achieve these objectives.In our activities, we stress client-friendliness,efficiency and cost-efficiency.• Closer to the client! We are making ourclient administration system more efficientso that upon making investments, EnterpriseEstonia and the client would proceedfrom needs and challenges, not the formalconditions of the programmes. We will laygreater emphasis on the common identificationof challenges (diagnostics), also, onpreliminary and follow-up counselling. Weplan to open a self-service environment onthe Internet, where it would be possible toget advice before the completion of apro ject, exchange information in the courseof assessment and also help for submittingreports. County development centres willcontinue counselling.• More focused activity. We attempt to findand implement the projects that affect theachievement of the objectives the most. Weare also planning more activities that will beimplemented by Enterprise Estonia itself.Direct support is not a magic drug and willdefinitely not work without a good plan bythe beneficiary nor without know-how,however, awareness can successfully helpwithout the support as well. This is why thebasis for the structure of the programmes isthe exchange of information as diversely aspossible and to everyone; the granting ofsupport, however, is more limited and ofcourse, organised on the basis of clear criteria.Public and third sector projectsinspiring enterpriseAs the first one during the funding period2007-2013, at the end of 2007, one of themost voluminous programmes aimed at thepublic and third sector was opened – theRegional Competitiveness ImprovementProgramme. The first project that wasfunded was the completion of the constructionof the Estonian Traditional MusicCentre in Viljandi. This has been followed bymany projects establishing great prerequisitesfor the development of the businessenvironment of regions: restoration ofHaapsalu beach promenade and Varstu airfield,renovation of Palmse Manor, constructionof the Theatre House of Tartu ToyMuseum.Other supports provided so far also continued– for example, investment support forthe improvement of the local living environment,the local initiative programmeand several specific regional programmes(Setu, Kihnu). These were supplemented byseveral new opportunities, such as the mentorprogramme for non-profit associationsopened on the example of the businessmentor programme, and the Norway-EEARegional Development Block Grant.For all the good productsThe technology investments programme,eagerly awaited by entrepreneurs, wasopened, helping to obtain modern equipment.The capacity of companies is alsopromoted by the programme for the developmentof knowledge and skills, which doesnot support training as a value on its own,but sets a requirement that it must bethought through which changes trainingwill bring to the company as a whole and toits financial results.Both research institutions and companiesare creating new products by the aid ofproduct development support. “Product development”instead of the old “research anddevelopment support” stresses applicabilityand economic success, which is what wewanted to achieve with this support.Smart new (product) ideas are still the responsibilityof the Innovation AwarenessProgramme. After several years, it gave engineersand production managers their ownmagazine again – Inseneeria; the generalmagazine Hea Eesti Idee continued;through the journalism based on directtrips and experience there from, for the firsttime, Estonians could learn more aboutwhat is going on in the Silicon Valley andwhat Estonian entrepreneurs could dothere.Export refund as a tailored suitAn entrepreneur with a wish to export, butwith only little experience, has many topicalmeasures at their disposal. The ExportMarketing Programme helps to enter newmarkets; the Foreign Trade Show Programmeallows having a look at and partici -102November2008
pating in major presentation shows; theJoint Marketing Programme allows to uniteseveral entrepreneurs if own forces are insufficient.All foreign agencies of EnterpriseEstonia still provide assistance to exporters;databases full of information and providingvarious possibilities for enquiries are constantlyat the disposal of those who are interested;in autumn 2008, EnterpriseEstonia will start organising systematic export-relatedtrainings.third sector. The product development supportis divided into grants for small andlarge projects. This helps to better considerthe profiles and needs of different applicants.One thing is similar – the provision ofsuch unique visiting experience based onnational peculiarity is preferred, which dueto its uniqueness has the potential to arise agreater interest both in Estonia and abroadand also decrease the seasonality oftourism. Not only are we talking more andmore about just good products, but try toIn March 2008, Ajujaht 2007, the first pan-Estonian contestfor students and young scientists came to the end. Theinitiator of the contest was Enterprise Estonia and organisersSEB Pank, BDA Consulting OÜ and INSEAD BusinessSchool, and the patron was Andrus Ansip. In total, morethan a hundred business ideas were submitted to the contestwith the prize fund that amounted to more than EEK700,000. The young people who made it to the finals weretrained by Professor Patrick Turner from INSEAD BusinessSchool, who was surprised that these very young peoplehad submitted absolutely practicable ideas to the contestas he expected a bit more utopical ideas.Photo: Ajujaht, Patrick TurnerStart and grow!We continued with start-up and growthprogrammes. Special attention has beenpaid on finding and assisting the entrepreneurswho plan to grow quickly and export,or have already started with it and need additionalsupport. These measures are supportedwith the start-up loan given incooperation with KredEx. The BusinessMentor Programme is starting for the fourthyear already and has proved itself as the improverof the sustainability and profitabilityof starting companies. Starting companieswill continuously receive good supportfrom the partners of Enterprise Estonia andcounty development centres at the compilationof their business plan. The portalaktiva.ee is still there to assist in legal andeveryday issues of business; those in doubtare encouraged by the start-up log and the“Tegevusalade ABC” on the website of EnterpriseEstonia, which describes the situationand prospectiveness of various fields ofbusiness.National is the most internationalThe new tourism marketing support isaimed at entrepreneurs, the public and theIn cooperation with Helsinki city and Helsinki cultural centre, the EstonianTourist Board organised the event “Viro tulee külään”, which introducedEstonia, in Helsinki city centre on 9-10 May 2008. The event was visited by250,000 people from Helsinki and its surroundings. The event was part ofthe events of the 90th anniversary of Estonia and similar events will be organisedduring this year in seven Finnish towns. Estonia has been the mostpopular tourist destination for the Finns for years. 75% of the adults ofFinland have been here; the Finns make up about a half of the visitors ofEstonia.find real trumps for Estonia anddraw attention to them, for example, by accommodatingthe bird watching enthusi-Photo: 2008, May 9-10, Estonian days in Helsinkiasts and journalists who recently visitedEstonia. At the initiative of the EstonianTourist Board, the regional tourism initiativesof Estonia participated for the firsttime in the pan-European contest for lessknown tourist destinations. •Photo: 2008 April in Silicon Valley,Nordic Green, Juhan PartsMagazine “Inseneeria”On 21-22 April, the contact seminar Nordic Green 2008 organised by Enterprise Estonia and the Nordic technology agencieswas held, the topics of which were environment-friendly energy technologies and which was attended by scientistsand businessmen from all Nordic countries, Estonia and the USA. The Minister for Economic Affairs and CommunicationsJuhan Parts, who spoke at the seminar, stressed that in addition to contributing to renewable energy, environmentfriendlyenergy production also means cleaner technologies at using fossil fuels, and stated that Estonia is very muchinterested in such cooperation.November 2008103
ESTONIAN CHAMBER OFCOMMERCE AND INDUSTRYThe First Business Address in EstoniaThe Estonian Chamber of Commerce and Industry (ECCI) is the oldest and largestEstonian representative organization of entrepreneurs and was founded to representand protect common interests of Estonian merchants, manufacturers, bankersand ship-owners in the year 1925. The mission of the ECCI is to develop entrepreneurshipin Estonia through taking actively part in designing economic policy andvia rendering business services.Representatives of the ChamberTALLINNToom-Kooli 17Phone: 604 0060Fax: 604 0061koda@koda.eeTARTUPikk 14Phone: 744 2196Fax: 744 2197tartu@koda.eePÄRNURingi 35Phone: 443 0989Fax: 443 0859parnu@koda.eeJÕHVIPargi 27-203Phone: 337 4950Fax: 337 4951idaviru@koda.eeKURESSAARETallinna 16Phone: 452 4757Fax: 452 4758saare@koda.ee
• represents and protects the interests of themembers of the ECCI• influences and develops on the businessclimate• promotes export• trains entrepreneurs• shares contacts• gives EU-related and legal advice• designs the education policy• provides services• supports regional development• promotes the arbitration clause• shares information• is a communication channel forentrepreneurs• influences and develops on the business climate:Traditional meeting of the President of the Republic of Estonia and ECCI’s Board• shares information: the publications of the ECCIThe Newspaper ofthe ECCIThe Newspaper ofthe ECCI in RussianTop EstonianEnterprises• promotes export: The Prime Minister of theCzhech Republic meets the members of the ECCI• is a communication channel for entrepreneurs:The Opening of the ECCI’s Business Season 2008/2009 in Tallinn Zoo• shares contacts:Estonian business delegation meets the entrepreneurs of Croatia• Estonian Export Directory(www.estonianexport.ee)• For the 90th anniversary ofthe Estonian Republic ECCIissued book “Leading Brandsof Estonia 2008”
The Estonian Employers’ Confederation representsassociations of branches of economy andentrepreneurs on the international, Europeanand Estonian level. As the oldest business organisationin Estonia, the Estonian Employers’Confederation, established on 2 March 1917,has made the voice of the representatives of theemployers heard for ninety years already. Successis guaranteed by active members and aninternational contacts network. We unite pastexperience and future visions.•••The Estonian Employers’ Confederation has aword to say in the economy of the Republic ofEstoniaas a strong representativeorganisation.•••We actively participate in protecting the interestsof our members in the issues related tothe labour market, in social issues and at theformation of labour relations as amoderator of dialogue.“No matter how successful companies are, theycannot affect all processes in a country or awider economic space that could affect their futuresuccess. Membership will provide achance for that!”“The Estonian Employers’ Confederation is activelyinvolved in the shaping of policies. We mediatethe positions of companies and representour members in relations with the state to makewise decisions for activating the economy.”Enn VeskimägiChairman of the Councilof the Estonian Employers’ ConfederationTarmo KriisManager of the Estonian Employers’ Confederation106November2008
In the dialogue with the representatives of employers andthe state apparatus, permanent success is guaranteed in theEstonian economy.As a direction indicator in economyThe economic conference “Kite Fly” represents both practicalknowledge and high-flying visions. In a circle of politicians,entrepreneurs and experts, the socioeconomic issuessignificant from the viewpoint of the development of Estoniaare analysed.ANNIVERSARY CONFERENCEKITE FLY 2008 OF THEESTONIAN EMPLOYERS’CONFEDERATIONAs a representative of interests onthe international arenaThe Estonian Employers’ Confederation is the most representativesocial partnership organisation that represents theinterests of employers on the international, European and Estonianlevel. The Confederation is a member of the Europeanemployers’ umbrella organisation BUSINESSEUROPE andthe International Organisation of Employers (IOE). We representthe members in the advisory committees and workinggroups created by the European Commission and participatein the work of pan-European agencies and foundations.The weekly electronicnewsletter “Vabrik” coversthe news and events of theConfederation and keepsthe members posted withthe topical issues and activitiesof the Confederation.It is exactly now that the economy needsbright ideas and active people to gainpower for a new development leap. Wewish the participants of the enterprisecontest courage and success in achievingtheir goals!November 2008107
TOP ESTONIAN ENTERPRISES 2008Review of the entrepreneurship contests’ ceremonial award-gala 2008President Ilves wished success in the fastlychanging, although not so stable world. Heemphasized that this is up to entrepreneurswhether we can again talk about theEstonian economic miracle or not in tenyears time.ABB was acknowledged worth of the title of EntrepreneurshipAward 2008, ABB also became the winner in the category ofForeign Investor 2008. President Ilves presenting the mainprize to Bo Henriksson, the ABB group’s manager of the BalticStates.Tallink Grupp repeated its last year’s result by obtaining the title theEstonian Most Competitive Company 2008. President Ilves presenting themain prize to Andres Hunt, the member of the board of Tallink Grupp.Swedbank gave the special prize to the Most SuccessfulExpander in the Baltics. This prize was awarded to Toode,dealing with steel roofs and rain water systems. Priit Perens,the Head of Swedbank in Estonia presenting the prize to oneof two owners of Toode, Aivo Rosenberg (on the right).108November2008
TOP ESTONIAN ENTERPRISES 2008Review of the entrepreneurship contests’ ceremonial award-gala 2008The winners of the Entrepreneurship Award 2008, Estonian Companies’ Competitiveness Ranking 2008 and organisers of the competitions.Olympic Casino Eesti became the Most Competitive ServiceCompany 2008.Priit Jagomägi, the chairman of the management board ofLodjaselts was sincerely happy in receiving the award TourismInnovator 2008. The company deals with organising and training ofbarge trips on Lake Peipsi.The band called “Vägilased” (heros)performed in the hall for business“heros”.November 2008109
TOP ESTONIAN ENTERPRISES 2008Copywriters:Estonian Chamber of Commerce and IndustryPiret Salmistu – piret@koda.eeKadri Liimal – kadri@koda.eePhone: +372 604 0060Enterprise EstoniaJüri Luud – jyri.luud@eas.eePhone: +372 627 9700Estonian Institute of Economic ResearchMarje Josing – marje@ki.eeMati Reiman – mati@ki.eePhone: +372 668 1242Articles:Kaileen Mägi – The articles about the winnersof the Estonian Companies’ Competitiveness RankingToivo Tänavsuu, Eesti Ekspress – The articles about the winners of the Enterpreneurship Award,Swedbank special prize and Student CompanyLayout:DisainikorpPrint:Kroonpress110November2008
Konkurents.eeTop EstonianEnterprises?EntrepreneurshipAward?CompetitivenessRanking?Estonian Chamber ofCommerce and IndustryEntrepreneurship contests?• History of the contests• Special Awards• Gallery• Useful links• ContactEntrepreneurshipAward 2008Estonian Companies'Competitiveness Ranking2008Search:NEWS: 10 October 2008”The state should create the advantages of exportdevelopment for the strategic economicbranches to improve the Estonian competitiveness,”IT-businessman Jaan Pillesaar noted.Read more 8 October 2008Estonia dropped five places in the table of competitivenessof the states.Read more 19 September 2008The speech of Toomas Luman, chairman of theboard of the Estonian Chamber of Commerceand Industry at the award gala on 18 September2008.Read more 19 September 2008President: mutual accusations do not promoteEstoniaRead moreCompetitiveness to be made international!For the 13th year, the state is expressingrecognition by awarding the EnterpriseAward, and for the sixth time, we are identifyingthe most competitive Estonian companies.This way, we can have a chance toassess the performance of hundreds of companies.All participants, thank you!Competition as an economic contest – thecontest for better sales results, more loyalpartners and talented employees is tougheron the Estonian market today than ever before.Instead of growth, we talk about theadaptation of the economy and look for waysto restore the fast growth. International competitivenesshas also made domestic measuringimportant.>> Read moreEstonian Chamber of Commerce and Industry | Phone: +372 60 400 60 | E-mail: koda@koda.ee - www.koda.eeAll information about top Estonian Enterprises:Konkurents.eeEstonian Companies'CompetitivenessRanking 2008EntrepreneurshipAward 2008