- Page 1 and 2: MATLAB®The Language of Technical C
- Page 3 and 4: Contents1Command SummaryGeneral Pur
- Page 5 and 6: 1Command SummaryThis chapter lists
- Page 7 and 8: Controlling the Command Windowclcec
- Page 9 and 10: evalinfevalfunctionglobalnargchkper
- Page 11 and 12: InfInfinityinputname Input argument
- Page 13 and 14: ealremroundsec, sechsignsin, sinhsq
- Page 15 and 16: funmlogmsqrtmEvaluate functions of
- Page 17 and 18: Polynomial and Interpolation Functi
- Page 19 and 20: Sparse Systems of Linear Equationsb
- Page 21 and 22: hex2dechex2numIEEE hexadecimal to d
- Page 23 and 24: Multidimensional Array Functionscat
- Page 25 and 26: stream3streamlinesurf2patchsubvolum
- Page 27 and 28: colormapgraymonhsv2rgbrgb2hsvrgbplo
- Page 29 and 30: Interactive User Inputginput Graphi
- Page 31 and 32: 2ReferenceThis chapter describes al
- Page 33 and 34: areaExamplesPlot the values in Y as
- Page 35 and 36: axesWhile the basic purpose of an a
- Page 37 and 38: axesIn this example, the first plot
- Page 39 and 40: axesProperty Name Property Descript
- Page 41 and 42: axesProperty Name Property Descript
- Page 43 and 44: axesProperty Name Property Descript
- Page 45 and 46: axesProperty Name Property Descript
- Page 47 and 48: Axes Propertiesgraphics object disp
- Page 49 and 50: Axes PropertiesCameraViewAngleCamer
- Page 51: Axes PropertiesCurrentPoint 2-by-3
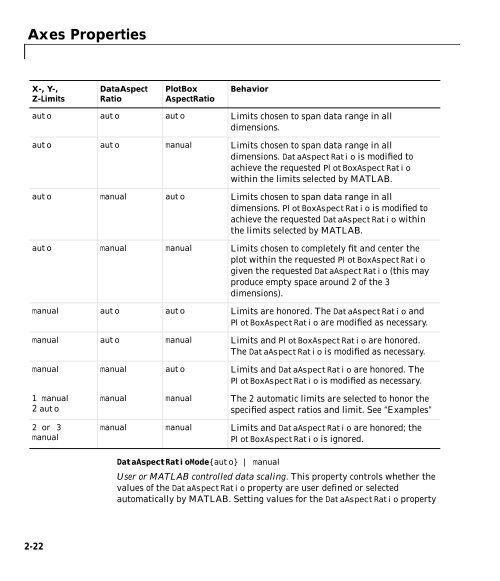
- Page 55 and 56: Axes Propertiessetting the XLabel,
- Page 57 and 58: Axes Propertiessets LineStyleOrder
- Page 59 and 60: Axes Propertiesaxes are made as lar
- Page 61 and 62: Axes PropertiesTypestring (read onl
- Page 63 and 64: Axes PropertiesXLabel, YLabel, ZLab
- Page 65 and 66: axisPurpose2axisAxis scaling and ap
- Page 67 and 68: axisaxis normal automatically adjus
- Page 69 and 70: axisThe right figure shows a more s
- Page 71 and 72: ar, barhPurpose2bar, barhBar chartS
- Page 73 and 74: ar, barhExamplesPlot a bell shaped
- Page 75 and 76: ar3, bar3hPurpose2bar3, bar3hThree-
- Page 77 and 78: ar3, bar3hsubplot(3,2,4)bar3(Y,0.5,
- Page 79 and 80: oxPurpose2boxControl axes borderSyn
- Page 81 and 82: camdollyPurpose2camdollyMove the ca
- Page 83 and 84: camlightPurpose2camlightCreate or m
- Page 85 and 86: camlookatPurpose2camlookatPosition
- Page 87 and 88: camorbitPurpose2camorbitRotate the
- Page 89 and 90: campanPurpose2campanRotate the came
- Page 91 and 92: camposSee Alsoaxis, camproj, camtar
- Page 93 and 94: camrollPurpose2camrollRotate the ca
- Page 95 and 96: camtargetExamplesThis example moves
- Page 97 and 98: camupSee Alsoaxis, camproj, campos,
- Page 99 and 100: camvaSetting a camera view angle or
- Page 101 and 102: capturePurpose2captureis obsolete i
- Page 103 and 104:
caxismap them to an entry in the co
- Page 105 and 106:
caxisThe blue color of the ocean is
- Page 107 and 108:
clabelPurpose2clabelContour plot el
- Page 109 and 110:
clfPurpose2clfClear current figure
- Page 111 and 112:
closemust specify the hidden option
- Page 113 and 114:
colorbarExamplesDisplay a colorbar
- Page 115 and 116:
colormapPurpose2colormapSet and get
- Page 117 and 118:
colormapExamplesThe images and colo
- Page 119 and 120:
ColorSpecPurpose2ColorSpecspecifica
- Page 121 and 122:
cometPurpose2cometTwo-dimensional c
- Page 123 and 124:
compassPurpose2compassPlot arrows e
- Page 125 and 126:
coneplotPurpose2coneplotPlot veloci
- Page 127 and 128:
coneplot• Draw the cones, setting
- Page 129 and 130:
coneplotSee Alsoisosurface, patch,
- Page 131 and 132:
contourRemarksExamplesIf you do not
- Page 133 and 134:
contour4512104010358830810258201510
- Page 135 and 136:
contour3RemarksExamplesIf you do no
- Page 137 and 138:
contourccontours using a regularly
- Page 139 and 140:
contourfExamplesCreate a filled con
- Page 141 and 142:
contoursliceExamplesThis example us
- Page 143 and 144:
contrastPurpose2contrastGrayscale c
- Page 145 and 146:
copyobjExamplesCopy a surface to a
- Page 147 and 148:
cylinderExamplesCreate a cylinder w
- Page 149 and 150:
daspectPurpose2daspectSet or query
- Page 151 and 152:
daspectSetting the data aspect rati
- Page 153 and 154:
datetickDateform Format Example12 m
- Page 155 and 156:
default4Purpose2default4MATLAB Vers
- Page 157 and 158:
dragrectPurpose2dragrectDrag rectan
- Page 159 and 160:
errorbarPurpose2errorbarPlot error
- Page 161 and 162:
errordlgPurpose2errordlgCreate and
- Page 163 and 164:
ezcontourPurpose2ezcontourEasy to u
- Page 165 and 166:
ezcontourSee Alsocontour, ezcontour
- Page 167 and 168:
ezcontourff( x,y) 31 ( - x) 2 e- x2
- Page 169 and 170:
ezmeshPurpose2ezmeshEasy to use 3-D
- Page 171 and 172:
ezmeshSee Alsoezcontour, ezcontourf
- Page 173 and 174:
ezmeshcArray multiplication, divisi
- Page 175 and 176:
ezplotPurpose2ezplotEasy to use fun
- Page 177 and 178:
ezplot3Purpose2ezplot3Easy to use 3
- Page 179 and 180:
ezpolarPurpose2ezpolarEasy to use p
- Page 181 and 182:
ezsurfArray multiplication, divisio
- Page 183 and 184:
ezsurfcPurpose2ezsurfcEasy to use c
- Page 185 and 186:
ezsurfcy/(1 + x 2 + y 2 )0.505−0.
- Page 187 and 188:
feather21.510.50−0.5−1−1.5−
- Page 189 and 190:
figurePurpose2figureCreate a figure
- Page 191 and 192:
figureProperty Name Property Descri
- Page 193 and 194:
figureProperty Name Property Descri
- Page 195 and 196:
figureProperty Name Property Descri
- Page 197 and 198:
Figure PropertiesFigureProperties2F
- Page 199 and 200:
Figure PropertiesThis close request
- Page 201 and 202:
Figure PropertiesIf a figure contai
- Page 203 and 204:
Figure Propertiescontains colors th
- Page 205 and 206:
Figure PropertiesYou can set the ro
- Page 207 and 208:
Figure PropertiesTo ensure MATLAB u
- Page 209 and 210:
Figure PropertiesProperty ValueA4A5
- Page 211 and 212:
Figure PropertiesPointerShapeHotSpo
- Page 213 and 214:
Figure PropertiesThere is also a Si
- Page 215 and 216:
Figure PropertiesResize{on} | offWi
- Page 217 and 218:
Figure Propertiesclick. See uicontr
- Page 219 and 220:
Figure PropertiesWindowButtonDownFc
- Page 221 and 222:
Figure PropertiesThe information re
- Page 223 and 224:
fillIf C is a row vector, fill gene
- Page 225 and 226:
fill3If you specify color using C,
- Page 227 and 228:
findfigsPurpose2findfigsFind visibl
- Page 229 and 230:
findobjSee Alsocopyobj, gcf, gca, g
- Page 231 and 232:
fplotExamples Plot the hyperbolic t
- Page 233 and 234:
frame2imPurpose2frame2imConvert mov
- Page 235 and 236:
gcboPurpose2gcboReturn the handle o
- Page 237 and 238:
gcoPurpose2gcoReturn handle of curr
- Page 239 and 240:
geta = get(h,'Default') returns all
- Page 241 and 242:
getframeMATLAB and that can take ad
- Page 243 and 244:
ginputPurpose2ginputInput data usin
- Page 245 and 246:
gplotExamplesTo draw half of a Buck
- Page 247 and 248:
gridPurpose2gridGrid lines for two-
- Page 249 and 250:
helpdlgPurpose2helpdlgCreate a help
- Page 251 and 252:
hiddenPurpose2hiddenRemove hidden l
- Page 253 and 254:
histExamplesGenerate a bell-curve h
- Page 255 and 256:
holdPurpose2holdHold current graph
- Page 257 and 258:
im2framePurpose2im2frameConvert ind
- Page 259 and 260:
imageimage(x,y,C,'PropertyName',Pro
- Page 261 and 262:
imageWhen you write an indexed imag
- Page 263 and 264:
imageProperty Name Property Descrip
- Page 265 and 266:
Image PropertiesImageProperties2Ima
- Page 267 and 268:
Image Propertiesproduces:0.511.522.
- Page 269 and 270:
Image Properties• xor - Draw and
- Page 271 and 272:
Image Propertiesdefine the ButtonDo
- Page 273 and 274:
imagescPurpose2imagescScale data an
- Page 275 and 276:
imagescSee Alsoimage, colorbar2-245
- Page 277 and 278:
inputdlgPurpose2inputdlgCreate inpu
- Page 279 and 280:
ishandlePurpose2ishandleDetermines
- Page 281 and 282:
isocapsPurpose2isocapsCompute isosu
- Page 283 and 284:
isonormalsPurpose2isonormalsCompute
- Page 285 and 286:
isosurfacePurpose2isosurfaceExtract
- Page 287 and 288:
isosurfaceSee Alsoisonormals, isoca
- Page 289 and 290:
legendlegend_handle = legend return
- Page 291 and 292:
lightPurpose2lightCreate a light ob
- Page 293 and 294:
lightProperty Name Property Descrip
- Page 295 and 296:
Light PropertiesLightProperties2Lig
- Page 297 and 298:
Light PropertiesWhen a handle’s v
- Page 299 and 300:
lightanglePurpose2lightangleCreate
- Page 301 and 302:
linePurpose2lineCreate line objectS
- Page 303 and 304:
lineFinally, pop the first line to
- Page 305 and 306:
lineProperty Name Property Descript
- Page 307 and 308:
lineProperty Name Property Descript
- Page 309 and 310:
Line PropertiesCreateFcnstringCallb
- Page 311 and 312:
Line PropertiesSetting HandleVisibi
- Page 313 and 314:
Line PropertiesMarker Specifierphno
- Page 315 and 316:
Line PropertiesZDatavector of coord
- Page 317 and 318:
LineSpecLine Style SpecifiersSpecif
- Page 319 and 320:
LineSpec• LineWidth - specifies t
- Page 321 and 322:
LineSpec10.80.60.40.20−0.2−0.4
- Page 323 and 324:
listdlgExampleThis example displays
- Page 325 and 326:
loglogExamplesCreate a simple loglo
- Page 327 and 328:
materialproperties of all surface a
- Page 329 and 330:
mesh, meshc, meshzwireframe with hi
- Page 331 and 332:
mesh, meshc, meshzmeshc calls mesh,
- Page 333 and 334:
movieExamples Animate the peaks fun
- Page 335 and 336:
msgboxPurpose2msgboxDisplay message
- Page 337 and 338:
newplotNextPlotreplaceWhat HappensR
- Page 339 and 340:
orientPurpose2orientSet paper orien
- Page 341 and 342:
pagedlgPurpose2pagedlgDisplay page
- Page 343 and 344:
patchPurpose2patchCreate patch grap
- Page 345 and 346:
patchColor Data InterpretationYou c
- Page 347 and 348:
patch2V2 V31.91.8V51.71.61.51.41.31
- Page 349 and 350:
patchRootFigureAxesUicontrolUimenuU
- Page 351 and 352:
patchProperty Name Property Descrip
- Page 353 and 354:
patchProperty Name Property Descrip
- Page 355 and 356:
Patch PropertiesButtonDownFcn strin
- Page 357 and 358:
Patch PropertiesThe second diagram
- Page 359 and 360:
Patch PropertiesYou can also set th
- Page 361 and 362:
Patch PropertiesFaceColor{ColorSpec
- Page 363 and 364:
Patch Properties• An n-by-1 matri
- Page 365 and 366:
Patch Propertiesprotect GUIs from c
- Page 367 and 368:
Patch PropertiesMarker Specifierd^v
- Page 369 and 370:
Patch PropertiesYou can also set th
- Page 371 and 372:
pbaspectPurpose2pbaspectSet or quer
- Page 373 and 374:
pbaspectIt is also interesting to l
- Page 375 and 376:
pbaspect0.50−0.520−2−2020.50
- Page 377 and 378:
pcolorExamplesA Hadamard matrix has
- Page 379 and 380:
peaksPurpose2peaksA sample function
- Page 381 and 382:
pieExamplesEmphasize the second sli
- Page 383 and 384:
plotPurpose2plotLinear 2-D plotSynt
- Page 385 and 386:
plotproduce this graph.3210−1−2
- Page 387 and 388:
plot1Plot of sin(Θ)0.80.60.40.2sin
- Page 389 and 390:
plot33530252015105010.510−0.5−1
- Page 391 and 392:
plotmatrix50−51050−51050−5−
- Page 393 and 394:
plotyy10.500−10 1 2 3 4 5 6 7 −
- Page 395 and 396:
polarSee Alsocart2pol, compass, Lin
- Page 397 and 398:
print, printoptpcmd and dev are pla
- Page 399 and 400:
print, printoptDevice-dcdj550-dpain
- Page 401 and 402:
print, printoptOption-rnumber-adobe
- Page 403 and 404:
print, printoptTroubleshooting MS-W
- Page 405 and 406:
print, printoptNotes on Printing In
- Page 407 and 408:
printdlgPurpose2printdlgDisplay pri
- Page 409 and 410:
questdlgExampleCreate a question di
- Page 411 and 412:
quiverExamples Plot the gradient fi
- Page 413 and 414:
quiver3Examples Plot the surface no
- Page 415 and 416:
ox• For box definition, initialRe
- Page 417 and 418:
ectanglevertical curvature can be d
- Page 419 and 420:
ectangleThis example creates an ell
- Page 421 and 422:
ectangleProperty Name Property Desc
- Page 423 and 424:
ectangle propertiesRectanglePropert
- Page 425 and 426:
ectangle propertiesEraseMode{normal
- Page 427 and 428:
ectangle propertiesHitTest{on} | of
- Page 429 and 430:
ectangle propertiesVisible{on} | of
- Page 431 and 432:
educepatchThe number of output tria
- Page 433 and 434:
educevolumePurpose2reducevolumeRedu
- Page 435 and 436:
educevolumeSee Alsoisosurface, isoc
- Page 437 and 438:
esetPurpose2resetReset graphics obj
- Page 439 and 440:
gbplotPurpose2rgbplotPlot colormapS
- Page 441 and 442:
ibbonExamplesCreate a ribbon plot o
- Page 443 and 444:
oot objectProperty Name Property De
- Page 445 and 446:
oot objectProperty Name Property De
- Page 447 and 448:
Root Propertieswhich does not resta
- Page 449 and 450:
Root PropertiesLanguagestringSystem
- Page 451 and 452:
Root PropertiesShowHiddenHandleson
- Page 453 and 454:
osePurpose2roseAngle histogramSynta
- Page 455 and 456:
otatePurpose2rotateRotate object ab
- Page 457 and 458:
otate3dPurpose2rotate3dRotate axes
- Page 459 and 460:
scatter−47.95−48−48.05−48.1
- Page 461 and 462:
scatter3Examples[x,y,z] = sphere(16
- Page 463 and 464:
semilogx, semilogyPurpose2semilogx,
- Page 465 and 466:
setPurpose2setSet object properties
- Page 467 and 468:
setparticular figure. When this fig
- Page 469 and 470:
shadingAlgorithmshading sets the Ed
- Page 471 and 472:
shrinkfacesPurpose2shrinkfacesReduc
- Page 473 and 474:
shrinkfacesAfter Shrinking210−1
- Page 475 and 476:
sliceRemarks The color drawn at eac
- Page 477 and 478:
sliceThe following picture illustra
- Page 479 and 480:
slice21.510.50−0.5−1−1.5−22
- Page 481 and 482:
spherePurpose2sphereGenerate sphere
- Page 483 and 484:
spinmapPurpose2spinmapSpin colormap
- Page 485 and 486:
stairs10.80.60.40.20−0.2−0.4−
- Page 487 and 488:
stemExamplesCreate a stem plot of 1
- Page 489 and 490:
stem3:21.510.500.50.40.30.20.1000.2
- Page 491 and 492:
stream3Purpose2stream3Compute 3-D s
- Page 493 and 494:
streamlineor[stepsize, max_number_v
- Page 495 and 496:
subplothandle, so it is an error to
- Page 497 and 498:
subvolume• A 100-element grayscal
- Page 499 and 500:
surf, surfcAlgorithmAbstractly, a p
- Page 501 and 502:
surf, surfcColor a sphere with the
- Page 503 and 504:
surf2patchAlso, because patch is a
- Page 505 and 506:
surfaceRemarksUnlike high-level are
- Page 507 and 508:
surfaceObjectHierarchyRootFigureAxe
- Page 509 and 510:
surfaceProperty Name Property Descr
- Page 511 and 512:
surfaceProperty Name Property Descr
- Page 513 and 514:
Surface PropertiesButtonDownFcn str
- Page 515 and 516:
Surface PropertiesEdgeColor{ColorSp
- Page 517 and 518:
Surface PropertiesFaceColorColorSpe
- Page 519 and 520:
Surface Propertiesgetframe, or paus
- Page 521 and 522:
Surface PropertiesMarkerSize size i
- Page 523 and 524:
Surface PropertiesVertexNormals vec
- Page 525 and 526:
surfllight source, use surfl(X',Y',
- Page 527 and 528:
surfnormPurpose2surfnormCompute and
- Page 529 and 530:
terminalPurpose2terminalSet graphic
- Page 531 and 532:
texlabelPurpose2texlabelProduce TeX
- Page 533 and 534:
textPurpose2textCreate text object
- Page 535 and 536:
textannotate the point at (pi,0) wi
- Page 537 and 538:
textProperty Name Property Descript
- Page 539 and 540:
textProperty Name Property Descript
- Page 541 and 542:
Text PropertiesCreateFcnstringCallb
- Page 543 and 544:
Text PropertiesExtentposition recta
- Page 545 and 546:
Text PropertiesWhen a handle is not
- Page 547 and 548:
Text PropertiesPosition[x,y,[z]]Loc
- Page 549 and 550:
Text PropertiesCharacterSequenceSym
- Page 551 and 552:
Text PropertiesVerticalAlignment to
- Page 553 and 554:
titlePurpose2titleAdd title to curr
- Page 555 and 556:
trimeshPurpose2trimeshTriangular me
- Page 557 and 558:
uicontextmenuPurpose2uicontextmenuC
- Page 559 and 560:
uicontextmenuWhen the user extend-c
- Page 561 and 562:
uicontextmenu Propertiesdefines a d
- Page 563 and 564:
uicontextmenu Propertieswhere vecto
- Page 565 and 566:
uicontrolString property (even thou
- Page 567 and 568:
uicontrolProperty Name Property Des
- Page 569 and 570:
uicontrolProperty Name Property Des
- Page 571 and 572:
uicontrolObjectHierarchyRootFigureA
- Page 573 and 574:
uicontrol Propertiesinterrupting ca
- Page 575 and 576:
uicontrol Properties• on - The ui
- Page 577 and 578:
uicontrol PropertiesFixedWidthFontN
- Page 579 and 580:
uicontrol Propertiesdefined, that c
- Page 581 and 582:
uicontrol Properties• Toggle butt
- Page 583 and 584:
uicontrol PropertiesFor multiple li
- Page 585 and 586:
uicontrol PropertiesSet the Value p
- Page 587 and 588:
uigetfileSee Alsouiputfile2-557
- Page 589 and 590:
uimenuYou can set and query propert
- Page 591 and 592:
uimenuExamplesThis example creates
- Page 593 and 594:
uimenu Propertiescallbacks; see the
- Page 595 and 596:
uimenu PropertiesForegroundColor Co
- Page 597 and 598:
uimenu Propertiescharacter while th
- Page 599 and 600:
uiputfilePurpose2uiputfileInteracti
- Page 601 and 602:
uiresume, uiwaitPurpose2uiresume, u
- Page 603 and 604:
uisetfontPurpose2uisetfontModify fo
- Page 605 and 606:
viewPurpose2viewViewpoint specifica
- Page 607 and 608:
viewaxes graphics object properties
- Page 609 and 610:
viewmtxT = viewmtx(az,el,phi,xc) re
- Page 611 and 612:
viewmtxTransform the cube vectors t
- Page 613 and 614:
waitforPurpose2waitforWait for cond
- Page 615 and 616:
warndlgPurpose2warndlgDisplay warni
- Page 617 and 618:
waterfallExamplesProduce a waterfal
- Page 619 and 620:
xlabel, ylabel, zlabelPurpose2xlabe
- Page 621 and 622:
xlim, ylim, zlimExamplesThis exampl
- Page 623 and 624:
zoomzoom(factor) zooms in or out by
- Page 625 and 626:
List of CommandsAList of Commands
- Page 627 and 628:
List of CommandsFunction Namesprint
- Page 629 and 630:
IndexAAcceleratorUimenu property 2-
- Page 631 and 632:
IndexLight property 2-265Line prope
- Page 633 and 634:
IndexSurface property 2-486Text pro
- Page 635 and 636:
IndexImage property 2-239Light prop
- Page 637 and 638:
Indexmesh 2-298meshc 2-298MeshStyle
- Page 639 and 640:
Indexwith non-normal EraseMode 2-23
- Page 641 and 642:
Indexcreating 2-474defining default
- Page 643 and 644:
IndexView, Axes property (obsolete)