Review for Final fall05.tst
Review for Final fall05.tst
Review for Final fall05.tst

You also want an ePaper? Increase the reach of your titles
YUMPU automatically turns print PDFs into web optimized ePapers that Google loves.
<strong>Review</strong> <strong>for</strong> <strong>Final</strong>Note that this is a compilation of our 4 test plus some problems from section 10.1. (Also note that on some problems, I willnow allow you to use a calculator.)Name___________________________________MULTIPLE CHOICE. Choose the one alternative that best completes the statement or answers the question.Solve the problem.1) A manufacturer of cellular phones has decided that an assembly line is operating satisfactorily ifless than 6% of the phones produced per day are defective. To check the quality of a day'sproduction, the company decides to randomly sample 30 phones from a day's production to test<strong>for</strong> defects. Define the population of interest to the manufacturer.A) the 6% of the phones that are defectiveB) the 30 phones sampled and testedC) all the phones produced during the day in questionD) the 30 responses: defective or not defective2) Classify the colors of automobiles on a used car lot as qualitative data or quantitative data.A) qualitative data B) quantitative data3) Classify the following random variable according to whether it is discrete or continuous.The blood pressures of a group of students the day be<strong>for</strong>e their final examA) discrete B) continuous4) What method of data collection would you use to collect data <strong>for</strong> a study where a drug was givento 97 patients and a placebo to another group of 97 patients to determine if the drug has an effecton a patient's illness?A) observational study B) designed experiment5) At a local community college, five statistics classes are randomly selected and all of the studentsfrom each class are interviewed. What sampling technique is used?A) randomB) stratifiedC) systematicD) clusterE) convenience6) A sample consists of every 20th student from a group of 3000 students. What sampling techniquewas used?A) systematicB) randomC) convenienceD) stratifiedE) cluster1)2)3)4)5)6)1
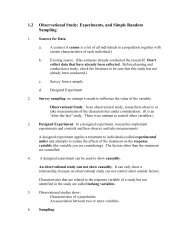
SHORT ANSWER. Write the word or phrase that best completes each statement or answers the question.7) The results of a survey about a recent judicial appointment are given in the table below.7)Response FrequencyStrongly Like 36Like 35Neutral 17Dislike 9Strongly Dislike 103Construct a relative frequency distribution.MULTIPLE CHOICE. Choose the one alternative that best completes the statement or answers the question.The bar graph shows the number of tickets sold each week by the garden club <strong>for</strong> their annual flower show.8) How many tickets were sold during week 4?A) 59 tickets B) 46 tickets C) 40 tickets D) 19 tickets8)2
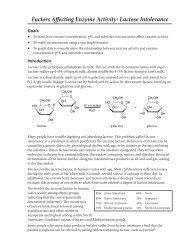
The circle graph shows the results of the student council presidential election.9) Student Council President9)Ted25%Matt32% Ann16%Ben27%400 total votesThe circle graph shows what percent of the vote each person received.Who got the fewest votes?A) Ted B) Ann C) Ben D) MattSHORT ANSWER. Write the word or phrase that best completes each statement or answers the question.Construct the specified histogram.10) In a survey, 20 voters were asked their age. The results are summarized in the frequencytable below. Construct a frequency histogram corresponding to the frequency table. (Besure to label the axes and give a title to the histogram.)10)Age ofvotersNumber ofvoters20-29 530-39 540-49 650-59 060-69 4Construct an ordered stem-and-leaf diagram <strong>for</strong> the given data.11) The midterm test scores <strong>for</strong> the seventh-period typing class are listed below. (Use the firstdigit <strong>for</strong> the stems.)11)85 77 93 91 74 65 68 97 88 59 74 83 85 72 63 793
Solve the problem.12) The numbers of runs batted in that a baseball player had in the first 12 years of his majorleague baseball career are listed below.12)102 56 25 9 9 56 165 88 122 150 91 114Find the mean and median number of runs batted in. Round the mean to the nearestwhole number.MULTIPLE CHOICE. Choose the one alternative that best completes the statement or answers the question.13) The following data represent a random sample of 15 complaints registered with the customerservice department of a store. Determine the mode complaint.13)other defective product excessive waiting timemessy store other othermessy store rude personnel messy storeother messy store messy storedefective product other messy storeA) excessive waiting time B) messy storeC) other D) no mode14) The grade point averages <strong>for</strong> 10 students are listed below. Find the range of the data.14)2.0 3.2 1.8 2.9 0.9 4.0 3.3 2.9 3.6 0.8A) 3.2 B) 2.45 C) 1.4 D) 2.8SHORT ANSWER. Write the word or phrase that best completes each statement or answers the question.Find the sample standard deviation <strong>for</strong> the group of data items (to the nearest hundredth).15) 3, 4, 5, 6, 7 15)Solve the problem.16) A student scores 56 on a geography test and 273 on a mathematics test. The geography testhas a mean of 80 and a standard deviation of 20. The mathematics test has a mean of 300and a standard deviation of 18. If the data <strong>for</strong> both tests are normally distributed, on whichtest did the student score better? (Compare z-scores.)16)MULTIPLE CHOICE. Choose the one alternative that best completes the statement or answers the question.17) The test scores of 30 students are listed below. Find Q3. (You may use a calculator.)17)31 41 45 48 52 55 56 56 63 6567 67 69 70 70 74 75 78 79 7980 81 83 85 85 87 90 92 95 99A) 83 B) 85 C) 31 D) 784
SHORT ANSWER. Write the word or phrase that best completes each statement or answers the question.18) Eleven high school teachers were asked to give the numbers of students in their classes.The sample data follows: 36, 31, 30, 31, 20, 19, 24, 34, 21, 28, 24.18)Find the five-number summary. (Do this by hand.)19) The cholesterol levels (in milligrams per deciliter) of 30 adults are listed below. Draw aboxplot that represents the data. (You may use a calculator. Be sure that the scale isconsistent and include the important numbers on your boxplot.)19)154 156 165 165 170 171 172 180 184 185189 189 190 192 195 198 198 200 200 200205 205 211 215 220 220 225 238 255 26520) The data below are the temperatures on randomly chosen days during a summer class andthe number of absences on those days. Construct a scatter diagram <strong>for</strong> the data. (You mayuse a calculator.)20)Temperature, xNumber of absences, y723857911090108889815754100158055
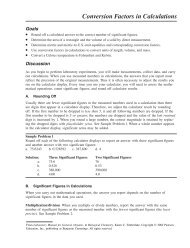
Use the scatter diagrams shown, labelled a through f to solve the problem.21)ab1412108642y1412108642y21)1 2 3 4 5 6 7x1 2 3 4 5 6 7xcd14y14y12121010886644221 2 3 4 5 6 7xe1 2 3 4 5 6 7fx14y14y12121010886644221 2 3 4 5 6 7x1 2 3 4 5 6 7xIn which scatter diagram is r = 1? (Circle the graph.)Solve the problem.22) Find the equation of the regression line <strong>for</strong> the given data. (Note: x = -0.5 sx = 3.02765, y= 1.7, sy = 5.73585, r = - 0.99491) You may use the linear regression in the calculator.(Round to three decimal places.)22)xy-511-364-61-1-13-24012-43-5-486
MULTIPLE CHOICE. Choose the one alternative that best completes the statement or answers the question.23) A county real estate appraiser wants to develop a statistical model to predict the appraised value ofhouses in a section of the county called East Meadow. One of the many variables thought to be animportant predictor of appraised value is the number of rooms in the house. Consequently, theappraiser decided to fit the simple linear regression model:23)y^ = b 0 + b 1 x,where y = appraised value of the house (in $thousands) and x = number of rooms. Using datacollected <strong>for</strong> a sample of n = 74 houses in East Meadow, the following results were obtained:y^ = 74.80 + 20.81xsb = 71.24, t = 1.05 (<strong>for</strong> testing b 0 )sb = 2.63, t = 7.49 (<strong>for</strong> testing b 1 )SSE = 60,775, MSE = 841, s = 29, r2 = .44Range of the x-values: 5 - 11Range of the y-values: 160 - 300Give a practical interpretation of the estimate of the slope of the least squares line.A) For each additional room in the house, we estimate the appraised value to increase $74,800.B) For a house with 0 rooms, we estimate the appraised value to be $74,800.C) For each additional room in the house, we estimate the appraised value to increase $20,810.D) For each additional dollar of appraised value, we estimate the number of rooms in the houseto increase by 20.81 rooms.SHORT ANSWER. Write the word or phrase that best completes each statement or answers the question.24) Given the equation of a regression line is y^ = -2.5x+ 9.8, what is the best predicted value<strong>for</strong> y given x = 6.9? (Round your answer to two decimal places.)24)MULTIPLE CHOICE. Choose the one alternative that best completes the statement or answers the question.25) Use the spinner below to answer the question. Assume that it is equally probable that the pointerwill land on any one of the five numbered spaces.( If the pointer lands on a borderline, spin again.This does not count.)25)Find the probability that the arrow will land on an odd number.A) 1 B) 3 5C) 0 D) 2 526) A fair coin is tossed two times in succession. The set of equally likely outcomes is {HH, HT, TH,TT}. Find the probability of getting the same outcome on each toss.26)A) 3 4B) 1 2C) 1 4D) 17
27) Given that P(A or B) = 1 5 , P(A) = 1 6 , and P(A and B) = 1 , find P(B).727)A) 3 35B) 107210C) 37210D) 4721028) You are dealt one card from a 52-card deck. Find the probability that you are not dealt a spade.28)A) 1 4B) 3 4C) 2 5D) 4 1329) The managers of a corporation were surveyed to determine the background that leads to asuccessful manager. Each manager was rated as being either a good, fair, or poor manager byhis/her boss. The manager's educational background was also noted. The data appear below:29)Educational BackgroundManagerRating H. S. Degree Some College College Degree Master's or Ph.D. TotalsGood 2 8 26 3 39Fair 7 11 49 20 87Poor 6 1 5 22 34Totals 15 20 80 45 160Given that a manager is only a fair manager, what is the probability that this manager has nocollege background?7A)B) 19C) 7 D) 7 160328715SHORT ANSWER. Write the word or phrase that best completes each statement or answers the question.30) Consider the discrete probability distribution to the right when answering the followingquestion. Find the probability that x equals 5.30)x 2 5 6 8P(x) 0.01 ? 0.21 0.3MULTIPLE CHOICE. Choose the one alternative that best completes the statement or answers the question.31) Calculate the mean <strong>for</strong> the discrete probability distribution shown here.31)X 3 4 8 11P(X) 0.05 0.1 0.26 0.59A) 26 B) 2.28 C) 9.12 D) 6.58
SHORT ANSWER. Write the word or phrase that best completes each statement or answers the question.32) From the probability distribution, find the mean and standard deviation <strong>for</strong> the randomvariable x, which represents the number of cars per household in a town of 1000households.32)x P(x)0 0.1251 0.4282 0.2563 0.1084 0.083MULTIPLE CHOICE. Choose the one alternative that best completes the statement or answers the question.33) A lab orders a shipment of 100 rats a week, 52 weeks a year, from a rat supplier <strong>for</strong> experimentsthat the lab conducts. Prices <strong>for</strong> each weekly shipment of rats follow the distribution below:33)Price $10.00 $12.50 $15.00Probability 0.4 0.15 0.45How much should the lab budget <strong>for</strong> next year's rat orders assuming this distribution does notchange. (Hint: find the expected price per week and multiply by 52.)A) $3,413,800.00 B) $12.63 C) $1263.00 D) $656.50SHORT ANSWER. Write the word or phrase that best completes each statement or answers the question.34) Decide whether the experiment is a binomial experiment. If it is not, explain why. You rolla die 950 times. The random variable represents the number that appears on each roll ofthe die.34)MULTIPLE CHOICE. Choose the one alternative that best completes the statement or answers the question.35) Assume that male and female births are equally likely and that the birth of any child does notaffect the probability of the gender of any other children. Find the probability of exactly eight boysin ten births.A) 0.176 B) 0.8 C) 0.044 D) 0.0835)SHORT ANSWER. Write the word or phrase that best completes each statement or answers the question.36) The probability that an individual is left-handed is 0.14. In a class of 80 students, what isthe mean and standard deviation of the number of left-handers in the class?36)37) The analytic scores on a standardized apptitude test are known to be normally distributedwith mean m = 610 and standard deviation s = 115.(a) Draw a normal curve with the parameters labeled.(b) Shade the region that represents the proportion of test takers who scored less than 725.(c) Suppose the area under the normal curve to the left of X = 725 is 0.8413. Provide twointerpretations of this result.37)9
MULTIPLE CHOICE. Choose the one alternative that best completes the statement or answers the question.A random variable X is normally distributed with m = 60. Convert the value of X to a Z-score, if the standard deviation isas given.38) X = 100; s = 1038)A) 40 B) 4 C) 10 D) 3 2SHORT ANSWER. Write the word or phrase that best completes each statement or answers the question.Solve the problem.39) Use the standard normal distribution to find P(0 < z < 2.25). (Use Table II on the insidefront cover of the text.)39)Suppose that prices of a certain model of new homes are normally distributed with a mean of $150,000. Find thepercentage of buyers who paid:40) less than $148,200 if the standard deviation is $900. Use Table II on the inside front cover 40)of the text.)41) between $150,000 and $152,400 if the standard deviation is $1200. 41)MULTIPLE CHOICE. Choose the one alternative that best completes the statement or answers the question.Use a normal probability plot to asses whether the sample data could have come from a population that is normallydistributed.42) An industrial psychologist conducted an experiment in which 40 employees that were identified as 42)"chronically tardy" by their managers were divided into two groups of size 20. Group 1participated in the new "It's Great to be Awake!" program, while Group 2 had their pay paydocked. The following data represent the number of minutes that employees in Group 1 were late<strong>for</strong> work after participating in the program.91 99 114 118 114130 115 150 105 108120 96 105 120 125126 126 127 98 120A) normally distributed B) not normally distributedSolve the problem.43) The amount of money collected by the snack bar at a large university has been recorded daily <strong>for</strong>the past five years. Records indicate that the mean daily amount collected is $4650 and thestandard deviation is $400. The distribution is skewed to the right due to several high volume days(football game days). Suppose that 100 days were randomly selected from the five years and theaverage amount collected from those days was recorded. Which of the following describes thesampling distribution of the sample mean?A) normally distributed with a mean of $4650 and a standard deviation of $40B) normally distributed with a mean of $465 and a standard deviation of $40C) normally distributed with a mean of $4650 and a standard deviation of $400D) skewed to the right with a mean of $4650 and a standard deviation of $40043)10
44) The average score of all golfers <strong>for</strong> a particular course has a mean of 79 and a standard deviation of3.5. Suppose 49 golfers played the course today. Find the probability that the average score of the49 golfers exceeded 80.A) .1293 B) .3707 C) .4772 D) .022844)SHORT ANSWER. Write the word or phrase that best completes each statement or answers the question.45) In a sample of 10 randomly selected women, it was found that their mean height was 63.4inches. From previous studies, it is assumed that the standard deviation, s, is 2.4.Construct the 95% confidence interval <strong>for</strong> the population mean.45)MULTIPLE CHOICE. Choose the one alternative that best completes the statement or answers the question.46) A nurse at a local hospital is interested in estimating the birth weight of infants. How large asample must she select if she desires to be 90% confident that the true mean is within 4 ounces ofthe sample mean? The standard deviation of the birth weights is known to be 6 ounces.A) 2 B) 3 C) 7 D) 647) Find the critical t-value used <strong>for</strong> a confidnece interval with a confidence level of 99% (c = 0.99) andn = 10.A) 1.833 B) 2.262 C) 3.250 D) 2.282146)47)SHORT ANSWER. Write the word or phrase that best completes each statement or answers the question.48) Construct a 90% confidence interval <strong>for</strong> the population mean, m. Assume the populationhas a normal distribution. A sample of 15 randomly selected students has a grade pointaverage of 2.86 with a standard deviation of 0.78. (Round to two decimal places.)48)MULTIPLE CHOICE. Choose the one alternative that best completes the statement or answers the question.49) A survey of 100 fatal accidents showed that 43 were alcohol related. Find a point estimate <strong>for</strong> p, thepopulation proportion of accidents that were alcohol related.A) 0.43 B) 0.57 C) 0.754 D) 0.301Find the indicated confidence interval.50) In a sample of 1788 patients who underwent a certain type of surgery, 15% experiencedcomplications. Find a 99% confidence interval <strong>for</strong> the proportion of all those undergoing thissurgery who experience complications. (Use the z value in table III.)A) From 0.1364 to 0.1636 B) From 0.1196 to 0.1804C) From 0.1416 to 0.1584 D) From 0.1282 to 0.171849)50)SHORT ANSWER. Write the word or phrase that best completes each statement or answers the question.Solve the problem.51) A pollster wishes to estimate the proportion of United States voters who favor capitalpunishment. How large a sample is needed in order to be 90% confident that the sampleproportion will not differ from the true proportion by more than 2%?51)11
MULTIPLE CHOICE. Choose the one alternative that best completes the statement or answers the question.Classify the conclusion of the hypothesis test as a Type I error, a Type II error, or a correct decision.52) In 1990, the average duration of long-distance telephone calls originating in one town was9.4 minutes. A long-distance telephone company wants to per<strong>for</strong>m a hypothesis test to determinewhether the average duration of long-distance phone calls has changed from the 1990 mean of9.4 minutes. The hypotheses are:H 0: m = 9.4 minutesH 1: m ≠ 9.4 minutesSuppose that the results of the sampling lead to nonrejection of the null hypothesis. Classify thatconclusion as a Type I error, a Type II error, or a correct decision, if in fact the mean duration oflong-distance phone calls has changed from the 1990 mean of 9.4 minutes.A) Correct decision B) Type II error C) Type I error52)SHORT ANSWER. Write the word or phrase that best completes each statement or answers the question.Per<strong>for</strong>m a hypothesis test <strong>for</strong> the population mean. Assume that preliminary data analyses indicate that it is reasonable toapply the z-test.53) The Maine Department of Natural Resources reported that the mean weight of lobsters 53)trapped in the state is 1.7 pounds. Carl Lewis is a lobster trapper off the coast of Maine.Carl suspects that this figure is too high so he records the weights of a random sample of44 lobsters that he trapped. The mean weight of the lobsters in the sample was1.5 pounds. Using a 1% level of significance, per<strong>for</strong>m a hypothesis test to determinewhether the population mean is lower than 1.7 pounds. Assume that the populationstandard deviation is 0.6 pounds. (Be sure to state your answer in words related to thelobsters.)Use the given in<strong>for</strong>mation to find the P-value.54) The test statistic in a left-tailed test is z = -1.83. (Use table II.) 54)Test the given claim using the classical method of hypothesis testing. Assume that the sample has been randomlyselected from a population with a normal distribution.55) Use a significance level of a = 0.01 to test the claim that m > 2.85. The sample data consists 55)of 9 scores <strong>for</strong> which x = 3.1 and s = 0.52. (Ho: m = 2.85 H1: m > 2.85)Preliminary data analyses indicate that it is reasonable to use a t-test to carry out the specified hypothesis test. Per<strong>for</strong>mthe t-test using the classical approach.56) A large software company gives job applicants a test of programming ability and the mean 56)<strong>for</strong> that test has been 160 in the past. Twenty-five job applicants are randomly selectedfrom one large university and they produce a mean score and standard deviation of 183and 12, respectively. Use a 0.05 level of significance to test the claim that this sample comesfrom a population with a mean score greater than 160.Identify the null hypothesis, alternative hypothesis, test statistic, P-value, conclusion about the null hypothesis, and finalconclusion that addresses the original claim.57) An article in a journal reports that 34% of American fathers take no responsibility <strong>for</strong> child 57)care. A researcher claims that the figure is higher <strong>for</strong> fathers in the town of Littleton. Arandom sample of 234 fathers from Littleton yielded 96 who did not help with child care.Test the researcher's claim at the 0.05 significance level. (You may use a calculator. Besure to check the sample size requirements.)12
Solve the problem.58) According to a national statistics bureau, in 2000, 3.7% of males living in the Southwestwere retired exterminators. A researcher believes that the percentage has increased sincethen. She randomly selects 250 males in the Southwest and finds that 4 of them are retiredexterminators. Test this researcher's claim at the a = 0.1 level of significance. (You may usea calculator. Show the command you used in the calculator. Be sure to test the samplesize requirements!!)58)MULTIPLE CHOICE. Choose the one alternative that best completes the statement or answers the question.59) Classify the two given samples as independent or dependent.59)Sample 1: Pre-training weights of 17 peopleSample 2: Post-training weights of 17 peopleA) independent B) dependent60) Classify the two given samples as independent or dependent.60)Sample 1: The scores of 13 students who took the ACTSample 2: The scores of 13 different students who took the SATA) dependent B) independentSHORT ANSWER. Write the word or phrase that best completes each statement or answers the question.61) Nine students took the SAT. Their scores are listed below. Later on, they took a testpreparation course and retook the SAT. Their new scores are listed below. Test the claimthat the test preparation had no effect on their scores. Use a = 0.05. Assume that thedistribution is normally distributed.Student 1 2 3 4 5 6 7 8 9Scores be<strong>for</strong>e course 720 860 850 880 860 710 850 1200 950Scores after course 740 860 840 920 890 720 840 1240 97061)MULTIPLE CHOICE. Choose the one alternative that best completes the statement or answers the question.62) Nine students took the SAT. Their scores are listed below. Later on, they took a test preparationcourse and retook the SAT. Their new scores are listed below. Construct a 95% confidence interval<strong>for</strong> m d . Assume that the distribution is normally distributed.62)Student 1 2 3 4 5 6 7 8 9Scores be<strong>for</strong>e course 720 860 850 880 860 710 850 1200 950Scores after course 740 860 840 920 890 720 840 1240 970A) (-20.341, 4.852) B) (1.651, 30.590) C) (-30.503, -0.617) D) (-10.321, 15.436)13
Answer KeyTestname: REVIEW FOR FINAL FALL051) C2) A3) B4) B5) D6) A7)Response Frequency Relative FrequencyStrongly Like 36 0.18Like 35 0.175Neutral 17 0.085Dislike 9 0.045Strongly Dislike 103 0.5158) A9) B10)11)5 96 3 5 87 2 4 4 7 98 3 5 5 89 1 3 712) mean: 82; median: 89.5; the median13) B14) A15) 1.5816) The student scored better on the geography test.17) A18) 19, 21, 28, 31, 3614
Answer KeyTestname: REVIEW FOR FINAL FALL0519)20)21) b22) y^ = -1.885x + 0.75823) C24) -7.4525) B26) B27) C28) B29) C30) 0.4831) C32) m = 1.596; s = 1.09833) D34) Not a binomial experiment. There are more than two outcomes.35) C36) mean: 11.2; standard deviation: 3.1035463615
Answer KeyTestname: REVIEW FOR FINAL FALL0537) (a), (b)(c) The two interpretations are: (1) the proportion of test takers who scored less than 725 is 0.8413 and (2) theprobability that a randomly selected test taker has a score less than 725 is 0.8413.38) B39) 0.487840) 2.5%41) 47.5%42) A43) A44) D45) (61.9, 64.9)46) C47) C48) (2.51, 3.21)49) A50) D51) 169252) B53) H : 0m = 1.7 poundsH : am < 1.7 poundsTest statistic: z = -2.21.Critical value z = -2.33. Fail to reject H0: m = 1.7 pounds. There is not sufficient evidence to support the claim that themean is lower than 1.7 pounds.54) 0.033655) Test statistic: t = 1.44. Critical value: t = 2.896. Fail to reject H0: m = 2.85. There is not sufficient evidence to support theclaim that the mean is greater than 2.85.56) H 0: m = 160. H a: m > 160.Test statistic: t = 9.583. Critical value: t = 1.711. Reject the null hypothesis. There is sufficient evidence to support theclaim that the mean is greater than 160.57) H0: p = 0.34. H1: p > 0.34. Test statistic: z = 2.27. P-value: p = 0.0116.Critical value: z = 1.645. Reject null hypothesis. There is sufficient evidence to support the researcher's claim that theproportion <strong>for</strong> fathers in Littleton is higher than 34%.16
Answer KeyTestname: REVIEW FOR FINAL FALL0558) H0: p = 0.037 and H1: p > 0.037Since 250(0.037)(1 - 0.037) = 8.91 < 10, we calculate the P-value:P(X ≥ 4) = 1 - P(X < 4) = 1 - P(X ≤ 3) = 1 - 0.016 = 0.984.Since 0.984 > 0.1, we do not reject H0.There is not significant evidence to conclude that the percentage has increased.59) B60) B61) claim:H0: m d = 0 H1: m d ≠0 critical values t0 = ±2.306 (degrees of freedom = 8); standardized test statistic t ‘ 2.401;reject H0; There is sufficient evidence to reject the claim.62) C17