Qualitative assessment of flour with a depth consistency meter and ...
Qualitative assessment of flour with a depth consistency meter and ...
Qualitative assessment of flour with a depth consistency meter and ...

Create successful ePaper yourself
Turn your PDF publications into a flip-book with our unique Google optimized e-Paper software.
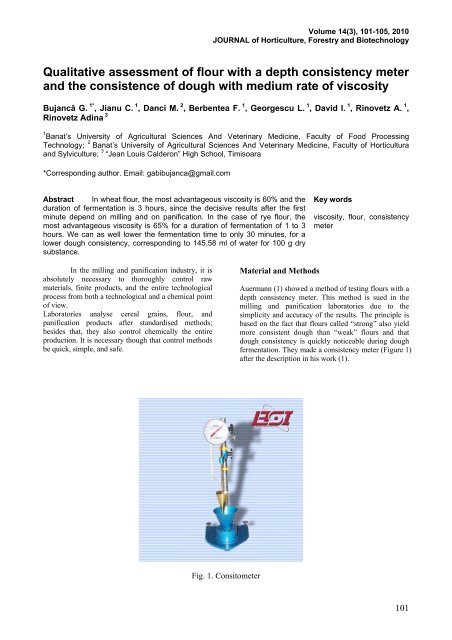
Volume 14(3), 101-105, 2010JOURNAL <strong>of</strong> Horticulture, Forestry <strong>and</strong> Biotechnology<strong>Qualitative</strong> <strong>assessment</strong> <strong>of</strong> <strong>flour</strong> <strong>with</strong> a <strong>depth</strong> <strong>consistency</strong> <strong>meter</strong><strong>and</strong> the consistence <strong>of</strong> dough <strong>with</strong> medium rate <strong>of</strong> viscosityBujancă G. 1* , Jianu C. 1 , Danci M. 2 , Berbentea F. 1 , Georgescu L. 1 , David I. 1 , Rinovetz A. 1 ,Rinovetz Adina 31 Banat’s University <strong>of</strong> Agricultural Sciences And Veterinary Medicine, Faculty <strong>of</strong> Food ProcessingTechnology; 2 Banat’s University <strong>of</strong> Agricultural Sciences And Veterinary Medicine, Faculty <strong>of</strong> Horticultura<strong>and</strong> Sylviculture; 3 “Jean Louis Calderon” High School, Timisoara*Corresponding author. Email: gabibujanca@gmail.comAbstract In wheat <strong>flour</strong>, the most advantageous viscosity is 60% <strong>and</strong> theduration <strong>of</strong> fermentation is 3 hours, since the decisive results after the firstminute depend on milling <strong>and</strong> on panification. In the case <strong>of</strong> rye <strong>flour</strong>, themost advantageous viscosity is 65% for a duration <strong>of</strong> fermentation <strong>of</strong> 1 to 3hours. We can as well lower the fermentation time to only 30 minutes, for alower dough <strong>consistency</strong>, corresponding to 145.58 ml <strong>of</strong> water for 100 g drysubstance.Key wordsviscosity, <strong>flour</strong>, <strong>consistency</strong><strong>meter</strong>In the milling <strong>and</strong> panification industry, it isabsolutely necessary to thoroughly control rawmaterials, finite products, <strong>and</strong> the entire technologicalprocess from both a technological <strong>and</strong> a chemical point<strong>of</strong> view.Laboratories analyse cereal grains, <strong>flour</strong>, <strong>and</strong>panification products after st<strong>and</strong>ardised methods;besides that, they also control chemically the entireproduction. It is necessary though that control methodsbe quick, simple, <strong>and</strong> safe.Material <strong>and</strong> MethodsAuermann (1) showed a method <strong>of</strong> testing <strong>flour</strong>s <strong>with</strong> a<strong>depth</strong> <strong>consistency</strong> <strong>meter</strong>. This method is sued in themilling <strong>and</strong> panification laboratories due to thesimplicity <strong>and</strong> accuracy <strong>of</strong> the results. The principle isbased on the fact that <strong>flour</strong>s called “strong” also yieldmore consistent dough than “weak” <strong>flour</strong>s <strong>and</strong> thatdough <strong>consistency</strong> is quickly noticeable during doughfermentation. They made a <strong>consistency</strong> <strong>meter</strong> (Figure 1)after the description in his work (1).Fig. 1. Consito<strong>meter</strong>101
In principle, the apparatus is made up <strong>of</strong> atempered metal cylinder, having a certain weight <strong>and</strong>fixed on an axis immersed into dough in a recipient.The <strong>depth</strong> <strong>of</strong> the immersion is transmitted by anindicator fixed on a suspension device <strong>of</strong> the cylinderon a circular frame <strong>and</strong> is expressed in divisions from 0to 600.Auermann chose for weak <strong>flour</strong> testing wheat<strong>flour</strong> <strong>and</strong> rye <strong>flour</strong> dough; for wheat <strong>flour</strong>, he used alighter cylinder (35 g) <strong>and</strong> for rye <strong>flour</strong> a heavier one(110 g). In the apparatus, the cylinder weight is low sothat it can be sued for both normal wheat <strong>and</strong> ryedough <strong>and</strong> for rye fermentation (2, 3).To measure dough <strong>consistency</strong>, the <strong>flour</strong> to betested is kneaded <strong>with</strong> distilled water making ahomogeneous dough at laboratory temperature; thedough is let to ferment in a thermostat at 30 0 C forwheat <strong>flour</strong> <strong>and</strong> at 35 0 C for rye <strong>flour</strong> (2).The amount <strong>of</strong> <strong>flour</strong> was chosen so as thedough fills a glass recipient <strong>with</strong> thick walls <strong>and</strong> <strong>with</strong> adia<strong>meter</strong> <strong>of</strong> 6 cm <strong>and</strong> a height <strong>of</strong> 7 cm. To prevent thedough surface from drying in the thermostat, it was setin a capsule or in a crystallisator adding a small amount<strong>of</strong> water.Together <strong>with</strong> the dough, we introduce intothe thermostat the cylinder <strong>of</strong> the <strong>consistency</strong> <strong>meter</strong>which is unscrewed for its temperature to equal that <strong>of</strong>the dough. After fermentation, the dough is tested <strong>with</strong>the cylinder brought to the dough temperature.Results <strong>and</strong> DiscussionsThe testing conditions have been developedseparately for the wheat <strong>flour</strong> dough <strong>and</strong> separately forthe rye <strong>flour</strong> dough.a) Wheat <strong>flour</strong>For testing, we have chosen the T 650 type <strong>of</strong><strong>flour</strong>, preparing a dough from 130 g <strong>of</strong> <strong>flour</strong> 14%moisture <strong>with</strong> water addition corresponding to aviscosity <strong>of</strong> 60%. If the <strong>flour</strong> has a higher or a smallermoisture than 14%, then the amount <strong>of</strong> water should berecalculated depending on <strong>flour</strong> moisture so that for100 g <strong>of</strong> dry substance made <strong>of</strong> <strong>flour</strong> we add 86 ml <strong>of</strong>water. We can use the formula:1.3 x <strong>flour</strong> dry substance x 0.86 – 1.3 x <strong>flour</strong>moistureor:1.118 x <strong>flour</strong> dry substance – 1.3 x <strong>flour</strong>moisture.We tried different dough consistencies <strong>of</strong>dough <strong>with</strong> viscosity 55%, 60%, <strong>and</strong> 63%, since meanviscosity <strong>of</strong> panification <strong>flour</strong> varies around 60%. Moreconsistent dough proved improper because <strong>of</strong> the small<strong>depth</strong> <strong>of</strong> the cylinder <strong>and</strong> <strong>of</strong> the difficulties <strong>of</strong>preparation; likewise, results were not satisfactory inless consistent dough <strong>with</strong> a viscosity <strong>of</strong> about 70%because <strong>of</strong> the difficulty <strong>of</strong> preparation.Less consistent dough should be tested <strong>with</strong> alighter cylinder adapted to the task. The immersion<strong>depth</strong> <strong>of</strong> the body was measured for each minute for 5minutes <strong>of</strong> which the most decisive was the <strong>depth</strong>measured after the first minute. For testing, we used 4high quality wheat samples milled in an experimentalmill <strong>of</strong> the 650 type. In these samples, we alsomeasured for comparison milling qualities (toughness,moisture) <strong>and</strong> panification qualities. Results are shownin Table 1.Umiditate%The immersion <strong>depth</strong> <strong>and</strong> milling qualities (toughness, moisture) <strong>and</strong> panification qualitiesDuritate12,43 Semidură12,33 Dură12,60 SemidurăFineţeafăiniiFoartefinăSemigrişatăSemigrişatăGluten umedraportat lasubstanţa uscată35,4036,9635,4712,51 Moale Fină 30,86Caracteristicileglutenului:elasticitatea,alungirea sicapacitatea deumflare in cmşi ml4101648205101631112R<strong>and</strong>amentulînmlVâscozitatea%361 67,3347 65,7338 64,3350 59,1Produse depanifiicaţie,culoare,suprafaţă,înălţimea, mmBrun închis,netedă 58Brun închis,netedă 53Brun închis,netedă 52Brun deschiscrăpată puternic50Table 1Nr. deordine1234Table 2 shows the values read <strong>with</strong> the<strong>consistency</strong> <strong>meter</strong> after dough fermentation for 1.2 to 3hours for a duration <strong>of</strong> 5 minutes. Fermentation wascontrolled successively hour after hour, to see thevariation <strong>of</strong> the dough <strong>consistency</strong>.102
Proba nr.Vascozitatea %1 2 31 ore1 2 3Min.Values read <strong>with</strong> the <strong>consistency</strong> <strong>meter</strong>Values read <strong>with</strong> the <strong>consistency</strong> <strong>meter</strong>4 5 1 2 3 4 5 1 2 32 ore3 ore4 5 1 2 3 4 5 1 2 3Min.Min.Table 24 54 555113118123132141-----1471551621651712601702252502802952202452602702782202622953203326321332035037439520426730834237218824828531233855179203218227250-----1701831901931957602252552832883002152282352452522322782852902956322828331734035828232034536838827832035537539555190223235243250-----1902002052082135602002302522652801902302602702802402973273483636328835038039540032236539241243028233536039044055150170183198207-----23325026227228036028831534036036022028030532533529234037039341063350440500--397500700--405500635--After the testing, the dough was left in therecipient in the thermostat. The wheat was semi-hard tohard; we used mild wheat in a single sample. From thepoint <strong>of</strong> view <strong>of</strong> the panification industry, we used high<strong>and</strong> medium quality <strong>flour</strong>s. The features <strong>of</strong> thedifferent assortments <strong>of</strong> <strong>flour</strong> are better shown in thediagramme than in the table. Figure 1 shows how <strong>flour</strong>nr. 2 changes the dough <strong>consistency</strong> during 1-3 hours.Fig. 1. Changes <strong>of</strong> <strong>consistency</strong> during 1-3 hoursFig. 1 shows how <strong>flour</strong> nr. 2 changes thedough <strong>consistency</strong> during 1-3 hoursFigure 2 compares dough <strong>consistency</strong> in allfour samples after 3 hours, which proved to be themost advantageous for the <strong>assessment</strong> <strong>of</strong> wheat doughquality since it corresponds to the results <strong>of</strong> milling <strong>and</strong>panification trials.Higher slope curves show a lower <strong>consistency</strong><strong>of</strong> the dough <strong>and</strong> a lower quality <strong>of</strong> the <strong>flour</strong>.103
Fig. 2. Dough <strong>consistency</strong>b) Rye <strong>flour</strong>We have chosen T 930 <strong>flour</strong>s <strong>of</strong> mediumquality as current consumption <strong>flour</strong>s. We tested<strong>consistency</strong> for a viscosity <strong>of</strong> 60% <strong>and</strong> 65% fordifferent weights <strong>of</strong> the immersion body whose weightwas increased by weight addition. Since for theseviscosities the values were lower <strong>and</strong> on the averagerelatively little differentiated (up to a viscosity <strong>of</strong> 65%<strong>and</strong> a cylinder weight <strong>of</strong> 305 g) we also tried dough<strong>with</strong> lower <strong>consistency</strong> after 30 minutes <strong>of</strong>fermentation. For testing, we took 80 g <strong>of</strong> <strong>flour</strong> 15%moist to which we added 87 ml <strong>of</strong> water. The doughwas prepared <strong>with</strong> distilled water al laboratorytemperature.As in the case <strong>of</strong> wheat <strong>flour</strong>, the amount <strong>of</strong>water should be recalculated depending on moisture<strong>and</strong> at a given ratio. We can also use the formula:1.66 x <strong>flour</strong> dry substance x 1.456 – 0.8 x<strong>flour</strong> moistureor:1.66 <strong>flour</strong> dry substance – 0.8 x <strong>flour</strong> moisture.Results are shown in Table 3.Greutatea(g)105205305205305Values read <strong>with</strong> the <strong>consistency</strong> <strong>meter</strong> after fermentationValues read <strong>with</strong> the <strong>consistency</strong> <strong>meter</strong> after fermentation1 ore 2 ore 3 ore1 2 3 4 5 1 2 3 4 5 1 2 3minuteminuteminute82 88 90 93 96 82 90 91 103 107 - - -- - - - - 113 120 130 133 135 110 120 132- - - - - - - - - - 130 150 170110-120-130-140-150-117160137180153190170205182220125180135200160215Table 34 5-140195180230-148215190240Fig. 3. Graphic representation <strong>of</strong> the immersion104
Graphic representation <strong>of</strong> the immersion isshown in Figure 3.For T 650 wheat <strong>flour</strong>, the most advantageousviscosity is 60% <strong>and</strong> the duration <strong>of</strong> fermentation is 3hours, since the decisive results after the first minutecorrespond to milling <strong>and</strong> panification trials. Viscosity<strong>of</strong> 60% for current wheat <strong>flour</strong>s best correspond fromboth practical <strong>and</strong> experimental points <strong>of</strong> view sincethe values are in the middle <strong>of</strong> the scale 200 – 250.Super quality wheat <strong>flour</strong>s are below 200, while weak<strong>and</strong> very weak <strong>flour</strong>s are above 300. From theimmersion <strong>depth</strong> values read every hour we can deducea lot <strong>of</strong> data concerning the behaviour <strong>of</strong> <strong>flour</strong>s inpanification.The features <strong>of</strong> dough can be better seengraphically. The abrupt shape <strong>of</strong> the curves shows ararefied, low quality dough. Figure 1 shows in sample2 changes during fermentation which speak <strong>of</strong> dough<strong>consistency</strong>. This could be similar for other samples;the curves 1, 2, <strong>and</strong> 3 hours after fermentation showingclearly the way dough behaves during panification <strong>and</strong>the duration <strong>of</strong> fermentation.This trial can also supply information on theimpact <strong>of</strong> adding ingredients <strong>and</strong> on <strong>flour</strong> change aswell as on the ideal <strong>consistency</strong> <strong>of</strong> dough which leadsto an improvement <strong>of</strong> the product quality. Doughbehaviour is a result <strong>of</strong> multiple factors; both thefeatures <strong>of</strong> the complex <strong>of</strong> protease proteins <strong>and</strong> <strong>of</strong> thecarbon-amylase hydrates.Figures shown in Tables 3 <strong>and</strong> 4, <strong>and</strong> inFigure 3 show that for rye <strong>flour</strong>s <strong>of</strong> the T 930 type themost advantageous viscosity <strong>of</strong> 65% for a duration <strong>of</strong>fermentation <strong>of</strong> 1 to 3 hours <strong>and</strong> for a body weight <strong>of</strong>305 g. We can as well carry out the trial in a shorterperiod <strong>of</strong> time <strong>of</strong> only ½ hours, for a lower <strong>consistency</strong><strong>of</strong> the dough corresponding to 145.58 ml <strong>of</strong> water for100 g <strong>of</strong> dry substance.ProbaHumidity%Values read <strong>with</strong> the <strong>consistency</strong> <strong>meter</strong> for rye <strong>flour</strong>Maltose ViscosityAcidity%%Numerele indicate de consistometru dupaminutul1 2 3 4 5312 362 385 400 419330 402 460 498 512375 480 480 500 514Tabel 412313,3413,0111,228,6 2,0 71,63,9 1,9 69,89,5 2,02 68,8We compared the results supplied by the<strong>consistency</strong> <strong>meter</strong> <strong>with</strong> those supplied by thefarinograph <strong>and</strong> they showed that these values wereconcordant.Taking into account the simplicity, the precision <strong>of</strong> theresults <strong>and</strong> the possibility <strong>of</strong> applying a method asmuch as possible both in mills <strong>and</strong> in bakeries, werecommend this trial to be introduced in productioncontrol laboratories.ConclusionsMore consistent dough proved improper because <strong>of</strong> thesmall <strong>depth</strong> <strong>of</strong> immersion <strong>of</strong> the cylinder <strong>and</strong> <strong>of</strong> thedifficulties <strong>of</strong> preparation.Less consistent dough (70% viscosity) neither provedsatisfactory because <strong>of</strong> the difficulties <strong>of</strong> preparation.In all these analyses should be recalculated the amount<strong>of</strong> water for both rye <strong>flour</strong> moisture (15%) <strong>and</strong> wheat<strong>flour</strong> moisture (14%).References1.Auermann, M. N., “Practice <strong>of</strong> Flour Milling”, TheNorthen Publishing Co LTD Liverpol, Engl<strong>and</strong> 1986.2.Bordei, D., “Influenţa proceselor tehnologice asupracalităţii produselor alimenatre” Ed. Tehnică, Bucureşti,1984.3.Popescu, S., “Biochimia cerealelor, făinurilor şiconservarea lor”, Ed. Didactică şi Pedagogică,Bucureşti, 1984.105