PROFILE - Moreton Bay Regional Council
PROFILE - Moreton Bay Regional Council
PROFILE - Moreton Bay Regional Council
- No tags were found...

You also want an ePaper? Increase the reach of your titles
YUMPU automatically turns print PDFs into web optimized ePapers that Google loves.
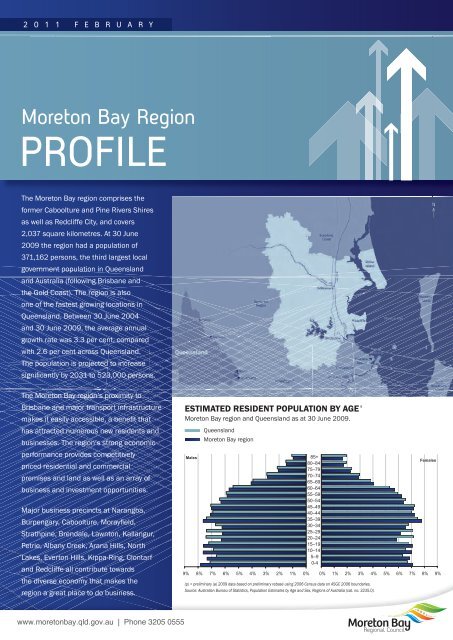
PopulationThe population of <strong>Moreton</strong> <strong>Bay</strong> region at 30 June2009 was 371,162 persons. This was 8.4 per cent ofthe total population of Queensland. Between 30 June2004 and 30 June 2009, the average annual growthrate in <strong>Moreton</strong> <strong>Bay</strong> region was 3.3 per cent, whichwas higher than the 2.6 per cent for Queensland.Table 1 ESTIMATED RESIDENT POPULATION a ,<strong>Moreton</strong> <strong>Bay</strong> region by district and Queensland, 2004 to 2009.RegionEstimated resident population2004 2008 2009 ppersonsCaboolture district 126,999 145,847 151,293Pine Rivers district 136,956 156,983 163,513Redcliffe district 51,550 55,072 56,356<strong>Moreton</strong> <strong>Bay</strong> region 315,505 357,902 371,162Queensland 3,900,910 4,308,570 4,425,103<strong>Moreton</strong> <strong>Bay</strong> region as a percentage of Queensland8.1 % 8.3 % 8.4 %RegionChange2003 to 2008 2007 to 2008 pper cent number per centCaboolture district 3.6 24,294 3.7Pine Rivers district 3.6 26,557 4.2Redcliffe district 1.8 4,806 2.3<strong>Moreton</strong> <strong>Bay</strong> region 3.3 55,657 3.7Queensland 2.6 524,193 2.7(p) = preliminary. (a) 2009 data based on preliminary rebase using 2006 Census data on ASGC (Australian StandardGeographical Classifi cation) 2006 boundaries. (b) Average annual growth rate.Source: Australian Bureau of Statistics, <strong>Regional</strong> Population Growth, Australia (cat. no. 3218.0).Compared with Queensland, the<strong>Moreton</strong> <strong>Bay</strong> region has a higher proportionof children and lower proportions in theyoung adult age groups . The proportionswere similar to those of Queensland forthe age groups 35 years and over .FUTURE TRENDSThe current regional population projections were releasedin 2008. The medium-series projections indicate that theresident population of <strong>Moreton</strong> <strong>Bay</strong> region is projected toincrease by 57.1 per cent between the years 2006 and2031, from 332,900 persons to 523,000 persons. Thelow series projections indicate a 42.1 per cent increase to473,100 persons, and the high series projections indicatea 76.0 per cent increase to 585,900 persons.Figure 2 ACTUAL AND PROJECTED POPULATION<strong>Moreton</strong> <strong>Bay</strong> region a , 30 June 1991 to 2031.Persons Actual Low seriesMedium series High series600,000500,000400,000300,000200,000100,00001991 1996 2001 2006 2011 2016 2021 2026 2031Year(a) Based on ASGC 2008 boundaries.Source: Australian Bureau of Statistics, <strong>Regional</strong> Population Growth, Australia (cat. no. 3218.0);Department of Infrastructure and Planning, Queensland’s Future Population (2008 edition).2
IncomeMEAN TAXABLE INCOMEThe Australian Tax Office collects information about taxable income levels, as reportedon income tax returns. In <strong>Moreton</strong> <strong>Bay</strong> region in 2007/08, the Pine Rivers districtrecorded the highest mean taxable income ($51,658); followed by Redcliffe district($46,325) and Caboolture district ($43,973). Queensland recorded a mean taxableincome of $50,593 in 2007/08.Table 6 TAXABLE PERSONS, TAXABLE INCOMEAND MEAN TAXABLE INCOME OF TAXPAYERS a ,<strong>Moreton</strong> <strong>Bay</strong> region by district and Queensland, 2007–08.RegionTaxablepersonsTaxableincomeMean taxableincomenumber $m $Caboolture district 61,149 2,689 43,973Pine Rivers district 79,358 4,099 51,658Redcliffe district 24,215 1,122 46,325Queensland 1,989,535 100,656 50,593(a) Data derived from postcode level data that has been converted using population basedconcordance. The concordance process allocates a percentage weighting from one region typeto another, therefore true counts within concordance regions may differ. Residential postcodesare as stated on return forms and may not be valid residential postcodes, hence caution shouldbe taken with small area data as this may be affected by both this and confi dentialised data.Source: Australian Taxation Offi ce, Unpublished data.Over the three years to 2007/08, Pine Rivers districthad the largest average annual growth of 6 .7 per cent in<strong>Moreton</strong> <strong>Bay</strong> region . Mean taxable income increased at anaverage annual rate of 6 .6 per cent in Redcliffe districtand 6.4 per cent in Caboolture district . This was above the6.3 per cent average for Queensland .PERSONAL INCOMEThe ABS compiles estimates of personal incomeusing aggregated individual income tax datafrom the Australian Taxation Office. In 2007/08,wage and salary was the largest income source($40,965) in <strong>Moreton</strong> <strong>Bay</strong> region, followed bysuperannuation and annuity ($21,115) andown unincorporated business ($17,716).Over the three years to 2007/08, income frominvestments had the largest average annual growth of10 per cent in <strong>Moreton</strong> <strong>Bay</strong> region. Income from wagesand salaries increased by 5.2 percent and income fromsuperannuation and annuities increased 5.0 per cent.Table 7 MEAN TAXABLE INCOME OF TAXPAYERS a ,<strong>Moreton</strong> <strong>Bay</strong> region by district and Queensland, 2004/05 to 2007/08.AverageRegion 2004/05 2005/06 2006/07 2007/08annual change2004/05 to2007/08$ %Caboolture district 36,518 38,284 41,854 43,973 6.4Pine Rivers district 42,486 44,806 49,362 51,658 6.7Redcliffe district 38,264 40,143 44,559 46,325 6.6Queensland 42,094 44,308 48,872 50,593 6.3(a) Data derived from postcode level data that has been converted using population based concordance. The concordanceprocess allocates a percentage weighting from one region type to another, therefore true counts within concordance regions maydiffer. Residential postcodes are as stated on return forms and may not be valid residential postcodes, hence caution should betaken with small area data as this may be affected by both this and confi dentialised data.Source: Australian Taxation Offi ce, Unpublished data.Table 8 AVERAGE INCOME FOR EACH PERSONAL INCOME SOURCE ab , <strong>Moreton</strong> <strong>Bay</strong> region, 2003/04 to 2007/08.Sources 2003/04 2004/05 2005/06 2006/07 2007/08Average annual change2003/04 to 2007/08 c$ %Wage and salary 33,390 34,877 36,782 38,837 40,965 5.2Own unincorporated business 15,450 15,278 15,669 16,994 17,716 3.5Investment 3,467 3,741 4,521 5,228 5,074 10.0Superannuation and annuities 17,378 18,274 19,814 21,266 21,115 5.0Other 2,334 2,339 2,710 2,862 2,920 5.7(a) Other income excludes government pensions, benefi ts or allowances. It includes selected sources of other income reported on the individual income tax return that were not allocated to one of the other categories. (b) Total averageincome of all sources available due to unavailable total population. (c) Average annual growth rate.Source: Australian Bureau of Statistics, Estimates of Personal Income for Small Areas, Time Series, 2003/04 to 2007/08 (cat. no. 6524.0.55.002).6
IncomeTable 9 PERSONAL INCOME SOURCE AS A PERCENTAGEOF TOTAL INCOME ab , <strong>Moreton</strong> <strong>Bay</strong> region, 2003/04 to 2007/08.Sources 2003/04 2004/05 2005/06 2006/07 2007/08%Wage and salary 84.2 84.2 83.8 83.1 84.5Own unincorporated 7.2 6.7 6.3 6.1 6.0businessInvestment 5.2 5.7 6.3 6.9 6.9Superannuation and 2.7 2.9 3.0 3.1 1.9annuitiesOther 0.6 0.6 0.7 0.7 0.7(a) Other income excludes government pensions, benefi ts or allowances. It includes selected sources of otherincome reported on the individual income tax return that were not allocated to one of the other categories. (b)Total average income of all sources available due to unavailable total population.Source: Australian Bureau of Statistics, Estimates of Personal Income for Small Areas, Time Series, 2003/04 to2007/08 (cat. no. 6524.0.55.002).In <strong>Moreton</strong> <strong>Bay</strong> region in 2007/08, the largest proportion ofpersonal income was wage and salary (84.5 per cent), followedby investment (6.9 per cent) and own unincorporated business(6.0 per cent).Personal income sources increased from 2003/04 to2007/08, except that of own incorporated business andsuperannuation and annuities. The proportions increased forinvestment (5.2 per cent to 6.9 percent) and other income(0.6 per cent to 0.7 per cent), while decreases occurred inown incorporated business (7.2 per cent to 6.0 per cent) andsuperannuation and annuities (2.7 per cent to 1.9 per cent).WAGE AND SALARY EARNERSThe ABS compiles wage and salaryestimates from the Australian TaxationOffice’s Individual Income Tax ReturnDatabase. In 2007/08, there were170,986 persons aged 15 yearsand over earning a wage or salary in<strong>Moreton</strong> <strong>Bay</strong> region, including 87,986males and 83,000 females.The occupation with the largest number ofwage and salary earners was intermediateclerical, sales and service workers (34,457persons), followed by professionals(23,402 persons) and tradespersonsand related workers (19,486 persons).Table 10 WAGE AND SALARY EARNERS AGED 15 YEARS AND OVER a ,by occupation and sex, <strong>Moreton</strong> <strong>Bay</strong> region, 2007/08.Occupation Males Females PersonsManagers and administrators 8,991 4,273 13,264Professionals 9,830 13,572 23,402Associate professionals 7,073 5,634 12,707Tradespersons and related workers 17,717 1,769 19,486Advanced clerical and service workers 454 3,293 3,747Intermediate clerical, sales and7,218 27,239 34,457service workersIntermediate production and11,002 1,362 12,364transport workersElementary clerical, sales and service5,651 12,566 18,217workersLabourers and related workers 12,174 6,183 18,357Not stated 7,876 7,109 14,985Total 87,986 83,000 170,986(a) Persons aged 15 years and over who have submitted an individual income tax return and have received wage and salary income in that fi nancial year.Source: Australian Bureau of Statistics, Wage and Salary Earner Statistics for Small Areas, Time Series, 2003/04 to 2007/08 (cat. no. 5673.0.55.003).
BusinessBUSINESS COUNTSThe Australian Bureau of Statistics Business Register contains a snapshot of activelytrading businesses as at June 2007. Statistical Local Area (SLA) data are available,based on the stated main business address. Where a business operates in morethan one location, that business is categorised only to the SLA of the main businessaddress.Data is available for employing and non-employing businesses. At June 2007, a totalof 10,194 employing businesses were recorded in <strong>Moreton</strong> <strong>Bay</strong> region. Of thesebusinesses, 24.0 per cent were in the construction industry and a further 18.9 percent were in the property and business services industry.Table 11 COUNTS OF REGISTERED BUSINESSES a ,by industry b , <strong>Moreton</strong> <strong>Bay</strong> region c and Queensland, 2006/07.Industry <strong>Moreton</strong> <strong>Bay</strong> region Queenslandnumber % number %Agriculture, forestry & fi shing 405 4.0 13,524 8.1Mining 15 0.1 816 0.5Manufacturing 954 9.4 11,358 6.8Electricity, gas & water supply 3 0.0 129 0.1Construction 2,448 24.0 27,138 16.3Wholesale trade 543 5.3 8,859 5.3Retail trade 1,503 14.7 26,709 16.0Accommodation, cafes & restaurants 219 2.1 7,809 4.7Transport & storage 639 6.3 8,397 5.0Communication services 141 1.4 1,950 1.2Finance & insurance 276 2.7 6,669 4.0Property & business services 1,929 18.9 33,462 20.1Government administration & defence n.a. n.a. n.a. n.a.Education 84 0.8 1,359 0.8Health & community services 483 4.7 10,080 6.0Cultural & recreational services 192 1.9 3,171 1.9Personal & other services 360 3.5 5,454 3.3Total 10,194 100.0 166,884 100.0In 2006/07, there were 24,669businesses in <strong>Moreton</strong> <strong>Bay</strong> region, 6.1per cent of all Queensland businesses.Of these businesses, 23,811 were smallbusinesses (employing 1 to 19 people,including non-employing business), 771were medium businesses (employing20 to 99 people) and 87 were largebusinesses (employing 100 or morepersons).Of total businesses in <strong>Moreton</strong> <strong>Bay</strong>region, 96.5 per cent were smallbusinesses compared with 95.5 per centin Queensland.n.a. = not available. (a) Counts have been rounded to preserve the confi dentiality of individual businesses. Slight differences may occur between tables.(b) Counts are based on the ABS defi nition of a business, detailed in Information Paper: A Statistical View of Counts of Businesses in Australia (ABS cat.no. 8162.0). Industry was coded to the Australian and New Zealand Standard Industrial Classifi cation (ANZSIC) 1993 edition. (c) Based on ASGC 2006boundaries.Source: Australian Bureau of Statistics, Counts of Australian Businesses, including Entries and Exits, Jun 2003 to Jun 2007, (cat. no. 8165.0).Table 12 COUNTS OF REGISTERED BUSINESSES a ,by employment size b , <strong>Moreton</strong> <strong>Bay</strong> region by district c and Queensland, 2006/07.Caboolture Pine Rivers Redcliffe <strong>Moreton</strong> <strong>Bay</strong> region QueenslandNumber of employeesNumber of businesses1 to 4 2,589 3,276 1,035 6,900 103,1555 to 19 909 1,134 393 2,436 45,44120 to 49 240 294 75 609 11,96750 to 99 66 63 30 159 3,471100 to 199 15 12 9 36 1,494200 or more 15 24 12 51 1,200Total employing businesses 3,834 4,803 1,554 10,191 166,728Non Employing businesses 5,700 6,546 2,229 14,475 237,573Total businesses 9,534 11,352 3,783 24,669 404,457(a) Counts have been rounded to preserve the confi dentiality of individual businesses. Slight differences may occur between tables. (b) Counts are based on the ABSdefi nition of a business, detailed in Information Paper: A Statistical View of Counts of Businesses in Australia (ABS cat. no. 8162.0). (c) Based on ASGC 2006 boundaries.Source: Australian Bureau of Statistics, Counts of Australian Businesses, including Entries and Exits, Jun 2003 to Jun 2007 (cat. no. 8165.0).8
HousingandBuildingActivityBUILDING APPROVALSIn the year ending 30 June 2010, there were 4,002 residentialdwelling units approved in <strong>Moreton</strong> <strong>Bay</strong> region. The value ofthese residential dwelling unit approvals was approximately$904 million, contributing 71.4 per cent of <strong>Moreton</strong> <strong>Bay</strong>region’s total value of buildings approved in that year.The value of new house approvals contributed more thantwo-thirds (67.8 per cent) of the value of residential buildingapprovals in <strong>Moreton</strong> <strong>Bay</strong> region in the June quarter 2010.The value of residential building approvals in <strong>Moreton</strong><strong>Bay</strong> region decreased from $276.6 million in the Marchquarter 2010 to $126.7 million in the June quarter2010. Values for the year ending 30 June 2010 were 8.5per cent lower than the previous 12-month period.Figure 5 VALUE OF RESIDENTIAL BUILDING APPROVALS,<strong>Moreton</strong> <strong>Bay</strong> region, March quarter 2007 to June quarter 2010.$ million350300250200150100New Houses Other residential Alterations and additionsTable 13 BUILDING APPROVALS a ,<strong>Moreton</strong> <strong>Bay</strong> region by district b , year ending 30 June 2010.RegionResidentialdwellingunitsapprovedValue ofresidentialbuildingsValue ofnon-residentialbuildingsapproved(a) Includes alterations, additions and conversions. (b) Based on ASGC 2006 boundaries.Note: Building approvals are revised each release.Source: Australian Bureau of Statistics, Building Approvals, Queensland (cat. no. 8731.3).Totalvalue ofbuildingsapprovednumber $’000 $’000 $’000Caboolturedistrict1,433 324,060 143,625 467,685Pine Riversdistrict1,943 426,787 129,853 556,640Redcliffe district 626 153,572 88,510 242,082<strong>Moreton</strong> <strong>Bay</strong>region4,002 904,419 361,988 1,266,407The value of non-residential building approvals in the <strong>Moreton</strong><strong>Bay</strong> region fl uctuated from quarter to quarter until the impactof the ‘Global Financial Crisis’ in the September quarter 2008.This led to a decrease in the value of non-residential buildingapprovals until the impact of economic stimulus measures couldbe observed in the sector in the September quarter 2009.Figure 6 VALUE OF NON-RESIDENTIAL BUILDING APPROVALS,<strong>Moreton</strong> <strong>Bay</strong> region, March quarter 2007 to June quarter 2010.$ million250500200Mar-07Jun-07Sep-07Dec-07Mar-08Jun-08Sep-08Dec-08Mar-09Jun-09Sep-09Dec-09Mar-10Jun-10150Source: Australian Bureau of Statistics, Building Approvals, Queensland (cat. no. 8731.3).100500Mar-07Jun-07Sep-07Dec-07Mar-08Jun-08Sep-08Dec-08Mar-09Jun-09Sep-09Dec-09Mar-10Jun-10Source: Australian Bureau of Statistics, Building Approvals, Queensland (cat. no. 8731.3).
Housing andBuilding ActivityLOT APPROVALS, REGISTRATIONS AND LAND SALESThere were 3,356 residential lots approved in <strong>Moreton</strong> <strong>Bay</strong> region in the yearending 31 December 2009. The highest number of lot approvals occurred inthe Pine Rivers District (1,685 approvals) and the Caboolture District(1,408 approvals).In the year ending 31 December 2009, <strong>Moreton</strong> <strong>Bay</strong> region recorded 2,808vacant land sales. The median values of these land sales were $218,000for Pine Rivers District, $215,000 for Redcliffe District and $195,000 forCaboolture District.Table 14 LOT APPROVALS, REGISTRATIONS AND LAND SALES,<strong>Moreton</strong> <strong>Bay</strong> region by district, 2009.Caboolture Pine Rivers RedcliffeLot approval a 1,408 1,685 263Lot registration b 1,126 1,514 77Median value land sales ($) c 195,000 218,000 215,000Volume of land sales c 1,127 1,575 106(a) Includes urban and rural residential. (b) Includes 250 – 50,000 m2 lots. (c) Includes 250 – 2,500 m2 lots.Source: Offi ce of Economic and Statistical Research, Residential Land and Dwelling Activity Profi le, Local Government Areas, unpublished data.HOUSE PRICESThe median house sale price for <strong>Moreton</strong><strong>Bay</strong> region in the June quarter 2010 was$407,000. Between the March quarter 2010and June quarter 2010, the median house saleprice increased by 1 .2 per cent . Over the fiveyears to June 2010, the median house saleprice increased by an annual average of 7 percent in <strong>Moreton</strong> <strong>Bay</strong> region .Table 15 MEDIAN HOUSE SALE PRICES a ,<strong>Moreton</strong> <strong>Bay</strong> region, June quarter 2010.<strong>Moreton</strong> <strong>Bay</strong> regionJune quarter 2010 ($) $407,000March quarter 2010 ($) $402,000Change March qtr 2010 to June qtr 2010 (per cent) b 1.2%12 months ending June 2010 ($) $399,00012 months ending June 2005 ($) $285,000Average annual change 2005 to 2010 (per cent) r 7%(r) Based on revised medians. All other medians are preliminary estimates. (a) Based on single-unit dwelling sales withland size under 2,400 m2. (b) All March quarter fi gures have been revised to refl ect the additional sales reported sincethe preliminary estimates for that quarter. The percentage change is based on March quarter preliminary fi gures, forcomparison with June quarter preliminary fi gures.Source: Real Estate Institute of Queensland, Queensland Market Monitor, unpublished data.Table 16 MEDIAN UNIT AND TOWNHOUSE SALE PRICES a ,<strong>Moreton</strong> <strong>Bay</strong> region, June quarter 2010.<strong>Moreton</strong> <strong>Bay</strong> regionJune quarter 2010 ($) $330,000March quarter 2010 ($) $325,000Change March qtr 2010 to June qtr 2010 (per cent) b 1.5%12 months ending June 2010 ($) $335,00012 months ending June 2005 ($) $235,000Average annual change 2005 to 2010 (per cent) r 7%UNIT AND TOWNHOUSE PRICESThe median unit and townhouse sale price for <strong>Moreton</strong> <strong>Bay</strong>region in June quarter 2010 was $330,000. Between theMarch quarter 2010 and June quarter 2010, the medianunit and townhouse sale price increased by 1.5 per cent.Over the five years to March 2010, the median sale priceincreased by an annual average of 7 per cent in <strong>Moreton</strong><strong>Bay</strong> region.(r) Based on revised medians. All other medians are preliminary estimates. (a) Based on single-unit dwelling sales withland size under 2,400 m2. (b) All March quarter fi gures have been revised to refl ect the additional sales reported sincethe preliminary estimates for that quarter. The percentage change is based on March quarter preliminary fi gures, forcomparison with June quarter preliminary fi gures.Source: Real Estate Institute of Queensland, Queensland Market Monitor, unpublished data.10
Table 17 MEDIAN WEEKLY RENTS,<strong>Moreton</strong> <strong>Bay</strong> region, September quarter 2010.Region 2 Bedroom Flats/Units 3 Bedroom HousesRent ($) % change over 12 month Rent ($) % change over 12 months<strong>Moreton</strong> <strong>Bay</strong> region 260 2.0 320 3.2Source: Residential Tenancies Authority, Rental Bond Lodgements, June quarter 2010.Figure 7 MEDIAN WEEKLY RENTS,two-bedroom fl ats/units, <strong>Moreton</strong> <strong>Bay</strong> region, September quarter 2008–2010.$300250200150<strong>Moreton</strong> <strong>Bay</strong> regionMEDIAN WEEKLY RENTSMedian weekly rents in the September quarter 2010 fortwo-bedroom fl ats/units were $260. In the 12 months toSeptember quarter 2010, median weekly rents fortwo-bedroom fl ats/units increased by 2 per cent.1005002008 2009 2010Quarter ending SeptemberSource: Residential Tenancies Authority, Rental Bond Lodgements, Septemberquarter 2010.Figure 8 MEDIAN WEEKLY RENTS,three-bedroom houses, <strong>Moreton</strong> <strong>Bay</strong> region, September quarter 2008–2010.$350300250200<strong>Moreton</strong> <strong>Bay</strong> regionMedian weekly rents in the September quarter 2010 forthree-bedroom houses were $320. In the 12 months toSeptember quarter 2010, median weekly rents forthree-bedroom houses increased by 3.2 per cent.1501005002008 2009 2010Quarter ending SeptemberSource: Residential Tenancies Authority, Rental Bond Lodgements, Septemberquarter 2010.
TourismTOURIST ACCOMMODATIONThe ABS conducts a quarterly survey of touristaccommodation establishments. In the Junequarter 2010, <strong>Moreton</strong> <strong>Bay</strong> region had 15hotel, motel, resort, guest house, and servicedapartment accommodation establishmentswith 15 or more rooms. These establishmentscontained 381 guest rooms and had 17,410guest arrivals.The average occupancy rate for guest rooms inthe region in the June quarter 2010 was 50.7per cent. This was higher than the occupancyrate in March quarter 2010 (44.6 per cent)and lower than June quarter 2009 (51.9 percent). Takings from tourist accommodation inthe March quarter 2010 totalled $1.9 million.Table 18 TOURIST ACCOMMODATION a ,<strong>Moreton</strong> <strong>Bay</strong> region, June quarter 2009 to June quarter 2010.Selected Characteristics Jun qtr 2009 Mar qtr 2010 Jun qtr 2010Establishments (no.) 15 15 15Guest rooms (no.) 391 397 381Guest nights (no.) 39,126 32,590 34,674Guest arrivals (no.) 16,826 14,791 17,410Takings from accommodation ($) 1,857,627 1,778,158 1,902,319Average room occupancy rate (%) 51.9 44.6 50.7(a) Hotels, motels, resorts, guest houses and serviced apartments with 15 or more rooms.Source: Australian Bureau of Statistics, Tourist Accommodation, Small Area Data, Queensland (cat. no. 8635.3.55.001).CARAVAN PARKSIn the June quarter 2010, <strong>Moreton</strong> <strong>Bay</strong> region had 13 caravanpark establishments with 40 or more powered sites. Theseestablishments contained 1,480 sites, of which 992 wereoccupied by long-term guests. The average occupancy rate forsites in the June quarter 2010 was 86.6 per cent. This washigher than the occupancy rate in March quarter 2010(86.2 per cent) and the June quarter 2009 (85.4 per cent).Takings from caravan park accommodation totalled$2.2 million in March quarter 2010 and decreased to$2.1 million in June quarter 2010.Table 19 CARAVAN PARKS a ,<strong>Moreton</strong> <strong>Bay</strong> region, June quarter 2009 to June quarter 2010.Selected CharacteristicsJun qtr2009Mar qtr2010(a) Caravan parks with 40 or more powered sites.Source: Australian Bureau of Statistics, Tourist Accommodation, Small Area Data, Queensland(cat. no. 8635.3.55.001).Jun qtr2010Establishments (no.) 13 13 13Sites (no.) 1,479 1,476 1,480Sites occupied by1,041 985 992long-term guests (no.)Occupancy rate (%) 85.4 86.2 86.6Takings fromaccommodation ($)1,875,000 2,219,000 2,126,000For more information<strong>Moreton</strong> <strong>Bay</strong> <strong>Regional</strong> <strong>Council</strong>PO Box 159Caboolture Qld 451007 3205 0555economic@moretonbay.qld.gov.auwww.moretonbay.qld.gov.auDisclaimer:The data produced in <strong>Moreton</strong> <strong>Bay</strong> region profi le is believed to be the most recent andaccurate data available at the time of publication. No responsibility is accepted for anyinadvertent errors.Copyright:The concepts and information contained in this document are the property of <strong>Moreton</strong><strong>Bay</strong> <strong>Regional</strong> <strong>Council</strong>. Use or copying of this document in whole or in part without writtenpermission of <strong>Moreton</strong> <strong>Bay</strong> <strong>Regional</strong> <strong>Council</strong> constitutes an infringement of copyright.Prepared by:Offi ce of Economic and Statistical ResearchQueensland Treasury, Level 8, 33 Charlotte Street, Brisbane QLD 4000Telephone: (07) 3224 5326 Facsimile: (07) 3227 7437 Web: www.oesr.qld.gov.au1600-16

![Kumbartcho Brochure [PDF 540KB] - Moreton Bay Regional Council](https://img.yumpu.com/47220970/1/190x101/kumbartcho-brochure-pdf-540kb-moreton-bay-regional-council.jpg?quality=85)