Determination of melamine in milk powder by capillary - Lietuvos ...
Determination of melamine in milk powder by capillary - Lietuvos ...
Determination of melamine in milk powder by capillary - Lietuvos ...

Create successful ePaper yourself
Turn your PDF publications into a flip-book with our unique Google optimized e-Paper software.
chemija. 2009. vol. 20. No. 4. P. 231–235© lietuvos mokslų akademija, 2009© lietuvos mokslų akademijos leidykla, 2009<strong>Determ<strong>in</strong>ation</strong> <strong>of</strong> <strong>melam<strong>in</strong>e</strong> <strong>in</strong> <strong>milk</strong> <strong>powder</strong> <strong>by</strong> <strong>capillary</strong>electrophoresisŽana Černova,Ina Razmislevičienė,Audrius Padarauskas*Department <strong>of</strong> Analytical andEnvironmental Chemistry,Vilnius University,Naugarduko 24,LT-03225 Vilnius,LithuaniaCapillary electrophoretic (CE) technique was developed for a rapid determ<strong>in</strong>ation <strong>of</strong><strong>melam<strong>in</strong>e</strong>. The optimized separations were carried out <strong>in</strong> 50 mmol/l tris(hydroxymethyl)am<strong>in</strong>omethane-phosphate electrolyte (pH 2.5) us<strong>in</strong>g a <strong>capillary</strong> coated with a poly(diallyldimethylammoniumchloride)/poly(sodium-4-styrenesulfonate) bilayer and directUV detection at 214 nm. The calibration curve was l<strong>in</strong>ear <strong>in</strong> the concentration range0.2–10.0 mg/l for <strong>melam<strong>in</strong>e</strong> with correlation coefficients higher than 0.9997. The detectionlimit was 0.06 mg/l. The proposed method was applied for a rapid determ<strong>in</strong>ation <strong>of</strong><strong>melam<strong>in</strong>e</strong> <strong>in</strong> <strong>milk</strong> <strong>powder</strong> samples. The recovery tests established for real samples werewith<strong>in</strong> the range 93.5–104%.Key words: <strong>melam<strong>in</strong>e</strong>, <strong>capillary</strong> electrophoresis, <strong>milk</strong> <strong>powder</strong>INTRODUCTIONMelam<strong>in</strong>e (1,3,5-triaz<strong>in</strong>e-2,4,6-triam<strong>in</strong>e; MEL) is a nitrogenconta<strong>in</strong><strong>in</strong>gcompound (Fig. 1) used <strong>in</strong> the production <strong>of</strong> plastics,flame retardants and <strong>melam<strong>in</strong>e</strong>–formaldehyde res<strong>in</strong>s forsurface coat<strong>in</strong>gs, lam<strong>in</strong>ates and adhesives, but it is not approvedas an <strong>in</strong>gredient <strong>in</strong> food [1]. However, due to the highnitrogen content (66% <strong>by</strong> mass), MEL is deliberately addedto food or food-related products because prote<strong>in</strong> content isusually estimated <strong>by</strong> determ<strong>in</strong><strong>in</strong>g the nitrogen content, andthe added MEL can boost the nitrogen content <strong>of</strong> the productsso as to make them appear to have more prote<strong>in</strong> and toreduce the costs. In 2008, several companies <strong>in</strong> Ch<strong>in</strong>a wereimplicated <strong>in</strong> a scandal <strong>in</strong>volv<strong>in</strong>g the <strong>milk</strong> and <strong>in</strong>fant foodformula which had been adulterated with <strong>melam<strong>in</strong>e</strong>, lead<strong>in</strong>gto kidney stones and other renal failures, especially amongFig. 1. Structure <strong>of</strong> <strong>melam<strong>in</strong>e</strong>* Correspond<strong>in</strong>g author. E-mail: audrius.padarauskas@chf.vu.ltyoung children. Nearly 300,000 people had become ill, withmore than 12 800 hospitalizations and four <strong>in</strong>fant deaths. <strong>Determ<strong>in</strong>ation</strong><strong>of</strong> <strong>melam<strong>in</strong>e</strong> <strong>in</strong> food, and particularly <strong>in</strong> dairyproducts for children, is therefore <strong>of</strong> great importance to ensurefood safety.High-performance liquid chromatography (HPLC) is acommonly used technique for determ<strong>in</strong>ation <strong>of</strong> <strong>melam<strong>in</strong>e</strong><strong>in</strong> a wide variety <strong>of</strong> samples, such as soil [2], animal feeds[3], plant matter [4] and food products [5, 6]. However, most<strong>of</strong> the HPLC methods employ a mass spectrometer (MS) asa detector, which is very expensive compared with conventionalUV detectors. Moreover, for HPLC methods, additionalsample clean-up procedures are <strong>of</strong>ten required.The analysis <strong>of</strong> complex biological samples requires thehighest level <strong>of</strong> separation selectivity control and columnefficiency. In the case <strong>of</strong> charged analytes, <strong>capillary</strong> electrophoresis(CE) provides an excellent alternative to HPLC. Thema<strong>in</strong> advantages <strong>of</strong> CE over HPLC <strong>in</strong>clude low solvent consumption,high speed and efficiency, simplicity and reducedsample preparation time. Several comprehensive surveys<strong>of</strong> CE methods developed for determ<strong>in</strong>ation <strong>of</strong> ionic compounds<strong>in</strong> a wide variety <strong>of</strong> matrices have been published[7–9]. Recently, Klampfl et al. [10] analyzed <strong>melam<strong>in</strong>e</strong> <strong>by</strong> CEutiliz<strong>in</strong>g UV and MS detectors but the run time was not particularlyfast (15 m<strong>in</strong>).The aim <strong>of</strong> this work was to develop a rapid and simpleCE method for determ<strong>in</strong>ation <strong>of</strong> <strong>melam<strong>in</strong>e</strong> <strong>in</strong> <strong>milk</strong> <strong>powder</strong>.
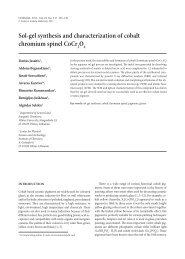
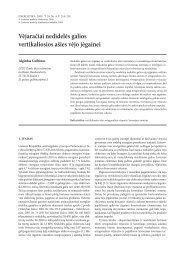
<strong>Determ<strong>in</strong>ation</strong> <strong>of</strong> <strong>melam<strong>in</strong>e</strong> <strong>in</strong> <strong>milk</strong> <strong>powder</strong> <strong>by</strong> <strong>capillary</strong> electrophoresis233were obta<strong>in</strong>ed. Based on these results, Tris-phosphate waschosen as a carrier electrolyte. However, due to a very slowelectroosmotic flow (EOF) <strong>in</strong> the acidic electrolyte, the totalrun time (about 7.5 m<strong>in</strong>) was too high for a fast analysis.The rate <strong>of</strong> the EOF strongly depends on the pH <strong>of</strong> theelectrophoresis medium and decreases rapidly below pH 6,result<strong>in</strong>g <strong>in</strong> a longer time <strong>of</strong> analysis. Elim<strong>in</strong>ation <strong>of</strong> the pHdependency<strong>of</strong> the EOF requires a chemical modification <strong>of</strong>the <strong>capillary</strong> surface. The most commonly used approach is abilayer <strong>capillary</strong> coat<strong>in</strong>g [14]. The two-stage process <strong>in</strong>volves<strong>in</strong>itially flush<strong>in</strong>g the <strong>capillary</strong> with electrolyte conta<strong>in</strong><strong>in</strong>gthe polycation. The multiply charged polycations coat theentire <strong>capillary</strong> wall, mak<strong>in</strong>g it strongly positively charged.The <strong>capillary</strong> is then flushed with a buffer conta<strong>in</strong><strong>in</strong>g thepolyanion. The polyanions adsorb to the positively chargedlayer and form a highly negatively charged layer which is<strong>in</strong>sensitive to pH changes, result<strong>in</strong>g <strong>in</strong> a strong and constantcathodal EOF. In the present work, the <strong>capillary</strong> coated witha poly(diallyldimethylammonium) / poly(styrenesulfonate) bilayer was tested for the separation <strong>of</strong> <strong>melam<strong>in</strong>e</strong>. Such<strong>capillary</strong> coat<strong>in</strong>gs have been successfully employed for tomodify EOF velocity <strong>in</strong> CE separation <strong>of</strong> <strong>in</strong>organic ions andorganic molecules [15–18]. The complete <strong>capillary</strong> coat<strong>in</strong>gprotocol is given <strong>in</strong> Experimental. Us<strong>in</strong>g a <strong>capillary</strong> coatedwith a PDDAC / PSS bilayer, the separation time was reducedFig. 3. Effect <strong>of</strong> electrolyte pH on the migration time (a) and peak efficiency (b) <strong>of</strong><strong>melam<strong>in</strong>e</strong>. Electrolyte, 50 mmol/l <strong>of</strong> H 3PO 4neutralized with Tris to desired pHFig. 4. Electropherogram <strong>of</strong> a standard <strong>melam<strong>in</strong>e</strong> solution (10 mg/l) us<strong>in</strong>g a<strong>capillary</strong> coated with poly(diallyldimethylammonium)/poly(styrenesulfonate)bilayer. Electrolyte, 50 mmol/l <strong>of</strong> H 3PO 4neutralized with Tris to pH 2.5. Otherconditions as <strong>in</strong> Fig. 2<strong>by</strong> a factor <strong>of</strong> about 2.4, while the peak efficiency rema<strong>in</strong>edquite satisfactory.In CE, ionic analyte separation is based on both theircharge and size. For a weakly basic MEL (pK a= 5), its mobilityis pH-dependent because the protonation <strong>of</strong> the analyteis controlled <strong>by</strong> electrolyte pH. The effect <strong>of</strong> electrolyte pHon the migration time and peak efficiency (theoretical platenumber, N) <strong>of</strong> MEL is summarized <strong>in</strong> Fig. 3. As expected, dueto the protonation <strong>of</strong> MEL at pH values near and below itspK a, the net charge and, consequently, the mobility <strong>of</strong> MELcation <strong>in</strong>creases, result<strong>in</strong>g <strong>in</strong> a shorter migration time and abetter peak efficiency. The best separation performance wasobserved <strong>in</strong> the pH range 2–3. Tak<strong>in</strong>g the buffer<strong>in</strong>g capacity<strong>in</strong>to account, pH 2.5 was considered to be the best value forthe carrier electrolyte. The electropherogram obta<strong>in</strong>ed underoptimum conditions for a standard MEL solution is shown<strong>in</strong> Fig. 4. As one can see, a significantly better separation performance<strong>in</strong> respect to peak efficiency and separation timewas obta<strong>in</strong>ed for the coated <strong>capillary</strong>.Once the optimized conditions were selected, the methodwas validated with respect to the follow<strong>in</strong>g parameters:l<strong>in</strong>earity <strong>of</strong> the calibration curve, limit <strong>of</strong> detection, limit <strong>of</strong>quantification, precision and accuracy.The l<strong>in</strong>earity <strong>of</strong> the method was tested <strong>by</strong> prepar<strong>in</strong>g a calibrationcurve for each analyte with six po<strong>in</strong>ts. The test concentrationrange was 0.2 to 10 mg/l, and each concentrationlevel was <strong>in</strong>jected (12 s) three times. The assay showed a l<strong>in</strong>earitywith a relative standard deviation (RSD) ≤4.1% for therelative responses (peak area divided <strong>by</strong> concentration) obta<strong>in</strong>ed<strong>in</strong> the concentration range tested and the correlationcoefficient >0.9997 found for both analytes. The <strong>in</strong>tercept
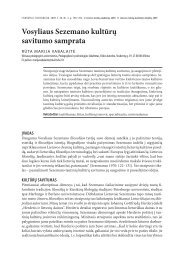
234Žana Černova, Ina Razmislevičienė, Audrius Padarauskaswas not significantly different from zero. In addition, it waschecked whether at the lower limit <strong>of</strong> the l<strong>in</strong>ear range, def<strong>in</strong>edas the method limit <strong>of</strong> quantification, the analyticalperformances were satisfactory. Consequently, for the firstconcentration (0.2 mg/l) <strong>of</strong> the l<strong>in</strong>ear range, the signal-tonoiseratio was measured and the RSD <strong>of</strong> the peak area wascalculated with five replicates. The signal-to-noise ratio was13 and the repeatability RSD 7.8%. The detection limit (threetimes the basel<strong>in</strong>e noise) was 0.06 mg/l. These data confirmthe suitability <strong>of</strong> the proposed method for its application toreal samples.Method accuracy was determ<strong>in</strong>ed <strong>by</strong> measur<strong>in</strong>g repeatabilityand <strong>in</strong>termediate precision (between-day precision). Inorder to determ<strong>in</strong>e the repeatability <strong>of</strong> the method, six replicate<strong>in</strong>jections <strong>of</strong> the standards at three MEL concentrationlevels (0.2, 0.5 and 1 mg/l) were carried out. The <strong>in</strong>termediateaccuracy was evaluated over three days <strong>by</strong> perform<strong>in</strong>g sixsuccessive <strong>in</strong>jections daily. A relatively little dispersion wasobserved for migration times because both repeatability and<strong>in</strong>termediate accuracy were less than 1.8%. For peak areas,the repeatability was <strong>in</strong> the range 2.3–4.8%, whereas <strong>in</strong>termediateprecision ranged from 3.9 to 6.3% depend<strong>in</strong>g on theconcentrations.To evaluate the proposed CE system for real samples, itwas used to determ<strong>in</strong>e MEL <strong>in</strong> <strong>milk</strong> <strong>powder</strong> samples. Amongthe 10 samples obta<strong>in</strong>ed from local supermarkets, nonewere found positive for MEL. Figure 5 shows the electropherogramsobta<strong>in</strong>ed for a non-fortified <strong>milk</strong> <strong>powder</strong> sample(a) and the same sample fortified at 2 mg/kg <strong>of</strong> MEL (b). Toevaluate the accuracy <strong>of</strong> the method, a recovery study wascarried out with two samples, and the results are summarized<strong>in</strong> Table. As one can see, the concentrations found are generally<strong>in</strong> good agreement with the added concentrations, withrecoveries between 93.5 and 104%. These results suggest that<strong>in</strong>terferences <strong>by</strong> the other matrix components are not significantand the CE conditions are suitable to obta<strong>in</strong> an adequateaccuracy <strong>of</strong> the method.Table. MEL recovery test results for two <strong>milk</strong> <strong>powder</strong> samples (n = 3)Sample No Added, mg/kg Found, mg/kg Recovery, %12.00 1.87 93.55.00 4.83 96.622.00 2.08 1045.00 4.90 98.0In comparison with GC and HPLC techniques, the CEmethod has a m<strong>in</strong>imal set-up time, a lower sample matrixdependence, needs lower costs and reagent consumptionand gives better separation efficiencies <strong>in</strong> a shorter time <strong>of</strong>analysis.Received 29 June 2009Accepted 7 August 2009ReferencesFig. 5. Electropherograms <strong>of</strong> <strong>milk</strong> <strong>powder</strong> sample (a) and <strong>milk</strong> <strong>powder</strong> samplefortified at 2 mg/kg <strong>of</strong> <strong>melam<strong>in</strong>e</strong> standard (b)1. B. Bann, S. A. Miller, Chem. Rev., 58, 131 (1958).2. R. A. Yokley, L. C. Mayer, R. Rezaaiyan, M. E. Manuli,M. W. Cheung, J. Agric. Food Chem., 48, 3352 (2000).3. D. N. Heller, C. B. Nochetto, Rapid Commun. MassSpectrom., 22, 3624 (2008).4. J. V. Sancho, M. Ibánez, S. Grimalt, O. J. Pozo, F. Hernández,Anal. Chim. Acta, 530, 237 (2005).5. W. C. Andersen, S. B. Turnipseed, C. M. Karbiwnyk,S. B. Clark, M. R. Madson, C. M. Gieseker, R. A. Miller,N. G. Rummel, R. Reimschuessel, J. Agric. Food Chem., 56,4340 (2008).6. M. S. Filigenzi, B. Puschner, L. S. Aston, R. H. Poppenga, J.Agric. Food Chem., 56, 7593 (2008).7. M. C. Breadmore, P. R. Haddad, Electrophoresis, 22, 2464(2001).8. A. Padarauskas, Electrophoresis, 24, 2054 (2003).9. A. Padarauskas, Anal. Bioanal. Chem., 384, 132 (2006).10. Ch. W. Klamfl, L. Andersen, M. Haunschmidt,M. Himmelsbach, W. Buchberger, Electrophoresis, 30, 1(2009).11. W. Buchberger, S. A. Cous<strong>in</strong>s, P. R. Haddad, Trends Anal.Chem., 13, 313 (1994).
<strong>Determ<strong>in</strong>ation</strong> <strong>of</strong> <strong>melam<strong>in</strong>e</strong> <strong>in</strong> <strong>milk</strong> <strong>powder</strong> <strong>by</strong> <strong>capillary</strong> electrophoresis23512. A. Padarauskas, V. Olsauskaite, V. Paliulionyte, Anal. Chim.Acta, 374, 159 (1998).13. Z. Daunoravicius, A. Padarauskas, Electrophoresis, 23, 2439(2002).14. E. Cordova, J. Gao, G. M. Whitesides, Anal. Chem., 69,1370 (1997).15. B. Pranaityte, A. Padarauskas, A. Dikcius, R. Ragauskas,Anal. Chim. Acta, 507, 185 (2004).16. B. Pranaityte, A. Padarauskas, J. Chromatogr. A, 1042, 197(2004).17. B. Pranaityte, A. Padarauskas, Electrophoresis, 27, 1915(2006).18. B. Pranaityte, S. Jermak, E. Naujalis, A. Padarauskas,Microchem. J., 86, 48 (2007).Žana Černova, Ina Razmislevičienė, Audrius PadarauskasMELAMINO NUSTATYMAS PIENO MILTELIUOSEKAPILIARINĖS ELEKTROFOREZĖS METODUSantraukaOptimizuotas kapiliar<strong>in</strong>ės elektr<strong>of</strong>orezės metodas melam<strong>in</strong>ui nustatyti.Atskiriama dvigubu poli(dialildimetilamonio chlorido)/poli(natrio-4-stirensulfonato) sluoksniu padengtame kapiliare50 mmol/l tris(hidroksimetil)am<strong>in</strong>ometano fosfato elektrolite(pH 2,5, 214 nm) detektuojant. Kalibrac<strong>in</strong>ė kreivė yra ties<strong>in</strong>ė0,2–10,0 mg/l melam<strong>in</strong>o koncentracijų <strong>in</strong>tervale, koreliacijos koeficientas≥0,9997, aptikimo riba – 0,06 mg/l. Metodas pritaikytasmelam<strong>in</strong>ui nustatyti pieno milteliuose. Analičių išgavos iš realiųmėg<strong>in</strong>ių siekia 93,5–104 %.