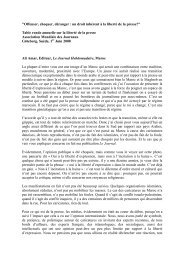
MAY 2008 SHAPING THE FUTURE OF THE NEWSPAPERDigital Hot Spots, 2008Hottest Mobile > 65% Internet > 40%Hot in mobile Mobile > 65% Internet < 40%Hot in Internet Mobile < 65% Internet > 40%Coolest Mobile < 65% Internet < 40%Source: 2008 <strong>World</strong> Factbook, C<strong>en</strong>tral Intellig<strong>en</strong>ce Ag<strong>en</strong>cy© <strong>World</strong> <strong>Association</strong> <strong>of</strong> <strong>Newspapers</strong> 2007-2008but also individual mobile and Internet hotspots around the world. Several countries havebe<strong>en</strong> added to the list <strong>of</strong> hot spots since lastyear, mostly in southern Europe.The first two chapters in this report detail themedia advertising landscape, with a focus ondigital media. According to consulting groupPricewaterhouseCoopers (PwC), digital/mobilerev<strong>en</strong>ues are predicted to expand within 10years, from US$12.7 billion in 2002 to $153.4billion in 2011, a growth <strong>of</strong> more than 12-fold.These digital rev<strong>en</strong>ues, including onlinesubscriptions, digital mobile, TV and musicdownloads, video-on-demand, online ads,online/mobile video games and e-publishing,mark significant, double-digit range growtheach year.Global advertising has grown steadily since2002, and is expected to reach US$500 billionin 2010, with an average CAGR <strong>of</strong> 5.4 perc<strong>en</strong>tfrom 2007 to 2011, according to PwC.Television is the largest contributor, at $119.9billion in 2002, and is expected to reach$196.9 billion in 2011. It remains responsiblefor the biggest share throughout the time,around 37 perc<strong>en</strong>t.<strong>Newspapers</strong>, although still growing adrev<strong>en</strong>ues from $102.5 billion in 2002 to $132.7billion in 2011, continue to lose market share.Other traditional media such as magazines and%4035302520151050Share <strong>of</strong> Global Advertisingby Sector36,931,5TV <strong>Newspapers</strong> MagazinesRadio Out-<strong>of</strong>-home Internet37,6 37,929,626,514,2 13,4 14,212,48,3 10,88,97,55,72,8 6 5,7 5,82002 2005 2008 201137,12513,8127,36Source: PricewaterhouseCoopers LLP, Wilk<strong>of</strong>sky Gru<strong>en</strong> Associates© <strong>World</strong> <strong>Association</strong> <strong>of</strong> <strong>Newspapers</strong> 2007-20086
VOLUME 6 REPORT N° 2WORLD DIGITAL MEDIA TRENDSUS$ million600,000500,000400,000300,000Global Advertising by Segm<strong>en</strong>tOut-<strong>of</strong>-Home MagazinesRadio Internet458,014 478,784<strong>Newspapers</strong> Television325,025 336,840 364,706 383,565 407,457 427,473507,728 530,970200,000100,0000% annual changeOut-<strong>of</strong>-HomeRadio<strong>Newspapers</strong>MagazinesInternetTelevisionTotal20020.73.9-2.6-5.4-8.34.1-0.120033.82.22.51.528.14.93.620046.44.54.94.942.010.68.320056.82.33.24.939.33.55.22006p6.32.12.33.337.96.66.2Source: PricewaterhouseCoopers LLP, Wilk<strong>of</strong>sky Gru<strong>en</strong> Associates © <strong>World</strong> <strong>Association</strong> <strong>of</strong> <strong>Newspapers</strong> 2007-200820076.62.71.43.228.43.94.920087.43.32.83.722.08.87.120096.53.72.74.016.62.74.520106.14.33.34.213.66.76.020115.94.43.23.911.53.44.62007-11CAGR6.53.72.73.818.35.15.4radio are also experi<strong>en</strong>cing share decline, from14 perc<strong>en</strong>t and nine perc<strong>en</strong>t, to 12 perc<strong>en</strong>t andsev<strong>en</strong> perc<strong>en</strong>t, respectively. The most growth ishapp<strong>en</strong>ing in the Internet sector, which ispredicted to surge from $9 billion in 2002 to$73.1 billion in 2011. Its CAGR from 2007 to2011 will be three times more than theaverage, PwC has forecast, with its sharejumping from less than three perc<strong>en</strong>t in 2002to nearly 14 perc<strong>en</strong>t in 2011, and is expectedto continue rising.WDMT Chapter 3 digs deeper into mediaconsumption and usage patterns, building onwhat factors drive rev<strong>en</strong>ue detailed in previouschapters.This year, WDMT has also found manysources pointing out the growing popularity <strong>of</strong>digital channels, such as:• The mobile customer base worldwide hasgrown from 945 million in 2001 to 2.6 billionin 2006. In 2001, more than 60 perc<strong>en</strong>t, or 576million, came from industrialised countries,while 369 million were from developingcountries. In 2006, however, customer bases indeveloping countries surpassed those inindustrialised countries, with 1.7 billion, or 66perc<strong>en</strong>t, versus the 886 million inindustrialised countries.• Global wireless subscriptions continue togrow, from 1.1 billion in 2002 to a projected3.4 billion in 2011, an expansion <strong>of</strong> more thanthree-fold.• The broadband market is expected to growfrom 51.38 million households worldwide inGlobal Mobile Customers& Mobile D<strong>en</strong>sity,Industrialised Countries vs.Developing Countries, 2001 – 2006Industrialised countriesMobile customersMobile d<strong>en</strong>sity (%)Source: Mobile 2007, IDATE© <strong>World</strong> <strong>Association</strong> <strong>of</strong> <strong>Newspapers</strong> 2007-2008Developing countriesMobile customersMobile d<strong>en</strong>sity (%)million2,00091.81,80085.5171678.21,60071.61,40060.965.813201,2001,000955886821800748600 57662568270532.152125.0400 36918.313.77.410.320002001 2002 2003 2004 2005 2006%10090807060504030201007