MAY 2008 SHAPING THE FUTURE OF THE NEWSPAPERONLINE ADVERTISING IN U.S.U.S. Online Users and OnlineAd Rev<strong>en</strong>ues, 2006 to 2011US$ billions60504030190.5201002006 2007 2008 2009 2010 2011Source: Marketing Charts/Yankee Group and InteractiveAdvertising Bureau, Jan 2008© <strong>World</strong> <strong>Association</strong> <strong>of</strong> <strong>Newspapers</strong> 2007-2008According to technology research firm YankeeGroup and market research group theInteractive Advertising Bureau, U.S. online adswill surge from US$17 billion in 2006 to $50billion in 2011, a growth <strong>of</strong> nearly 200perc<strong>en</strong>t. The online population in the countrywill also continue to increase, from 190million in 2006, to more than 205 million in2011.%4035302520151016.9195.021.7Online advertising rev<strong>en</strong>ueInternet users age 6+197.227.6200.034.3202.941.9205.850.3U.S. Advertising Sp<strong>en</strong>dingGrowth Rate, 2006-201134.626.828.518.2 15.4Million210205200195190185180Total mediaInternetTotal mediawithout Internet5 3.9 2.1 2.8 2 2.5 2.32.4 00.5 0.7 0.4 0.9 0.92006 2007 2008 2009 2010 2011Source: eMarketer, October 2007© <strong>World</strong> <strong>Association</strong> <strong>of</strong> <strong>Newspapers</strong> 2007-2008As the Internet is still a relatively new form <strong>of</strong>media, it’s no surprise that Internet adsp<strong>en</strong>ding growth is much stronger thantraditional media in the United States.According to online market research firmeMarketer, online ad sp<strong>en</strong>ding growth is muchhigher than other media, with double-digitannual growth from 2006 to 2011. Its growthrate is especially high during the first threeyears, at more than 25 perc<strong>en</strong>t.12US$ billions50454035302520151050Index <strong>of</strong> U.S. Ad Sp<strong>en</strong>ding Growth:TV vs. Consumer Internet100-point index700Consumer Internet ad sp<strong>en</strong>d600TV ad sp<strong>en</strong>d50040030020010020.116.9U.S. Online and RadioAdvertising Sp<strong>en</strong>dingOnline Ad Sp<strong>en</strong>dingRadio Ad Sp<strong>en</strong>ding34.028.221.720.4 21.0 21.5 22.1 22.6Source: eMarketer, August 2007© <strong>World</strong> <strong>Association</strong> <strong>of</strong> <strong>Newspapers</strong> 2007-200839.044.02006 2007 2008 2009 2010 2011099 00 01 02 03 04 05 06 07F 08F 09FSource: IBM Institute for Business Value analysis based on anamalgamation <strong>of</strong> industry forecast, “The <strong>en</strong>d <strong>of</strong> advertising as weknow it,” 2007 © <strong>World</strong> <strong>Association</strong> <strong>of</strong> <strong>Newspapers</strong> 2007-2008The total media growth rate <strong>of</strong> all media isabout two to four perc<strong>en</strong>t each year, but if theInternet is tak<strong>en</strong> out, that growth rate is lessthan one perc<strong>en</strong>t, except for in 2006.In 2006, more was sp<strong>en</strong>t on U.S. radioadvertising than online. Sp<strong>en</strong>ding for theonline sector exceeded radio for the first timein 2007, and is forecast to continue that stronggrowth, according to eMarketer. Radioadvertising, meanwhile, is stagnant. In 2011,online ad sp<strong>en</strong>ding will total $44 billion, whileradio ad sp<strong>en</strong>d will have only about half, $22.6billion.According to IBM Institute for Business Value,online ad sp<strong>en</strong>d also outshines TV in theUnited States. Sp<strong>en</strong>ding for both media was at100 on the index in 1999, and consumerInternet ad sp<strong>en</strong>ding nearly doubled in the nextyear. Although that growth recessed betwe<strong>en</strong>46
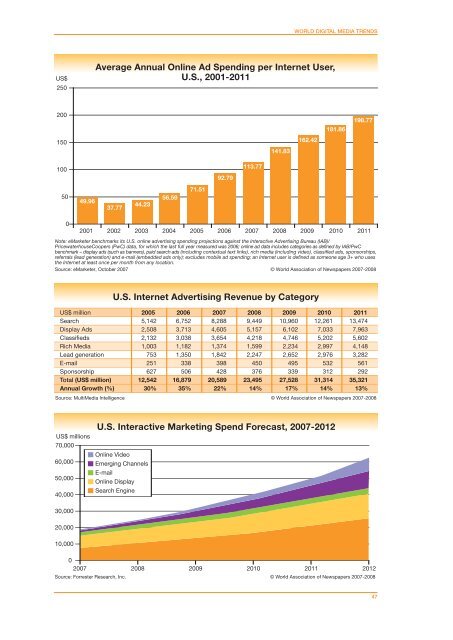
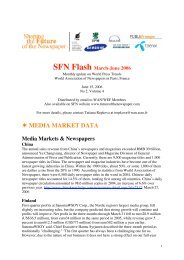
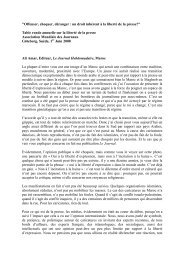
VOLUME 6 REPORT N° 2 WORLD DIGITAL MEDIA TRENDSUS$250Average Annual Online Ad Sp<strong>en</strong>ding per Internet User,U.S., 2001-2011200181.86198.77150141.83162.4210092.79113.775049.9637.7744.2356.5971.5102001 2002 2003 2004 2005 2006 2007 2008 2009 2010 2011Note: eMarketer b<strong>en</strong>chmarks its U.S. online advertising sp<strong>en</strong>ding projections against the Interactive Advertising Bureau (IAB)/PricewaterhouseCoopers (PwC) data, for which the last full year measured was 2006; online ad data includes categories as defined by IAB/PwCb<strong>en</strong>chmark – display ads (such as banners), paid search ads (including contextual text links), rich media (including video), classified ads, sponsorships,referrals (lead g<strong>en</strong>eration) and e-mail (embedded ads only); excludes mobile ad sp<strong>en</strong>ding; an Internet user is defined as someone age 3+ who usesthe Internet at least once per month from any location.Source: eMarketer, October 2007 © <strong>World</strong> <strong>Association</strong> <strong>of</strong> <strong>Newspapers</strong> 2007-2008US$ millionSearchDisplay AdsClassifiedsRich MediaLead g<strong>en</strong>erationE-mailSponsorshipTotal (US$ million)Annual Growth (%)U.S. Internet Advertising Rev<strong>en</strong>ue by Category2005 2006 2007 2008 2009 2010 20115,1422,5082,1321,00375325162712,54230%6,7523,7133,0381,1821,35033850616,87935%8,2884,6053,6541,3741,84239842820,58922%9,4495,1574,2181,5992,24745037623,49514%10,9606,1024,7462,2342,65249533927,52817%12,2617,0335,2022,9972,97653231231,31414%13,4747,9635,6024,1483,28256129235,32113%Source: MultiMedia Intellig<strong>en</strong>ce © <strong>World</strong> <strong>Association</strong> <strong>of</strong> <strong>Newspapers</strong> 2007-2008US$ millions70,00060,00050,00040,000U.S. Interactive Marketing Sp<strong>en</strong>d Forecast, 2007-2012Online VideoEmerging ChannelsE-mailOnline DisplaySearch Engine30,00020,00010,00002007 2008 2009 2010 2011 2012Source: Forrester Research, Inc. © <strong>World</strong> <strong>Association</strong> <strong>of</strong> <strong>Newspapers</strong> 2007-200847