Contents of It's not All in Your Head by Asmundson and Taylor
Contents of It's not All in Your Head by Asmundson and Taylor
Contents of It's not All in Your Head by Asmundson and Taylor

Create successful ePaper yourself
Turn your PDF publications into a flip-book with our unique Google optimized e-Paper software.
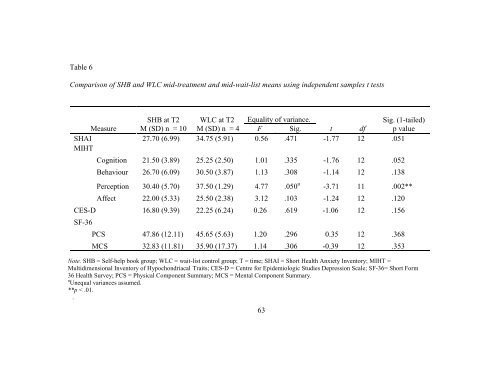
Table 6<br />
Comparison <strong>of</strong> SHB <strong>and</strong> WLC mid-treatment <strong>and</strong> mid-wait-list means us<strong>in</strong>g <strong>in</strong>dependent samples t tests<br />
SHB at T2 WLC at T2 Equality <strong>of</strong> variance.<br />
Sig. (1-tailed)<br />
Measure M (SD) n = 10 M (SD) n = 4 F Sig. t df p value<br />
SHAI<br />
MIHT<br />
27.70 (6.99) 34.75 (5.91) 0.56 .471 -1.77 12 .051<br />
Note. SHB = Self-help book group; WLC = wait-list control group; T = time; SHAI = Short Health Anxiety Inventory; MIHT =<br />
Multidimensional Inventory <strong>of</strong> Hypochondriacal Traits; CES-D = Centre for Epidemiologic Studies Depression Scale; SF-36= Short Form<br />
36 Health Survey; PCS = Physical Component Summary; MCS = Mental Component Summary.<br />
u Unequal variances assumed.<br />
**p < .01.<br />
.<br />
Cognition 21.50 (3.89) 25.25 (2.50) 1.01 .335 -1.76 12 .052<br />
Behaviour 26.70 (6.09) 30.50 (3.87) 1.13 .308 -1.14 12 .138<br />
Perception 30.40 (5.70) 37.50 (1.29) 4.77 .050 u -3.71 11 .002**<br />
Affect 22.00 (5.33) 25.50 (2.38) 3.12 .103 -1.24 12 .120<br />
CES-D 16.80 (9.39) 22.25 (6.24) 0.26 .619 -1.06 12 .156<br />
SF-36<br />
PCS 47.86 (12.11) 45.65 (5.63) 1.20 .296 0.35 12 .368<br />
MCS 32.83 (11.81) 35.90 (17.37) 1.14 .306 -0.39 12 .353<br />
63