Haiti – Dominican Republic - Disasters and Conflicts - UNEP
Haiti – Dominican Republic - Disasters and Conflicts - UNEP Haiti – Dominican Republic - Disasters and Conflicts - UNEP
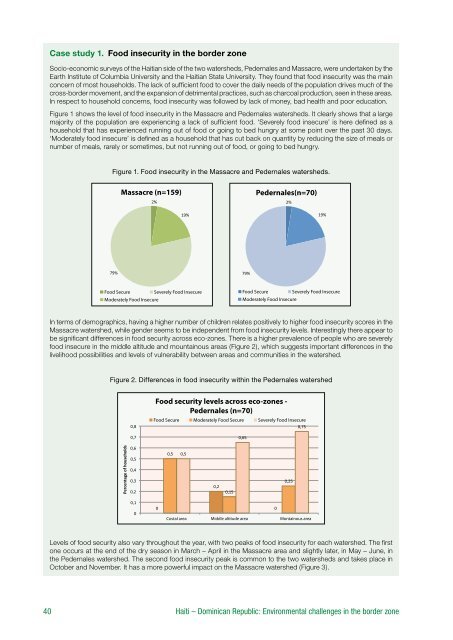
Case study 1. Food insecurity in the border zoneSocio-economic surveys of the Haitian side of the two watersheds, Pedernales and Massacre, were undertaken by theEarth Institute of Columbia University and the Haitian State University. They found that food insecurity was the mainconcern of most households. The lack of sufficient food to cover the daily needs of the population drives much of thecross-border movement, and the expansion of detrimental practices, such as charcoal production, seen in these areas.In respect to household concerns, food insecurity was followed by lack of money, bad health and poor education.Figure 1 shows the level of food insecurity in the Massacre and Pedernales watersheds. It clearly shows that a largemajority of the population are experiencing a lack of sufficient food. ‘Severely food insecure’ is here defined as ahousehold that has experienced running out of food or going to bed hungry at some point over the past 30 days.‘Moderately food insecure’ is defined as a household that has cut back on quantity by reducing the size of meals ornumber of meals, rarely or sometimes, but not running out of food, or going to bed hungry.Figure 1. Food insecurity in the Massacre and Pedernales watersheds.Massacre (n=159)Pedernales(n=70)Food SecureSeverely Food InsecureModerately Food InsecureFood SecureSeverely Food InsecureModerately Food InsecureIn terms of demographics, having a higher number of children relates positively to higher food insecurity scores in theMassacre watershed, while gender seems to be independent from food insecurity levels. Interestingly there appear tobe significant differences in food security across eco-zones. There is a higher prevalence of people who are severelyfood insecure in the middle altitude and mountainous areas (Figure 2), which suggests important differences in thelivelihood possibilities and levels of vulnerability between areas and communities in the watershed.Figure 2. Differences in food insecurity within the Pedernales watershedFood security levels across eco-zones -Pedernales (n=70)Food SecureModerately Food SecureSeverely Food InsecureCostal area Middle altitude area Montainous areaLevels of food security also vary throughout the year, with two peaks of food insecurity for each watershed. The firstone occurs at the end of the dry season in March – April in the Massacre area and slightly later, in May – June, inthe Pedernales watershed. The second food insecurity peak is common to the two watersheds and takes place inOctober and November. It has a more powerful impact on the Massacre watershed (Figure 3).40 Haiti – Dominican Republic: Environmental challenges in the border zone
Figure 3. Seasonality of food insecurityMonths with lack of foodacross watershedsTotal (n=224)Massacre(n=158)Pedernales(n=66)47%32%24%32%29%Jan Feb Mar Apr May Jun Jul Aug Sep Oct Nov DecThe household surveys also included information of livelihoods. Farming (defined as generating at least 40% of thetotal household income) and charcoal production, have a strong positive relationship with food insecurity. Familiesengaged in commerce were generally more food secure and not as poor.food insecurity on the Haitian side of the Massacreand Pedernales watersheds, a main concern formany Haitian households.The population on the Haitian side of the borderzone has increased much more quickly than it hasdone in the rest of the country. The populationsof the communities in the border zone for whichdata is available have grown by nearly 4% peryear, compared with 1.3% across the country asa whole. 152, 153, 154 The Haitian population in theborder zone is very young: 68% of people areunder 25 – a much higher percentage than inthe rest of the country. 155 The relative youth ofthe border population shows the attraction ofthe border zone for young – often unemployed –Haitians.Dominican RepublicIn the Dominican Republic, the border provincesare Montecristi, Dajabón, Elías Piña, Independencia,Pedernales, Bahoruco and SantiagoRodríguez, and these seven provinces represent22% of the national territory. However, only 5.2%of the total Dominican Republic population livesthere, leaving the region with a relatively lowpopulation density. The Dominican population hasa long history of internal migration away from therural areas towards the cities. This is particularly truein border zone provinces, which are the poorestrural parts of the Dominican Republic.According to a UNDP study on the socio-economiccontext of the Dominican border region, 156 theborder provinces of Dominican Republic showlevels of poverty higher than the national average.Close to 28% of the Dominican border populationlive in extreme poverty, while 54% live in poverty.The incidence of extreme poverty in the borderzone is twice that of the rest of the country. Inthe Dajabon and Pedernales provinces, extremepoverty reaches 27.6% and 25.9% respectively,while poverty reaches 51.6% and 57.5%. 157 Anotherstudy shows similar results, highlighting the weakerand poorer states of provinces along the border.For example, malnutrition rates for children belowthe age of five are higher in the border provinces(ranging from 16 – 23%) than in the average of thecountry (10%). 158MigrationThe great majority of the migration by landbetween the two countries is Haitians travelling tothe Dominican Republic, both legally and illegally.The limited migration in the opposite direction ismainly Dominican businessmen and skilled labouron short term visits.Large scale short-term and long-term migrationfrom Haiti to the Dominican Republic occursall along the border zone. Some of the Haitianmigrants spread out throughout the DominicanRepublic, looking for work as unskilled labour inHaiti – Dominican Republic: Environmental challenges in the border zone41
- Page 1: Haiti - Dominican RepublicEnvironme
- Page 7 and 8: We congratulate all those who contr
- Page 9: countries. These issues include the
- Page 13: The differing levels of tree cover
- Page 16 and 17: A member of the assessment team col
- Page 18 and 19: Members of the assessment team inte
- Page 20 and 21: Consultation workshops were held in
- Page 22 and 23: Table 1. Key facts and statistics f
- Page 24 and 25: wandering over depleted fields and
- Page 26 and 27: ClimateThe different parts of Hispa
- Page 28 and 29: Natural river flow variability due
- Page 30 and 31: EarthquakesHispaniola is located on
- Page 32: consumption and production culture
- Page 36 and 37: Map 6. The northern coast and the M
- Page 39 and 40: Map 8. The area surrounding the lak
- Page 41: although it is estimated to be much
- Page 45 and 46: e sold for a profit on the other si
- Page 47 and 48: viCase study 2. Comité Intermunici
- Page 49 and 50: Part 2 Identification andAnalysis o
- Page 51 and 52: and local issues. These include, fo
- Page 53: Lacking productive topsoil this lan
- Page 56 and 57: 5 Forest resources andterrestrial p
- Page 58 and 59: Satellite image 3. In the Massacre
- Page 60 and 61: un the risk of being either impriso
- Page 62 and 63: eing transported from the Dominican
- Page 64 and 65: 5.5 Collection of fuel woodFuel woo
- Page 66 and 67: !^5.6 Protected area management and
- Page 68 and 69: locations is contrasted with a degr
- Page 70 and 71: Enough is known, however, to be cer
- Page 72 and 73: plantations that the habitat will n
- Page 74 and 75: Satellite image 6. Just before reac
- Page 76 and 77: interventions if well designed do w
- Page 78 and 79: contaminated rivers are disease vec
- Page 80 and 81: crust substantial enough to be the
- Page 82 and 83: 7 Coastal and marineresources7.1 In
- Page 84 and 85: tuna, sea bream, yellowtail, hake,
- Page 86 and 87: Mangroves are being cut to be sold
- Page 88 and 89: Case study 6. Cooperation between f
- Page 90 and 91: private sector better informed. Cus
Case study 1. Food insecurity in the border zoneSocio-economic surveys of the <strong>Haiti</strong>an side of the two watersheds, Pedernales <strong>and</strong> Massacre, were undertaken by theEarth Institute of Columbia University <strong>and</strong> the <strong>Haiti</strong>an State University. They found that food insecurity was the mainconcern of most households. The lack of sufficient food to cover the daily needs of the population drives much of thecross-border movement, <strong>and</strong> the expansion of detrimental practices, such as charcoal production, seen in these areas.In respect to household concerns, food insecurity was followed by lack of money, bad health <strong>and</strong> poor education.Figure 1 shows the level of food insecurity in the Massacre <strong>and</strong> Pedernales watersheds. It clearly shows that a largemajority of the population are experiencing a lack of sufficient food. ‘Severely food insecure’ is here defined as ahousehold that has experienced running out of food or going to bed hungry at some point over the past 30 days.‘Moderately food insecure’ is defined as a household that has cut back on quantity by reducing the size of meals ornumber of meals, rarely or sometimes, but not running out of food, or going to bed hungry.Figure 1. Food insecurity in the Massacre <strong>and</strong> Pedernales watersheds.Massacre (n=159)Pedernales(n=70)Food SecureSeverely Food InsecureModerately Food InsecureFood SecureSeverely Food InsecureModerately Food InsecureIn terms of demographics, having a higher number of children relates positively to higher food insecurity scores in theMassacre watershed, while gender seems to be independent from food insecurity levels. Interestingly there appear tobe significant differences in food security across eco-zones. There is a higher prevalence of people who are severelyfood insecure in the middle altitude <strong>and</strong> mountainous areas (Figure 2), which suggests important differences in thelivelihood possibilities <strong>and</strong> levels of vulnerability between areas <strong>and</strong> communities in the watershed.Figure 2. Differences in food insecurity within the Pedernales watershedFood security levels across eco-zones -Pedernales (n=70)Food SecureModerately Food SecureSeverely Food InsecureCostal area Middle altitude area Montainous areaLevels of food security also vary throughout the year, with two peaks of food insecurity for each watershed. The firstone occurs at the end of the dry season in March <strong>–</strong> April in the Massacre area <strong>and</strong> slightly later, in May <strong>–</strong> June, inthe Pedernales watershed. The second food insecurity peak is common to the two watersheds <strong>and</strong> takes place inOctober <strong>and</strong> November. It has a more powerful impact on the Massacre watershed (Figure 3).40 <strong>Haiti</strong> <strong>–</strong> <strong>Dominican</strong> <strong>Republic</strong>: Environmental challenges in the border zone


