Activities for the Wireless Dynamics Sensor System - Vernier ...
Activities for the Wireless Dynamics Sensor System - Vernier ...
Activities for the Wireless Dynamics Sensor System - Vernier ...

You also want an ePaper? Increase the reach of your titles
YUMPU automatically turns print PDFs into web optimized ePapers that Google loves.
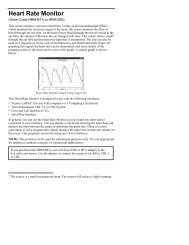
<strong>Activities</strong> <strong>for</strong> <strong>the</strong> <strong>Wireless</strong> <strong>Dynamics</strong> <strong>Sensor</strong> <strong>System</strong>ANSWERS TO ANALYSIS QUESTIONS1. The graphs look very similar, showing that <strong>for</strong>ce and acceleration are closely related.The peaks on one graph occur at <strong>the</strong> same time on each graph.2. Force and acceleration are directly proportional. This relationship can be seen when<strong>the</strong> <strong>for</strong>ce-time and acceleration-time graphs are compared. Also, <strong>the</strong> graph of <strong>for</strong>ce vs.acceleration shows a linear relationship.3. N/(m/s 2 ) = kg4. In Trial 1, <strong>the</strong> mass was 0.7 kg while <strong>the</strong> slope of <strong>the</strong> linear regression line was 0.73N/(m/s 2 ). In Trial 2, <strong>the</strong> mass was 1.20 kg while <strong>the</strong> slope of <strong>the</strong> linear regression linewas 1.21 N/(m/s 2 ). In both cases <strong>the</strong> mass was within <strong>the</strong> uncertainty of <strong>the</strong> fittedslope. The slope corresponds to <strong>the</strong> combined mass of <strong>the</strong> cart, sensors, and anyadded mass.5. F = m a32 © 2007 - <strong>Vernier</strong> Software & Technology