Activities for the Wireless Dynamics Sensor System - Vernier ...
Activities for the Wireless Dynamics Sensor System - Vernier ...
Activities for the Wireless Dynamics Sensor System - Vernier ...

Create successful ePaper yourself
Turn your PDF publications into a flip-book with our unique Google optimized e-Paper software.
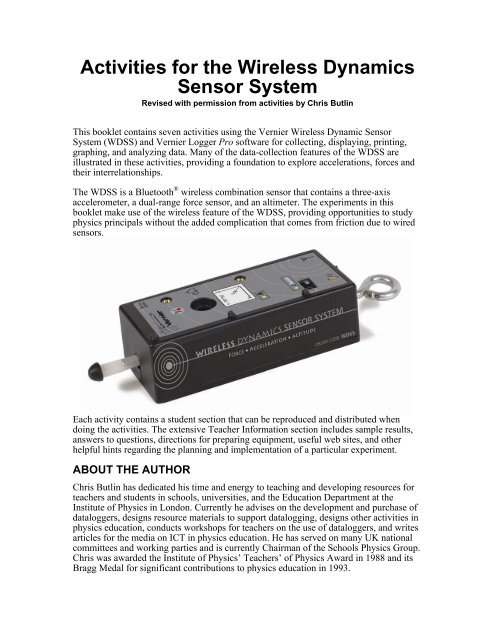
<strong>Activities</strong> <strong>for</strong> <strong>the</strong> <strong>Wireless</strong> <strong>Dynamics</strong> <strong>Sensor</strong> <strong>System</strong>and non-conservative <strong>for</strong>ces in <strong>the</strong> bungee cord.Modeling a bungee jump is not difficult to do once a good match has been found betweena length of rubber cord and whatever is to do <strong>the</strong> ‘jump’ – in this activity <strong>the</strong> WDSS.OBJECTIVESIn this activity, you will investigate• how <strong>the</strong> acceleration of a bungee jumper changes during a jump.• how <strong>the</strong> scalar acceleration is related to <strong>the</strong> individual accelerations during abungee jump.MATERIALSBluetooth ® equipped computerLogger Pro Software<strong>Vernier</strong> <strong>Wireless</strong> <strong>Dynamics</strong> <strong>Sensor</strong> <strong>System</strong>bungee cord (long flexible rubber band)ring stand and right angle clampextra ring stand rodc-clampPROCEDURESetting up your WDSS1. Turn on <strong>the</strong> WDSS. Note <strong>the</strong> name on <strong>the</strong> label of <strong>the</strong> device.2. Make sure Bluetooth is activated on your computer. Some computers have Bluetoothbuilt into <strong>the</strong>m. If that is <strong>the</strong> case, make sure Bluetooth is turned on.3. Start Logger Pro.4. Establish a wireless connection with <strong>the</strong> WDSS.a. Choose Connect Interface from <strong>the</strong> Experiment menu. Choose <strong>Wireless</strong> and <strong>the</strong>nScan <strong>for</strong> <strong>Wireless</strong> Device.b. There will be a short delay while Logger Pro attempts to establish a connection. If<strong>the</strong> WDSS is not found, try scanning again.c. A dialog box will appear showing your WDSS on <strong>the</strong> list of available devices.Select your WDSS device and <strong>the</strong>n click . Once a connection is made, <strong>the</strong>two LEDs on <strong>the</strong> WDSS will be lit green.5. Open <strong>the</strong> file “Scalar Acceleration” in <strong>the</strong> Probes & <strong>Sensor</strong>s/WDSS folder.4 © 2007 - <strong>Vernier</strong> Software & Technology
<strong>Activities</strong> <strong>for</strong> <strong>the</strong> <strong>Wireless</strong> <strong>Dynamics</strong> <strong>Sensor</strong> <strong>System</strong>6. Choose Data Collection from <strong>the</strong> Experiment menu.Adjust <strong>the</strong> data collection experiment length to 10seconds with a sampling rate of 200 samples/second asshown in Figure 3.The Bungee Jump7. Attach <strong>the</strong> bungee to <strong>the</strong> hook on <strong>the</strong> WDSS, so that <strong>the</strong>x-axis acceleration arrow points towards <strong>the</strong> floor.8. Attach <strong>the</strong> o<strong>the</strong>r end of <strong>the</strong> bungee cord to <strong>the</strong> ringstand support rod. Adjust <strong>the</strong> length of <strong>the</strong> rubber cordso when <strong>the</strong> WDSS is dropped from <strong>the</strong> height of <strong>the</strong>support rod, it does not hit <strong>the</strong> floor.9. Collect acceleration data.a. Hold <strong>the</strong> WDSS by <strong>the</strong> hook connected to <strong>the</strong> bungee.The x-axis acceleration arrow should be pointingtowards <strong>the</strong> floor as shown in Figure 4.b. Bring <strong>the</strong> hook up even with <strong>the</strong> ring stand support rod.c. Click to begin data collection. Wait about onesecond <strong>the</strong>n release <strong>the</strong> WDSS.Figure 3QUESTIONS1. Describe <strong>the</strong> key features of <strong>the</strong> acceleration-time graphs<strong>for</strong> each axis of <strong>the</strong> accelerometer.2. Describe <strong>the</strong> key features of <strong>the</strong> scalar acceleration-timegraph. How does this graph compare to <strong>the</strong> o<strong>the</strong>racceleration vs. time graphs?Figure 4© 2007 - <strong>Vernier</strong> Software & Technology 5
<strong>Activities</strong> <strong>for</strong> <strong>the</strong> <strong>Wireless</strong> <strong>Dynamics</strong> <strong>Sensor</strong> <strong>System</strong>TEACHER INFORMATIONWDSS Bungee Jumper1. A bungee jump provides an excellent opportunity to let students see a link between<strong>for</strong>ce and acceleration, assuming that <strong>the</strong>y first have an understanding of what eachmeans.2. Here are a number of web sites with in<strong>for</strong>mation on <strong>the</strong> technology of bungeejumping, its history, some fantastic images and <strong>the</strong> physics involved.• Reporter’s Notebook: South Pacific Ritual Bungee Jumping – This is a newsreport on <strong>the</strong> land diving ritual, <strong>the</strong> Naghol, per<strong>for</strong>med on Pentecost Island, one ofmany making up Vanuatu.http://news.nationalgeographic.com/news/2002/11/1125_021126_TVVanuatu.html• Steve Fettke Bungee Jumping – This site contains lots of bungee facts, detailsabout <strong>the</strong> equipment used, photographs, and videos.http://www.fettke.com/bungee/equip.htm• The Ox<strong>for</strong>d Stunt Factory – This organization per<strong>for</strong>med <strong>the</strong> bungee jump shownin <strong>the</strong> Bond movie Golden Eye. Images of this and o<strong>the</strong>r stunts are available here.http://www.ox<strong>for</strong>dstuntfactory.com/html/stunts.htm• Vertige Aventures – This company manufactures bungee ropes and providesin<strong>for</strong>mation on <strong>the</strong>ir construction.http://www.bungee-jump.com/xvms.htm3. The bungee cord needs to be selected <strong>for</strong> reasonable elasticity. The rubber cord usedin a paddle-ball toy works well <strong>for</strong> this experiment. You can also create a cord byconnecting several smaller rubber bands toge<strong>the</strong>r.4. When discussing <strong>the</strong> accelerometer reading, it is proper to refer to it as a measure ofNormal Force per Unit Mass, with units of N/kg, where “normal” is in <strong>the</strong> directionof that particular accelerometer. This is what <strong>the</strong> accelerometer is actually measuring.(Note that it is not <strong>the</strong> net <strong>for</strong>ce per unit mass which would be acceleration.) Amotionless accelerometer oriented in <strong>the</strong> vertical direction will give a reading of+9.8 N/kg when pointed up and –9.8 N/kg when pointed down. A motionlessaccelerometer oriented in <strong>the</strong> horizontal direction will read 0 N/kg. An accelerometerin freefall will give a value of 0 N/kg regardless of its orientation. Since most peopleprefer <strong>the</strong> measurement be in m/s 2 , we have used <strong>the</strong>se units in this manual.6 © 2007 - <strong>Vernier</strong> Software & Technology
<strong>Activities</strong> <strong>for</strong> <strong>the</strong> <strong>Wireless</strong> <strong>Dynamics</strong> <strong>Sensor</strong> <strong>System</strong>SAMPLE RESULTSWDSS Bungee Jumper (x-axis, y-axis, z-axis, and Scalar acceleration)ANSWERS TO QUESTIONS1. Most of <strong>the</strong> acceleration is along <strong>the</strong> x-axis. While <strong>the</strong> WDSS is in free fall, allaccelerations are zero.2. The students should note <strong>the</strong> periodicity of <strong>the</strong> oscillations and <strong>the</strong> damping effect.They should also note that <strong>the</strong> scalar acceleration is only positive and represents <strong>the</strong>scalar sum of <strong>the</strong> individual accelerations.© 2007 - <strong>Vernier</strong> Software & Technology 7
<strong>Activities</strong> <strong>for</strong> <strong>the</strong> <strong>Wireless</strong> <strong>Dynamics</strong> <strong>Sensor</strong> <strong>System</strong>OBJECTIVESIn this activity, you willFigure 2 – Turntable set up to measure centripetal acceleration• measure <strong>the</strong> centripetal acceleration of a record turntable.• compare <strong>the</strong> measured accelerations to <strong>the</strong> <strong>the</strong>oretical accelerations.MATERIALSBluetooth ® equipped computerLogger Pro Software<strong>Vernier</strong> <strong>Wireless</strong> <strong>Dynamics</strong> <strong>Sensor</strong> <strong>System</strong>phonograph recordturntable (with 33⅓, 45, and 78 rpmsettings)masking tapelevelPROCEDUREEstablish a connection to your WDSS1. Turn on <strong>the</strong> WDSS. Note <strong>the</strong> name on <strong>the</strong> label of <strong>the</strong> device.2. Make sure Bluetooth is activated on your computer. Some computers have Bluetoothbuilt into <strong>the</strong>m. If that is <strong>the</strong> case, make sure Bluetooth is turned on.3. Start Logger Pro.4. Establish a wireless connection with <strong>the</strong> WDSS.a. Choose Connect Interface from <strong>the</strong> Experiment menu. Choose <strong>Wireless</strong> and <strong>the</strong>nScan <strong>for</strong> <strong>Wireless</strong> Device.b. There will be a short delay while Logger Pro attempts to establish a connection. If<strong>the</strong> WDSS is not found, try scanning again.c. A dialog box will appear showing your WDSS on <strong>the</strong> list of available devices.Select your WDSS device and <strong>the</strong>n click . Once a connection is made, <strong>the</strong>two LEDs on <strong>the</strong> WDSS will be lit green.© 2007 - <strong>Vernier</strong> Software & Technology 9
<strong>Activities</strong> <strong>for</strong> <strong>the</strong> <strong>Wireless</strong> <strong>Dynamics</strong> <strong>Sensor</strong> <strong>System</strong><strong>Sensor</strong> and Data Collection Setup5. Choose Set Up <strong>Sensor</strong>s from <strong>the</strong> Experiments menu and<strong>the</strong>n select your WDSS device. This will display <strong>the</strong>WDSS setup dialog that will allow you to turn sensors onor off. Set up <strong>the</strong> sensors as indicated in Figure 3.6. Choose Data Collection from <strong>the</strong> Experiment menu.Adjust <strong>the</strong> data collection experiment length to 60seconds with a sampling rate of 200 samples/second.7. Place <strong>the</strong> WDSS on a level surface with <strong>the</strong> power switchlocated at <strong>the</strong> top. Click to zero <strong>the</strong> sensor.Figure 3Collecting Data8. Set up <strong>the</strong> experiment.a. Place <strong>the</strong> turntable on a level surface. Check to make sure that <strong>the</strong> turntable platteris horizontal using a level.b. Place a phonograph record on <strong>the</strong> turntable.c. Position <strong>the</strong> WDSS so that two of <strong>the</strong> corners are at <strong>the</strong> edge of <strong>the</strong> record while<strong>the</strong> x-axis acceleration arrow is pointing towards <strong>the</strong> center of turntable. Secure <strong>the</strong>WDSS with tape.d. Set <strong>the</strong> turntable speed to 33⅓ rpm.9. You are now ready to collect data <strong>for</strong> <strong>the</strong> three different angular speeds of <strong>the</strong>turntable.a. Click to begin data collection.b. Wait about 5 seconds <strong>the</strong>n turn on <strong>the</strong> turntable.c. Wait an additional 15 seconds <strong>the</strong>n increase <strong>the</strong> speed of <strong>the</strong> turntable to 45 rpm.d. Wait an additional 15 seconds <strong>the</strong>n increase <strong>the</strong> speed to 78 rpm.e. Wait an additional 15 seconds <strong>the</strong>n turn <strong>the</strong> turntable off.f. Wait <strong>for</strong> data collection to finish.10. Once <strong>the</strong> turntable has stopped rotating, measure <strong>the</strong> distance (in meters) from <strong>the</strong>center of <strong>the</strong> accelerometer label on <strong>the</strong> WDSS to <strong>the</strong> center of <strong>the</strong> turntable. Recordthis value in <strong>the</strong> table provided.DATA TABLEAngular Speed(rpm)Average Centripetal Acceleration(m/s 2 )33⅓457810 © 2007 - <strong>Vernier</strong> Software & Technology
<strong>Activities</strong> <strong>for</strong> <strong>the</strong> <strong>Wireless</strong> <strong>Dynamics</strong> <strong>Sensor</strong> <strong>System</strong>Radius (m)Angular Speed(rpm)33⅓4578Time <strong>for</strong> one Revolution(s)Theoretical CentripetalAcceleration(m/s 2 )QUESTIONS1. What are <strong>the</strong> average values of <strong>the</strong> x-axis acceleration <strong>for</strong> each speed of rotation?Record <strong>the</strong>se values in <strong>the</strong> table provided.2. For each angular speed, calculate <strong>the</strong> time <strong>for</strong> one revolution in seconds.3. Calculate <strong>the</strong> centripetal accelerations expected with each of <strong>the</strong> turntable speeds.How do <strong>the</strong>se values compare to <strong>the</strong> average accelerations you measured?4. In terms of <strong>the</strong> g-factor, what is <strong>the</strong> greatest g-factor achieved in this activity? (Note:a centripetal acceleration of +9.8 m/s 2 is equivalent to +1g.)5. How might you increase <strong>the</strong> maximum g-factor on this turntable without increasingits angular speed?© 2007 - <strong>Vernier</strong> Software & Technology 11
<strong>Activities</strong> <strong>for</strong> <strong>the</strong> <strong>Wireless</strong> <strong>Dynamics</strong> <strong>Sensor</strong> <strong>System</strong>TEACHER INFORMATIONCentripetal Accelerations on a ModelCentrifuge1. Special thanks to QinetiQ of Cody Technology Park, Farnborough, Hampshire, UK,<strong>for</strong> providing <strong>the</strong> photograph of <strong>the</strong>ir man-carrying centrifuge.2. The man-carrying centrifuge is a piece of equipment that was used in <strong>the</strong> James Bondfilm Moonraker. Hugo Drax, <strong>the</strong> villain, tried to kill 007 by accelerating him beyond<strong>the</strong> level of human endurance.3. Web sites with in<strong>for</strong>mation on both acceleration and centripetal acceleration.• Wikipedia – this site provides an explanation of what is meant by “g” and why itsvalue is as it is. Details are provided of situations in which one can experience bothhigh positive and negative g <strong>for</strong>ces, as well as 0g.http://en.wikipedia.org/wiki/Acceleration_due_to_gravity• Aerodynamics and G <strong>for</strong>ces – this site discusses G <strong>for</strong>ces experienced by F-16fighter pilots and <strong>the</strong> effects on <strong>the</strong>m.http://www.voodoo.cz/falcon/agf.html• Dream comes true with space flight – this site provides a transcript of a discussionwith Dr. Greg Olsen following his trip to <strong>the</strong> International Space Station in 2005.http://newstranscript.gmnews.com/news/2006/0125/Front_Page/001.html• QinetiQ helps ‘space tourist’ Greg Olsen pass <strong>the</strong> physical – this site provides areport on <strong>the</strong> training provided <strong>for</strong> Dr. Greg Olsen in QinetiQ’s man-carryingcentrifuge.http://www.qinetiq.com/home/newsroom/news_releases_homepage/2005/3rd_quarter/qinetiq_helps__space.html• QinetiQ’s Centrifuge – this site provides a video of <strong>the</strong> QinetiQ centrifuge inaction.http://www.qinetiq.com/home/technologies/technologies/Sub_Landing1/facilities/centrifuge.html4. When discussing <strong>the</strong> accelerometer reading, it is proper to refer to it as a measure ofNormal Force per Unit Mass, with units of N/kg, where “normal” is in <strong>the</strong> directionof that particular accelerometer. This is what <strong>the</strong> accelerometer is actually measuring.(Note that it is not <strong>the</strong> net <strong>for</strong>ce per unit mass which would be acceleration.) Amotionless accelerometer oriented in <strong>the</strong> vertical direction will give a reading of+9.8 N/kg when pointed up and –9.8 N/kg when pointed down. A motionlessaccelerometer oriented in <strong>the</strong> horizontal direction will read 0 N/kg. An accelerometerin freefall will give a value of 0 N/kg regardless of its orientation. Since most peopleprefer <strong>the</strong> measurement be in m/s 2 , we have used <strong>the</strong>se units in this manual.5. The acceleration graph will probably show a cyclic time variation. This once-aroundvariation in <strong>the</strong> acceleration value is likely to be due to <strong>the</strong> record wobbling or <strong>the</strong>turntable not being level.12 © 2007 - <strong>Vernier</strong> Software & Technology
<strong>Activities</strong> <strong>for</strong> <strong>the</strong> <strong>Wireless</strong> <strong>Dynamics</strong> <strong>Sensor</strong> <strong>System</strong>SAMPLE RESULTSCentripetal acceleration dataAverage acceleration at 33 ⅓ rpmAverage acceleration at 45 rpmAverage acceleration at 78 rpmAngular Speed(rpm)Average Centripetal Acceleration(m/s 2 )33⅓ 1.1045 1.9578 5.57© 2007 - <strong>Vernier</strong> Software & Technology 13
<strong>Activities</strong> <strong>for</strong> <strong>the</strong> <strong>Wireless</strong> <strong>Dynamics</strong> <strong>Sensor</strong> <strong>System</strong>Radius (m) 0.085Angular Speed(rpm)Time <strong>for</strong> one Revolution(s)Theoretical CentripetalAcceleration(m/s 2 )33⅓ 1.80 1.0445 1.33 1.8978 0.77 5.66ANSWERS TO QUESTIONS1. See Table2. See Table3. See Table. The values are in close agreement.4. 0.78 g5. Position <strong>the</strong> WDSS fur<strong>the</strong>r away from <strong>the</strong> center of <strong>the</strong> turntable.14 © 2007 - <strong>Vernier</strong> Software & Technology
<strong>Activities</strong> <strong>for</strong> <strong>the</strong> <strong>Wireless</strong> <strong>Dynamics</strong> <strong>Sensor</strong> <strong>System</strong>Mission to Titan – InvestigatingSurface CompositionThe Cassini-Huygens mission to Saturn and its moons began back in October 1997 with alaunch from Cape Canaveral. Seven years later on Thursday, July 1, 2004, <strong>the</strong> Cassiniorbiter with its Titan probe Huygens (see Figure 1), went into orbit around Saturn. OnChristmas Day 2004 <strong>the</strong> 318 kg Huygens probe was released from <strong>the</strong> orbiter and enteredTitan’s atmosphere on January 14, 2005, landing shortly afterwards on this moon’ssurface. The Huygens probe, named after <strong>the</strong> Dutch physicist and astronomer ChristiaanHuygens (1629 – 1695) who discovered Titan in 1655, was designed to investigateTitan’s atmosphere and surface. One experiment involved investigating <strong>the</strong> compositionof Titan’s surface. As <strong>the</strong> Huygens probe made contact with <strong>the</strong> surface of Titan, a <strong>for</strong>cesensor (or penetrometer) collected data that was to give scientists an idea of <strong>the</strong>composition of Titan’s surface. A graph of this data is show in Figure 2.Figure 1Courtesy Planetary and Space SciencesResearch Institute, The Open University,Milton Keynes, UKFigure 2Courtesy Ru<strong>the</strong>r<strong>for</strong>d AppletonLaboratory Space Electronics Groupand <strong>the</strong> Planetary and Space SciencesResearch Institute at <strong>the</strong> OpenUniversityIn this activity, you will create a penetrometer using <strong>the</strong> <strong>for</strong>ce probe on <strong>the</strong> WDSS. Yourtask will be to generate model graphs of various surfaces that you will compare with <strong>the</strong>data received from <strong>the</strong> Huygens’ probe to <strong>for</strong>m a hypo<strong>the</strong>sis as to <strong>the</strong> surface compositionof Titan.© 2007 - <strong>Vernier</strong> Software & Technology 15
<strong>Activities</strong> <strong>for</strong> <strong>the</strong> <strong>Wireless</strong> <strong>Dynamics</strong> <strong>Sensor</strong> <strong>System</strong>OBJECTIVESIn this activity, you will• Collect <strong>for</strong>ce-time data <strong>for</strong> a penetrometer impacting various simulated surfaceconditions.• Develop a hypo<strong>the</strong>sis based on your research as to <strong>the</strong> composition of Titan’ssurface at <strong>the</strong> location where <strong>the</strong> Huygens probe landed.MATERIALSBluetooth ® equipped computersoil container (at least 10 cm deep)Logger Pro Softwaresample soils – clay, fine gravel, fine grit,<strong>Vernier</strong> <strong>Wireless</strong> <strong>Dynamics</strong> <strong>Sensor</strong> <strong>System</strong> and sand10 cm length of PVC pipe (should allow burette clampWooden dowel to slide freely inside) metric ruler35 cm wooden dowel (3/8”) with bolt glued clo<strong>the</strong>s pinto <strong>the</strong> end (1” bolt (1/4 – 20 thread)) ring standPROCEDUREEstablish a connection to your WDSS1. Turn on <strong>the</strong> WDSS. Note <strong>the</strong> name on <strong>the</strong> label of <strong>the</strong>device.2. Make sure Bluetooth is activated on your computer. Somecomputers have Bluetooth built into <strong>the</strong>m. If that is <strong>the</strong>case, make sure Bluetooth is turned on.3. Start Logger Pro.4. Establish a wireless connection with <strong>the</strong> WDSS.a. Choose Connect Interface from <strong>the</strong> Experiment menu.Choose <strong>Wireless</strong> and <strong>the</strong>n Scan <strong>for</strong> <strong>Wireless</strong> Device.b. There will be a short delay while Logger Pro attempts toestablish a connection. If <strong>the</strong> WDSS is not found, tryscanning again.c. A dialog box will appear showing your WDSS on <strong>the</strong>list of available devices. Select your WDSS device and<strong>the</strong>n click . Once a connection is made, <strong>the</strong> twoLEDs on <strong>the</strong> WDSS will be lit green.Figure 3<strong>Sensor</strong> and Data Collection Setup5. Choose Set Up <strong>Sensor</strong>s from <strong>the</strong> Experiments menu and <strong>the</strong>n select your WDSSdevice. Set up <strong>the</strong> WDSS sensors to use only Force.6. Click below <strong>the</strong> <strong>for</strong>ce sensor and select Reverse Direction. This will make<strong>the</strong> <strong>for</strong>ce sensor report positive values <strong>for</strong> <strong>for</strong>ces that push <strong>the</strong> bumper towards <strong>the</strong>sensor.7. Choose Data Collection from <strong>the</strong> Experiment menu. Adjust <strong>the</strong> data collectionexperiment length to 500 milliseconds with a sampling rate of 1 samples/millisecond.16 © 2007 - <strong>Vernier</strong> Software & Technology
<strong>Activities</strong> <strong>for</strong> <strong>the</strong> <strong>Wireless</strong> <strong>Dynamics</strong> <strong>Sensor</strong> <strong>System</strong>Also, uncheck <strong>the</strong> Sample at Time Zero box if it is selected.8. Click on <strong>the</strong> Triggering tab and set up <strong>the</strong> WDSS to triggerand begin recording data when <strong>the</strong> <strong>for</strong>ce increases above0.1 N as indicated in Figure 4.The Simulated Landings9. Attach <strong>the</strong> PVC tubing to <strong>the</strong> ring stand using <strong>the</strong> buretteclamp. Be sure <strong>the</strong> tubing is directly above <strong>the</strong> base of <strong>the</strong>stand. Insert <strong>the</strong> wooden dowel into <strong>the</strong> PVC tubing with<strong>the</strong> threaded end pointing down towards <strong>the</strong> ring standbase.10. Screw <strong>the</strong> bumper into <strong>the</strong> <strong>for</strong>ce sensor end of <strong>the</strong> WDSS.Thread <strong>the</strong> WDSS onto <strong>the</strong> wooden dowel using <strong>the</strong>mounting hole at <strong>the</strong> end opposite <strong>the</strong> bumper. Align <strong>the</strong>bumper so it is centered above <strong>the</strong> base of <strong>the</strong> ring stand.Raise <strong>the</strong> WDSS as high as it can go and hold it in placewith <strong>the</strong> clo<strong>the</strong>s pin.Figure 411. Fill <strong>the</strong> soil container 10 cm deep with <strong>the</strong> first test soil. (Since you will be testing allfour types of soil, it does not matter which is done first.) Place <strong>the</strong> soil container on<strong>the</strong> base of <strong>the</strong> ring stand so <strong>the</strong> container is centered directly below <strong>the</strong> WDSS.12. Clickto zero <strong>the</strong> <strong>for</strong>ce sensor.13. Hold <strong>the</strong> wooden dowel and remove <strong>the</strong> clo<strong>the</strong>s pin. Click to prepare <strong>the</strong>WDSS <strong>for</strong> data collection. (The graph will display <strong>the</strong> message “Waiting <strong>for</strong> Trig geror Data…”) Release <strong>the</strong> dowel and allow <strong>the</strong> WDSS to impact <strong>the</strong> soil sample. Whendata collection is complete, raise and secure <strong>the</strong> WDSS to its highest position with <strong>the</strong>clo<strong>the</strong>s pin.14. Study <strong>the</strong> <strong>for</strong>ce-time graph (impact signature) carefully. Pay close attention to how<strong>the</strong> impact <strong>for</strong>ce changes with time and how fast <strong>the</strong> changes take place. You maywant to repeat Step 12 – 13 several times to be sure you understand <strong>the</strong> characteristicsof <strong>the</strong> impact signature <strong>for</strong> this type of soil. Save at least one of your <strong>for</strong>ce-timegraphs by choosing Store Latest Run from <strong>the</strong> Experiments Menu.15. Repeat Steps 11 – 14 using <strong>the</strong> o<strong>the</strong>r three soil samples.QUESTIONS1. Sketch a typical impact signature <strong>for</strong> each of <strong>the</strong> soils you tested. Label <strong>the</strong> keyfeatures of <strong>the</strong> graphs.2. Review <strong>the</strong> Huygens’ probe data. Based on <strong>the</strong> results of your tests, hypo<strong>the</strong>size as to<strong>the</strong> composition of <strong>the</strong> soil on Titan. Defend your hypo<strong>the</strong>sis.3. Describe <strong>the</strong> limitations of this procedure <strong>for</strong> determining <strong>the</strong> composition of Titan’ssoil at <strong>the</strong> location of impact.4. Describe changes to this experiment and additional tests you would recommend totest your hypo<strong>the</strong>sis.© 2007 - <strong>Vernier</strong> Software & Technology 17
<strong>Activities</strong> <strong>for</strong> <strong>the</strong> <strong>Wireless</strong> <strong>Dynamics</strong> <strong>Sensor</strong> <strong>System</strong>TEACHER INFORMATIONMission to Titan – InvestigatingSurface Composition1. Special thanks to Professor John Zarnecki and Mr. Mark Leese of <strong>the</strong> Planetary andSpace Sciences Research Institute at <strong>the</strong> Open University, Milton Keynes, UK, andDr Ralph Lorenz of <strong>the</strong> Space Department, Planetary Exploration Group, JohnHopkins University, USA, <strong>for</strong> <strong>the</strong>ir help in developing this activity.2. In preparing <strong>the</strong> soil samples, use modeling clay, playground sand, fine grit (<strong>for</strong> usein a bird cage), and fine gravel (<strong>for</strong> use in an aquarium). It is recommended that yousieve <strong>the</strong> gravel so that it has a particle size between about 2.36mm and 5mm.3.4.When collecting data using <strong>the</strong> playground sand, make sure that <strong>the</strong> sand is notcompacted. If <strong>the</strong> sand is compacted, mix it up to reduce compacting.The following figure shows Huygens data with annotations.Impact signature –Courtesy Ru<strong>the</strong>r<strong>for</strong>d Appleton Laboratory Space Electronics Groupand <strong>the</strong> Planetary and Space Sciences Research Institute at <strong>the</strong> Open University5. Professor John Zarnecki, Principal Investigator <strong>for</strong> <strong>the</strong> Surface Science Package, onseeing <strong>the</strong> impact signature, said: “A crust and a pebble will give you an initial peak,but <strong>the</strong> match looks better with a pebble and, if we’re seeing lots of <strong>the</strong>m in <strong>the</strong>ground image it’s hardly fanciful that we’ve bashed one of <strong>the</strong>m”. His comments arebased on <strong>the</strong> tests scientists at <strong>the</strong> Planetary and Space Science Research Institute at<strong>the</strong> Open University did subsequent to <strong>the</strong> landing, trying to reproduce <strong>the</strong> Force-timegraph with various combinations of materials.18 © 2007 - <strong>Vernier</strong> Software & Technology
<strong>Activities</strong> <strong>for</strong> <strong>the</strong> <strong>Wireless</strong> <strong>Dynamics</strong> <strong>Sensor</strong> <strong>System</strong>6. Here are a number of web sites with in<strong>for</strong>mation on <strong>the</strong> Cassini-Huygens mission.• British National Space Centre (BNSC) – Cassini-Huygenshttp://www.bnsc.gov.uk/default.aspx?nid=4395• Cassini-Huygens card models to makehttp://www.nasa.gov/pdf/59402main_model_simple.pdfhttp://www.nasa,gov/pdf/59403main_model_challenging.pdf• ESA Cassini-Huygenshttp://www.esa.int/SPECIALS/Cassini-Huygens/• Mission: Cassini-Huygenshttp://www.uk2planets.org.uk/m_cassini.htm• NASA Cassini-Huygens Mission to Saturn and Titanhttp://saturn.jpl.nasa.gov/home/index.cfm• Open University , Planetary and Space Sciences Research Institutehttp://pssri.open.ac.uk/missions/mis-casa1.htm• PPARC Cassini-Huygens School Resourceshttp://www.pparc.ac.uk/Ed/ch/Home.htm• Ralph Lorenz’s web site – This site includes a document that describes an impactpenetrometer <strong>for</strong> a landing spacecraft.http://www.lpl.arizona.edu/~rlorenz/http://www.lpl.arizona.edu/~rlorenz/acce.pdf• UK Cassini-Huygens Press Conferencehttp://pssri.open.ac.uk/missions/UK%20C-H%20Press%20Conf/UK%20C-H%20Press%20Conf%203%20June%2004.pdf7. Here are some useful book and periodicals <strong>for</strong> additional background in<strong>for</strong>mation andsubsequent updates in in<strong>for</strong>mation.• Lifting Titan’s Veil. Ralph Lorenz and Jacqueline Mitton. Cambridge UniversityPress 2002.• Mission to Saturn: Cassini and <strong>the</strong> Huygens Probe. David M Harland. Springer-Verlag 2002.• Frontiers. Free magazine on UK particle physics, astronomy and space science.Available from Strategic Planning and Communications, Particle Physics andAstronomy Research Council (PPARC), Polaris House, North Star Avenue,Swindon SN2 1SZ.• ESA Bulletin. Free magazine from <strong>the</strong> European Space Agency (ESA). Availablefrom ESA Publications Division, c/o ESTEC, PO Box 299, 2200 AG Noordwijk,The Ne<strong>the</strong>rlands.• Astronomy Now, UK Periodical available at newsstands.(http://www.astronomynow.com/)© 2007 - <strong>Vernier</strong> Software & Technology 19
<strong>Activities</strong> <strong>for</strong> <strong>the</strong> <strong>Wireless</strong> <strong>Dynamics</strong> <strong>Sensor</strong> <strong>System</strong>SAMPLE RESULTSLoose SandFine GritFine GravelClayANSWERS TO QUESTIONS1. The students should notice that <strong>the</strong> impact signatures show high <strong>for</strong>ces over shorttimes <strong>for</strong> harder surfaces and lower <strong>for</strong>ces over longer times <strong>for</strong> more spongysurfaces.2. Answers will vary.3. In this activity, <strong>the</strong> students are not using <strong>the</strong> same equipment as used by <strong>the</strong> researchteam.4. Using a <strong>for</strong>ce sensor identical to that on Huygens to sample different soils (includingcombinations of soils) to try and reproduce <strong>the</strong> impact signature. Un<strong>for</strong>tunately such asensor is most likely not available.20 © 2007 - <strong>Vernier</strong> Software & Technology
<strong>Activities</strong> <strong>for</strong> <strong>the</strong> <strong>Wireless</strong> <strong>Dynamics</strong> <strong>Sensor</strong> <strong>System</strong>Physics at Amusement ParksThere are few who would turn down an opportunity to learn some physics throughamusement park rides. They are usually great fun and are absolutely full of physics todiscuss in advance and afterwards. The rides may be at local fairgrounds or at large<strong>the</strong>me parks (such as Six Flags or Great America). Some of <strong>the</strong>se rides can usuallyprovide <strong>the</strong> basics of ‘freefall’ drops, spins and rotations in <strong>the</strong> horizontal plane,‘pendulum’ swings, and ‘up and overs’ with and without extra rotations. Some of <strong>the</strong>seare shown below.The images (from left to right) are <strong>the</strong> Drop Zone (freefall accelerations), and HMBEndeavor (pendulum), and Celebration (swings)The most useful sensors <strong>for</strong> such activities are <strong>the</strong> accelerometers and <strong>the</strong> altimeter. As itdifficult to predict precisely which accelerometer(s) will be most useful, you willmeasure accelerations using all three accelerometers. Once you are back in <strong>the</strong> classroom,you can select which of <strong>the</strong>se data make <strong>the</strong> most sense to study <strong>for</strong> each ride. Thealtimeter is useful when analyzing <strong>the</strong> graphs of acceleration vs. time. After your visit,<strong>the</strong> altimeter data can help you identify <strong>the</strong> feature of <strong>the</strong> ride you are trying to study.OBJECTIVESIn this activity, you will• measure accelerations in a real world setting.• compare <strong>the</strong> different accelerations produced by various amusement park rides.MATERIALSBluetooth ® equipped computerLogger Pro Software<strong>Vernier</strong> <strong>Wireless</strong> <strong>Dynamics</strong> <strong>Sensor</strong> <strong>System</strong><strong>Vernier</strong> Data Vest or elastic cord <strong>for</strong>holding <strong>the</strong> WDSSstopwatchPROCEDUREPart I – Be<strong>for</strong>e you go to <strong>the</strong> amusement park1. Turn on <strong>the</strong> WDSS. Note <strong>the</strong> name on <strong>the</strong> label of <strong>the</strong> device.© 2007 - <strong>Vernier</strong> Software & Technology 21
<strong>Activities</strong> <strong>for</strong> <strong>the</strong> <strong>Wireless</strong> <strong>Dynamics</strong> <strong>Sensor</strong> <strong>System</strong>2. Make sure Bluetooth is activated on your computer. Some computers have Bluetoothbuilt into <strong>the</strong>m. If that is <strong>the</strong> case, make sure Bluetooth is turned on.3. Start Logger Pro.4. Establish a wireless connection with <strong>the</strong> WDSS.a. Choose Connect Interface from <strong>the</strong> Experiment menu. Choose <strong>Wireless</strong> and <strong>the</strong>nScan <strong>for</strong> <strong>Wireless</strong> Device.b. There will be a short delay while Logger Pro attempts to establish a connection. If<strong>the</strong> WDSS is not found, try scanning again.c. A dialog box will appear showing your WDSS on <strong>the</strong> list of available devices.Select your WDSS device and <strong>the</strong>n click . Once a connection is made, <strong>the</strong>two LEDs on <strong>the</strong> WDSS will be lit green.5. Open <strong>the</strong> file “Amusement Park” from <strong>the</strong> Probes & <strong>Sensor</strong>s/WDSS folder.6. Set up <strong>the</strong> WDSS <strong>for</strong> remote data collection.a. Choose Remote Setup from <strong>the</strong> Experiment menu, and <strong>the</strong>n choose your WDSS.b. Select <strong>the</strong> option Disable Stop Button During Remote Data Collection.c. Click to exit this dialog box and use <strong>the</strong> WDSS <strong>for</strong> remote data collection.The WDSS disconnects from <strong>the</strong> computer and readings from <strong>the</strong> WDSS no longerappears on <strong>the</strong> Logger Pro toolbar. The Bluetooth connection LED on <strong>the</strong> WDSSwill turn steady red, indicating that <strong>the</strong> WDSS is no longer communicating with<strong>the</strong> computer.7. Turn off <strong>the</strong> WDSS, connect it to <strong>the</strong> power adapter, and allow it to fully charge.Part II – At <strong>the</strong> Amusement Park8. Be<strong>for</strong>e each ride, look <strong>for</strong> specific features on <strong>the</strong> ride that you are interested in. Use astopwatch to determine approximately when in <strong>the</strong> ride <strong>the</strong>se features occur. Recordthis in<strong>for</strong>mation along with o<strong>the</strong>r ride details in your lab notebook.9. Turn on <strong>the</strong> WDSS and check to be sure <strong>the</strong> data collection LED is steady green.Orient <strong>the</strong> WDSS so <strong>the</strong> x-axis accelerometer arrow is pointing straight up and <strong>the</strong>On/Off switch directed away from you. You are now ready to get on <strong>the</strong> ride.10. Once properly seated on <strong>the</strong> ride, start data collection by pressing <strong>the</strong> Start/Stopbutton ( ) on <strong>the</strong> WDSS. The button is slightly recessed to prevent accidentalpressing. You need to press <strong>the</strong> button carefully to make sure you start <strong>the</strong> datacollection run. The Data Collection LED will change from steady green to flashinggreen during data collection.11. Once data collection is complete, <strong>the</strong> Data Collection LED will flash red and <strong>the</strong>nturn steady green, indicating data are stored. As long as <strong>the</strong> data collection light turnssteady green, you have enough memory to complete ano<strong>the</strong>r full data collection run.If <strong>the</strong> light becomes steady red, you will not be able to complete ano<strong>the</strong>r full data run.12. Repeat Steps 8 – 11 <strong>for</strong> o<strong>the</strong>r rides as directed by your teacher.13. Turn off <strong>the</strong> WDSS when you are finished collecting data.22 © 2007 - <strong>Vernier</strong> Software & Technology
<strong>Activities</strong> <strong>for</strong> <strong>the</strong> <strong>Wireless</strong> <strong>Dynamics</strong> <strong>Sensor</strong> <strong>System</strong>Part III – Back from <strong>the</strong> Amusement Park14. Turn on <strong>the</strong> WDSS. Make sure Bluetooth is activated on your computer.15. Start Logger Pro and open <strong>the</strong> file “Amusement Park” from <strong>the</strong> Probes & <strong>Sensor</strong>s –WDSS folder.16. From <strong>the</strong> Experiment menu, choose Remote►Retrieve Remote Data and <strong>the</strong>n <strong>the</strong>name of your WDSS. If your WDSS is not listed, choose <strong>the</strong> Scan <strong>for</strong> <strong>Wireless</strong>Device option. Click to retrieve <strong>the</strong> data. Choose <strong>the</strong> option to retrieve your datainto <strong>the</strong> current file and click .17. When <strong>the</strong> Remote Data Retrieval dialog is displayed, it lists all data runs on <strong>the</strong>WDSS. Select <strong>the</strong> data you want to retrieve from <strong>the</strong> WDSS and click . Youcan retrieve data without deleting it, so that <strong>the</strong> data could be retrieved to severaldifferent computers.QUESTIONS1. Prepare a presentation describing <strong>the</strong> physics of <strong>the</strong> rides you went on. Be sure toinclude graphs that help explain <strong>the</strong> accelerations a rider experiences on each ride.© 2007 - <strong>Vernier</strong> Software & Technology 23
<strong>Activities</strong> <strong>for</strong> <strong>the</strong> <strong>Wireless</strong> <strong>Dynamics</strong> <strong>Sensor</strong> <strong>System</strong>TEACHER INFORMATIONPhysics at Amusement Parks1. Amusement parks and fairgrounds provide excellent opportunities to let studentsexperience accelerations and energy transfers through drops, swings, and rotations.For better understanding of <strong>the</strong> physics behind <strong>the</strong> rides, it is best to limit <strong>the</strong> numberof rides each group should study.2. As with any activity it is essential to make risk assessments bearing in mind <strong>the</strong> typeof activities to be engaged in and who <strong>the</strong> students are. Ensure <strong>the</strong>re are enough staffto supervise and that <strong>the</strong>y have ‘presence.’ Some students should not, on healthgrounds, go on some rides, so make sure that this is checked out in advance.3. The maximum number of runs you can collect on a WDSS is 20.4. Unless <strong>the</strong> height of drop is large, <strong>the</strong> extent of <strong>the</strong> free-fall will be very limited andso a value of around 0 m/s 2 is likely to be noted <strong>for</strong> only a short time. Pendulum typeswings are useful to investigate, particularly if <strong>the</strong> full extent of <strong>the</strong> swings takes onefrom horizontal to near vertical and back. Up and over rotations provide interestingdata, as do rotations in <strong>the</strong> horizontal plane. Some rides incorporate twists intorotations and <strong>the</strong>se tend to make interpretation of <strong>the</strong> data more awkward.5. The altimeter readings will be relative to <strong>the</strong> initial altitude measurement.6. When discussing <strong>the</strong> accelerometer reading, it is proper to refer to it as a measure ofNormal Force per Unit Mass, with units of N/kg, where “normal” is in <strong>the</strong> directionof that particular accelerometer. This is what <strong>the</strong> accelerometer is actually measuring.(Note that it is not <strong>the</strong> net <strong>for</strong>ce per unit mass which would be acceleration.) Amotionless accelerometer oriented in <strong>the</strong> vertical direction will give a reading of+9.8 N/kg when pointed up and –9.8 N/kg when pointed down. A motionlessaccelerometer oriented in <strong>the</strong> horizontal direction will read 0 N/kg. An accelerometerin freefall will give a value of 0 N/kg regardless of its orientation. Since most peopleprefer <strong>the</strong> measurement be in m/s 2 , we have used <strong>the</strong>se units in this manual.7. Here are a number of web sites with in<strong>for</strong>mation on amusement park physics.• Data collection at <strong>the</strong> Amusement Park – some additional resources from <strong>Vernier</strong>http://www.vernier.com/cmat/datapark.html• Amusement Park Physics – this site has material related to carousel, roller coaster,freefall, pendulum, and bumper car rides.http://www.learner.org/exhibits/parkphysics/• Education Related Amusement Park Physics Linkshttp://www.newton.dep.anl.gov/app/nau_links.htm• The Physics of Amusement Parkshttp://library.thinkquest.org/2745/data/openpark.htm• Theme Park Sites in UK Net Guidehttp://www.uknetguide.co.uk/Entertainment/Theme_Parks/24 © 2007 - <strong>Vernier</strong> Software & Technology
<strong>Activities</strong> <strong>for</strong> <strong>the</strong> <strong>Wireless</strong> <strong>Dynamics</strong> <strong>Sensor</strong> <strong>System</strong>SAMPLE RESULTSCelebration Swings at Great America in Santa Clara, Cali<strong>for</strong>nia<strong>Sensor</strong>s of interest; 3 axis (x, y, and z) accelerometerThe Drop Zone freefall drop at Great America in Santa Clara, Cali<strong>for</strong>nia<strong>Sensor</strong>s of interest; x-axis accelerometer and altimeter© 2007 - <strong>Vernier</strong> Software & Technology 25
<strong>Activities</strong> <strong>for</strong> <strong>the</strong> <strong>Wireless</strong> <strong>Dynamics</strong> <strong>Sensor</strong> <strong>System</strong>The HMB Endeavor pendulum swing at Great America in Santa Clara, Cali<strong>for</strong>nia<strong>Sensor</strong>s of interest; x-axis and z-axis accelerometer and altimeter26 © 2007 - <strong>Vernier</strong> Software & Technology
<strong>Activities</strong> <strong>for</strong> <strong>the</strong> <strong>Wireless</strong> <strong>Dynamics</strong> <strong>Sensor</strong> <strong>System</strong>Newton’s Second LawHow does a cart change its motion when you push and pull on it? You might think that<strong>the</strong> harder you push on a cart, <strong>the</strong> faster it goes. Is <strong>the</strong> cart’s velocity related to <strong>the</strong> <strong>for</strong>ceyou apply? Or does <strong>the</strong> <strong>for</strong>ce just change <strong>the</strong> velocity? Also, what does <strong>the</strong> mass of <strong>the</strong>cart have to do with how <strong>the</strong> motion changes? We know that it takes a much harder pushto get a heavy cart moving than a lighter one.The WDSS’s <strong>for</strong>ce sensor and x-axis accelerometer will let you measure <strong>the</strong> <strong>for</strong>ce on acart simultaneously with <strong>the</strong> cart’s acceleration. The total mass of <strong>the</strong> cart is easy to varyby adding masses. Using <strong>the</strong>se tools, you can determine how <strong>the</strong> net <strong>for</strong>ce on <strong>the</strong> cart, itsmass, and its acceleration are related. This relationship is Newton’s second law ofmotion.Figure 1 – WDSS on a <strong>Vernier</strong> dynamics cart and trackOBJECTIVESIn this activity, you will• collect <strong>for</strong>ce and acceleration data <strong>for</strong> a cart as it is moved back and <strong>for</strong>th.• compare <strong>for</strong>ce-time and acceleration-time graphs.• analyze a graph of <strong>for</strong>ce vs. acceleration.• determine <strong>the</strong> relationship between <strong>for</strong>ce, mass, and acceleration.MATERIALSBluetooth ® equipped computer<strong>Vernier</strong> <strong>Wireless</strong> <strong>Dynamics</strong> <strong>Sensor</strong> <strong>System</strong>Logger Pro Software<strong>Vernier</strong> <strong>Dynamics</strong> <strong>System</strong>PRELIMINARY QUESTIONS1. When you push on an object, how does <strong>the</strong> magnitude of <strong>the</strong> <strong>for</strong>ce affect its motion?If you push harder, is <strong>the</strong> change in motion smaller or larger? Do you think this is adirect or inverse relationship?2. Assume that you have a bowling ball and a baseball, each suspended from a differentrope. If you hit each of <strong>the</strong>se balls with a full swing of a baseball bat, which ball will© 2007 - <strong>Vernier</strong> Software & Technology 27
<strong>Activities</strong> <strong>for</strong> <strong>the</strong> <strong>Wireless</strong> <strong>Dynamics</strong> <strong>Sensor</strong> <strong>System</strong>change its motion by <strong>the</strong> greater amount?3. In <strong>the</strong> absence of friction and o<strong>the</strong>r <strong>for</strong>ces, if you exert a <strong>for</strong>ce, F, on a mass, m, <strong>the</strong>mass will accelerate. If you exert <strong>the</strong> same <strong>for</strong>ce on a mass of 2m, would you expect<strong>the</strong> resulting acceleration to be twice as large or half as large? Is this a direct orinverse relationship?PROCEDURE1. Turn on <strong>the</strong> WDSS. Note <strong>the</strong> name on <strong>the</strong> label of <strong>the</strong> device.2. Make sure Bluetooth is activated on your computer. Some computers have Bluetoothbuilt into <strong>the</strong>m. If that is <strong>the</strong> case, make sure Bluetooth is turned on.3. Start Logger Pro.4. Establish a wireless connection with <strong>the</strong> WDSS.a. Choose Connect Interface from <strong>the</strong> Experiment menu. Choose <strong>Wireless</strong> and <strong>the</strong>nScan <strong>for</strong> <strong>Wireless</strong> Device.b. There will be a short delay while Logger Pro attempts to establish a connection. If<strong>the</strong> WDSS is not found, try scanning again.c. A dialog box will appear showing your WDSS on <strong>the</strong> list of available devices.Select your WDSS device and <strong>the</strong>n click . Once a connection is made, <strong>the</strong>two LEDs on <strong>the</strong> WDSS will be lit green.5. Open <strong>the</strong> file “09 Newtons Second Law” from <strong>the</strong> Physics with Computers folder.6. Attach <strong>the</strong> <strong>for</strong>ce sensor hook to <strong>the</strong> <strong>for</strong>ce sensor end of <strong>the</strong> WDSS. Attach <strong>the</strong> WDSSto one of <strong>the</strong> <strong>Vernier</strong> <strong>Dynamics</strong> <strong>System</strong> carts.7. Find <strong>the</strong> mass of <strong>the</strong> cart with <strong>the</strong> WDSS attached. Record <strong>the</strong> mass in <strong>the</strong> data table.8. Place <strong>the</strong> cart on a level surface. Make sure <strong>the</strong> cart is not moving and click .Check to make sure both <strong>the</strong> <strong>for</strong>ce sensor and x-axis accelerometer are highlightedand click .Trial I9. You are now ready to collect <strong>for</strong>ce and acceleration data. Grasp <strong>the</strong> <strong>for</strong>ce sensorhook. Click and take several seconds to move <strong>the</strong> cart back and <strong>for</strong>th on <strong>the</strong>table. Vary <strong>the</strong> motion so that both small and large <strong>for</strong>ces are applied. Make sure thatyour hand is only touching <strong>the</strong> hook on <strong>the</strong> Force <strong>Sensor</strong> and not <strong>the</strong> Force <strong>Sensor</strong> orcart body.10. Note <strong>the</strong> shape of <strong>the</strong> <strong>for</strong>ce-time and acceleration-time graphs. Click <strong>the</strong> Examinebutton, , and move <strong>the</strong> mouse across <strong>the</strong> <strong>for</strong>ce vs. time graph. When <strong>the</strong> <strong>for</strong>ce ismaximum, is <strong>the</strong> acceleration maximum or minimum? To turn off Examine mode,click <strong>the</strong> Examine button a second time.11. The graph of <strong>for</strong>ce vs. acceleration should appear to be a straight line. To fit a straightline to <strong>the</strong> data, click on <strong>the</strong> graph, <strong>the</strong>n click <strong>the</strong> Linear Fit button, . Record <strong>the</strong>equation <strong>for</strong> <strong>the</strong> regression line in <strong>the</strong> data table.28 © 2007 - <strong>Vernier</strong> Software & Technology
<strong>Activities</strong> <strong>for</strong> <strong>the</strong> <strong>Wireless</strong> <strong>Dynamics</strong> <strong>Sensor</strong> <strong>System</strong>12. Print copies of each graph.Trial 213. Attach <strong>the</strong> 0.500 kg mass to <strong>the</strong> cart. Record <strong>the</strong> mass of <strong>the</strong> cart, sensors, andadditional mass in <strong>the</strong> data table. Repeat Steps 9 – 12.DATA TABLETrial IMass of cart with WDSS (kg)Regression line <strong>for</strong> <strong>for</strong>ce vs. acceleration dataTrial 2Mass of cart with WDSS and additional mass (kg)Regression line <strong>for</strong> <strong>for</strong>ce vs. acceleration dataANALYSIS1. Compare <strong>the</strong> <strong>for</strong>ce-time and acceleration-time graphs <strong>for</strong> a particular trial. How are<strong>the</strong>y different? How are <strong>the</strong>y <strong>the</strong> same?2. Are <strong>the</strong> net <strong>for</strong>ce on an object and <strong>the</strong> acceleration of <strong>the</strong> object directly proportional?Explain, using experimental data to support your answer.3. What are <strong>the</strong> units of <strong>the</strong> slope of <strong>the</strong> <strong>for</strong>ce vs. acceleration graph? Simplify <strong>the</strong> unitsof <strong>the</strong> slope to fundamental units (m, kg, s).4. For each trial compare <strong>the</strong> slope of <strong>the</strong> regression line to <strong>the</strong> mass being accelerated.What does <strong>the</strong> slope represent?5. Write a general equation that relates all three variables: <strong>for</strong>ce, mass, and acceleration.EXTENSIONSUse this apparatus as a way to measure mass. Place an unknown mass on <strong>the</strong> cart.Measure <strong>the</strong> acceleration <strong>for</strong> a known <strong>for</strong>ce and determine <strong>the</strong> mass of <strong>the</strong> unknown.Compare your answer with <strong>the</strong> actual mass, as measured using a balance.© 2007 - <strong>Vernier</strong> Software & Technology 29
<strong>Activities</strong> <strong>for</strong> <strong>the</strong> <strong>Wireless</strong> <strong>Dynamics</strong> <strong>Sensor</strong> <strong>System</strong>TEACHER INFORMATIONNewton’s Second Law1. Traditional experiments <strong>for</strong> Newton’s second law often use motion detectors or sparktimers to measure distance data and calculate acceleration. This experiment uses <strong>the</strong>accelerometer in <strong>the</strong> WDSS to actually measure <strong>the</strong> acceleration. This device, alongwith <strong>the</strong> Force <strong>Sensor</strong> of <strong>the</strong> WDSS, makes it easy to quickly collect accurate <strong>for</strong>ceand acceleration data.2. In this experiment, <strong>the</strong> students will analyze <strong>the</strong> <strong>for</strong>ce vs. acceleration graph. Duringthis analysis <strong>the</strong>y will per<strong>for</strong>m a linear fit on <strong>the</strong> data. The slope of this fit should beclose to <strong>the</strong> mass of <strong>the</strong> cart and added objects. To get <strong>the</strong> best possible results, youmay want to calibrate both <strong>the</strong> WDSS’s <strong>for</strong>ce sensor and accelerometer.3. Since <strong>the</strong> accelerometer of <strong>the</strong> WDSS is sensitive to inclination, <strong>the</strong> students areinstructed to make sure <strong>the</strong> surface is level and zero <strong>the</strong> sensors prior to datacollection.4. This lab was written using 0.500 kg dynamics carts. If you are using large carts, youmay need to change <strong>the</strong> maximum and minimum values <strong>for</strong> <strong>for</strong>ce and acceleration on<strong>the</strong> graphs.5. The mass used in this experiment is <strong>the</strong> inertial mass, as opposed to <strong>the</strong> gravitationalmass. You may wish to make this distinction with your students.6. If <strong>the</strong> accelerometer data seem noisy, make sure that <strong>the</strong> sensor is securely fastened to<strong>the</strong> cart. If it isn't fastened firmly, it could rattle and introduce more noise to <strong>the</strong> dataset.7. Explore all magnitudes of <strong>for</strong>ce by moving <strong>the</strong> cart back and <strong>for</strong>th in a random way.Do NOT just pull <strong>the</strong> cart at a uni<strong>for</strong>m speed or at uni<strong>for</strong>m acceleration, since you'llconcentrate points in a small region of <strong>the</strong> <strong>for</strong>ce vs. acceleration plot that way.8. When discussing <strong>the</strong> accelerometer reading, it is proper to refer to it as a measure ofNormal Force per Unit Mass, with units of N/kg, where “normal” is in <strong>the</strong> directionof that particular accelerometer. This is what <strong>the</strong> accelerometer is actually measuring.(Note that it is not <strong>the</strong> net <strong>for</strong>ce per unit mass which would be acceleration.) Amotionless accelerometer oriented in <strong>the</strong> vertical direction will give a reading of+9.8 N/kg when pointed up and –9.8 N/kg when pointed down. A motionlessaccelerometer oriented in <strong>the</strong> horizontal direction will read 0 N/kg. An accelerometerin freefall will give a value of 0 N/kg regardless of its orientation. Since most peopleprefer <strong>the</strong> measurement be in m/s 2 , we have used <strong>the</strong>se units in this manual.ANSWERS TO PRELIMINARY QUESTIONS1. The larger <strong>the</strong> <strong>for</strong>ce, <strong>the</strong> more <strong>the</strong> motion changes. This is a direct relationship.2. The baseball will change its motion more than <strong>the</strong> bowling ball.3. The new acceleration would be half as large. This is an inverse relationship between30 © 2007 - <strong>Vernier</strong> Software & Technology
<strong>Activities</strong> <strong>for</strong> <strong>the</strong> <strong>Wireless</strong> <strong>Dynamics</strong> <strong>Sensor</strong> <strong>System</strong>mass and acceleration.SAMPLE RESULTSTrial IMass of cart with WDSS (kg)0.70 kgRegression line <strong>for</strong> <strong>for</strong>ce vs. acceleration datay = 0.73x− 0.002Trial 2Mass of cart with WDSS and additional mass (kg)1.20 kgRegression line <strong>for</strong> <strong>for</strong>ce vs. acceleration datay = 1.21x− 0.05Force and acceleration graphs <strong>for</strong> cart equippedwith <strong>for</strong>ce and acceleration sensors© 2007 - <strong>Vernier</strong> Software & Technology 31
<strong>Activities</strong> <strong>for</strong> <strong>the</strong> <strong>Wireless</strong> <strong>Dynamics</strong> <strong>Sensor</strong> <strong>System</strong>ANSWERS TO ANALYSIS QUESTIONS1. The graphs look very similar, showing that <strong>for</strong>ce and acceleration are closely related.The peaks on one graph occur at <strong>the</strong> same time on each graph.2. Force and acceleration are directly proportional. This relationship can be seen when<strong>the</strong> <strong>for</strong>ce-time and acceleration-time graphs are compared. Also, <strong>the</strong> graph of <strong>for</strong>ce vs.acceleration shows a linear relationship.3. N/(m/s 2 ) = kg4. In Trial 1, <strong>the</strong> mass was 0.7 kg while <strong>the</strong> slope of <strong>the</strong> linear regression line was 0.73N/(m/s 2 ). In Trial 2, <strong>the</strong> mass was 1.20 kg while <strong>the</strong> slope of <strong>the</strong> linear regression linewas 1.21 N/(m/s 2 ). In both cases <strong>the</strong> mass was within <strong>the</strong> uncertainty of <strong>the</strong> fittedslope. The slope corresponds to <strong>the</strong> combined mass of <strong>the</strong> cart, sensors, and anyadded mass.5. F = m a32 © 2007 - <strong>Vernier</strong> Software & Technology
<strong>Activities</strong> <strong>for</strong> <strong>the</strong> <strong>Wireless</strong> <strong>Dynamics</strong> <strong>Sensor</strong> <strong>System</strong>Newton’s Third LawYou may have learned this statement of Newton’s third law: “To every action <strong>the</strong>re is anequal and opposite reaction.” What does this sentence mean?Unlike Newton’s first two laws of motion, which concern only individual objects, <strong>the</strong>third law describes an interaction between two bodies. For example, what if you pull onyour partner’s hand with your hand? To study this interaction, you can use two Force<strong>Sensor</strong>s. As one object (your hand) pushes or pulls on ano<strong>the</strong>r object (your partner’shand) <strong>the</strong> Force <strong>Sensor</strong>s will record those pushes and pulls. They will be related in a verysimple way as predicted by Newton’s third law.The action referred to in <strong>the</strong> phrase above is <strong>the</strong> <strong>for</strong>ce applied by your hand, and <strong>the</strong>reaction is <strong>the</strong> <strong>for</strong>ce that is applied by your partner’s hand. Toge<strong>the</strong>r, <strong>the</strong>y are known as a<strong>for</strong>ce pair. This short experiment will show how <strong>the</strong> <strong>for</strong>ces are related.OBJECTIVESIn this activity, you willFigure 1 – Collecting <strong>for</strong>ce pairs with two WDSS units• observe <strong>the</strong> directional relationship between <strong>for</strong>ce pairs.• observe <strong>the</strong> time variation of <strong>for</strong>ce pairs.• explain Newton’s third law in simple language.MATERIALSBluetooth ® equipped computerLogger Pro Softwaretwo <strong>Vernier</strong> <strong>Wireless</strong> <strong>Dynamics</strong> <strong>Sensor</strong><strong>System</strong>s500 g massstringrubber bandPRELIMINARY QUESTIONS1. You are driving down <strong>the</strong> highway and a bug splatters on your windshield. Which isgreater: <strong>the</strong> <strong>for</strong>ce of <strong>the</strong> bug on <strong>the</strong> windshield, or <strong>the</strong> <strong>for</strong>ce of <strong>the</strong> windshield on <strong>the</strong>bug?2. Hold a rubber band between your right and left hands. Pull with your left hand. Doesyour right hand experience a <strong>for</strong>ce? Does your right hand apply a <strong>for</strong>ce to <strong>the</strong> rubber© 2007 - <strong>Vernier</strong> Software & Technology 33
<strong>Activities</strong> <strong>for</strong> <strong>the</strong> <strong>Wireless</strong> <strong>Dynamics</strong> <strong>Sensor</strong> <strong>System</strong>band? What direction is that <strong>for</strong>ce compared to <strong>the</strong> <strong>for</strong>ce applied by <strong>the</strong> left hand?3. Pull harder with your left hand. Does this change any <strong>for</strong>ce applied by <strong>the</strong> right hand?4. How is <strong>the</strong> <strong>for</strong>ce of your left hand, transmitted by <strong>the</strong> rubber band, related to <strong>the</strong> <strong>for</strong>ceapplied by your right hand? Write a rule, in words, <strong>for</strong> <strong>the</strong> <strong>for</strong>ce relationship.PROCEDURE1. Turn on <strong>the</strong> two WDSS units. Note <strong>the</strong> name on <strong>the</strong> label of <strong>the</strong> devices.2. Make sure Bluetooth is activated on your computer. Some computers have Bluetoothbuilt into <strong>the</strong>m. If that is <strong>the</strong> case, make sure Bluetooth is turned on.3. Start Logger Pro.4. Establish a wireless connection with <strong>the</strong> WDSS.a. Choose Connect Interface from <strong>the</strong> Experiment menu. Choose <strong>Wireless</strong> and <strong>the</strong>nScan <strong>for</strong> <strong>Wireless</strong> Device.b. There will be a short delay while Logger Pro attempts to establish a connection. If<strong>the</strong> WDSS is not found, try scanning again.c. A dialog box will appear showing your WDSS on <strong>the</strong> list of available devices.Select your WDSS device and <strong>the</strong>n click . Once a connection is made, <strong>the</strong>two LEDs on <strong>the</strong> WDSS will be lit green.5. Open <strong>the</strong> file “11 Newton’s Third Law” in <strong>the</strong> Physics with Computers folder.6. Attach <strong>the</strong> Force Senor Hooks to <strong>the</strong> <strong>for</strong>ce sensor ends of <strong>the</strong> two WDSS units.7. Force sensors measure <strong>for</strong>ce only along one direction; if you apply a <strong>for</strong>ce alongano<strong>the</strong>r direction, your measurements will not be meaningful. The WDSS <strong>for</strong>cesensor responds to <strong>for</strong>ce directed parallel to <strong>the</strong> long axis of <strong>the</strong> sensor.8. OPTIONAL – Since you will be comparing <strong>the</strong> readings of two different Force<strong>Sensor</strong>s, it is important that <strong>the</strong>y both read <strong>for</strong>ce accurately. In o<strong>the</strong>r words, you needto calibrate <strong>the</strong>m. To calibrate <strong>the</strong> first sensor,a. Choose Calibrate from <strong>the</strong> Experiment menu. Select one of <strong>the</strong> WDSS <strong>for</strong>cesensors. Click on <strong>the</strong> button.b. Remove all <strong>for</strong>ce from <strong>the</strong> first sensor and hold it vertically with <strong>the</strong> hook pointeddown. Enter a 0 (zero) in <strong>the</strong> Value 1 field, and after <strong>the</strong> reading shown <strong>for</strong>Reading 1 is stable, click . This defines <strong>the</strong> zero <strong>for</strong>ce condition.c. Hang <strong>the</strong> 500 g mass from <strong>the</strong> sensor. This applies a <strong>for</strong>ce of 4.9 N. Enter 4.9 in<strong>the</strong> Value 2 field, and after <strong>the</strong> reading shown <strong>for</strong> Reading 2 is stable, <strong>the</strong>n click.d. Click to complete <strong>the</strong> calibration of <strong>the</strong> first <strong>for</strong>ce sensor.e. Repeat <strong>the</strong> Steps a-d <strong>for</strong> <strong>the</strong> second WDSS <strong>for</strong>ce sensor.9. You will be using <strong>the</strong> sensors in a different orientation than that in which <strong>the</strong>y werecalibrated. Zero <strong>the</strong> <strong>for</strong>ce sensors to account <strong>for</strong> this. Hold <strong>the</strong> sensors horizontallywith no <strong>for</strong>ce applied, and click . Make sure both sensors are highlighted in <strong>the</strong>34 © 2007 - <strong>Vernier</strong> Software & Technology
<strong>Activities</strong> <strong>for</strong> <strong>the</strong> <strong>Wireless</strong> <strong>Dynamics</strong> <strong>Sensor</strong> <strong>System</strong>Zero <strong>Sensor</strong> Calibrations box and click to zero both sensors. This step makesboth sensors read exactly zero when no <strong>for</strong>ce is applied.10. Click to take a trial run of data. Pull on each sensor and note <strong>the</strong> sign of <strong>the</strong>reading. Use this to establish <strong>the</strong> positive direction <strong>for</strong> each sensor. For this activity itis helpful to set up <strong>the</strong> two sensors differently, since later you will have <strong>the</strong> sensorspositioned so that a <strong>for</strong>ce to <strong>the</strong> left will generate <strong>the</strong> same sign of <strong>for</strong>ce on eachsensor.11. Choose Set Up <strong>Sensor</strong>s from <strong>the</strong> Experiments menu and <strong>the</strong>n select your secondWDSS device. Click below <strong>the</strong> <strong>for</strong>ce sensor and select Reverse Direction.This will make <strong>the</strong> <strong>for</strong>ce sensor report negative values <strong>for</strong> <strong>for</strong>ces that pull <strong>the</strong> hookaway from <strong>the</strong> sensor.12. Make a short loop of string with a circumference of about 30 cm. Use it to attach <strong>the</strong>hooks of <strong>the</strong> <strong>for</strong>ce sensors. Hold one sensor in your hand and have your partner hold<strong>the</strong> o<strong>the</strong>r so you can pull on each o<strong>the</strong>r using <strong>the</strong> string as an intermediary.13. Click to begin collecting data. Gently tug on your partner’s sensor with yoursensor, making sure <strong>the</strong> graph does not go off scale. Also, have your partner tug onyour sensor. You will have 10 seconds to try different pulls. Choose Store Latest Runfrom <strong>the</strong> Experiment menu.14. What would happen if you used <strong>the</strong> rubber band instead of <strong>the</strong> string? Would some of<strong>the</strong> <strong>for</strong>ce get “used up” in stretching <strong>the</strong> band? Use <strong>the</strong> prediction tool to sketch aprediction graph, and repeat Steps 12 – 13 using <strong>the</strong> rubber band instead of <strong>the</strong> string.ANALYSIS1. Examine <strong>the</strong> two data runs. What can you conclude about <strong>the</strong> two <strong>for</strong>ces (your pull onyour partner and your partner’s pull on you)? How are <strong>the</strong> magnitudes related? Howare <strong>the</strong> signs related?2. How does <strong>the</strong> rubber band change <strong>the</strong> results—or does it change <strong>the</strong>m at all?3. While you and your partner are pulling on each o<strong>the</strong>r’s sensors, do your sensors have<strong>the</strong> same positive direction? What impact does your answer have on <strong>the</strong> analysis of<strong>the</strong> <strong>for</strong>ce pair?4. Is <strong>the</strong>re any way to pull on your partner’s sensor without your partner’s sensor pullingback? Try it.5. Reread <strong>the</strong> statement of <strong>the</strong> third law given at <strong>the</strong> beginning of this activity. Thephrase equal and opposite must be interpreted carefully, since <strong>for</strong> two vectors to beequal ( r rr rA = B) and opposite ( A = − B) <strong>the</strong>n we must have Ar = Br= 0 ; that is, both<strong>for</strong>ces are always zero. What is really meant by equal and opposite? RestateNewton’s third law in your own words, not using <strong>the</strong> words “action,” “reaction,” or“equal and opposite.”6. Re-evaluate your answer to <strong>the</strong> bug-windshield question.© 2007 - <strong>Vernier</strong> Software & Technology 35
<strong>Activities</strong> <strong>for</strong> <strong>the</strong> <strong>Wireless</strong> <strong>Dynamics</strong> <strong>Sensor</strong> <strong>System</strong>EXTENSIONS1. Fasten one WDSS to your lab bench and repeat <strong>the</strong> experiments. Does <strong>the</strong> bench pullback as you pull on it? Does it matter that <strong>the</strong> second WDSS is not held by a person?2. Use a rigid rod to connect <strong>the</strong> <strong>for</strong>ce sensor hooks instead of a string and experimentwith mutual pushes instead of pulls. Repeat <strong>the</strong> experiments. Does <strong>the</strong> rod change <strong>the</strong>way <strong>the</strong> <strong>for</strong>ce pairs are related?36 © 2007 - <strong>Vernier</strong> Software & Technology
<strong>Activities</strong> <strong>for</strong> <strong>the</strong> <strong>Wireless</strong> <strong>Dynamics</strong> <strong>Sensor</strong> <strong>System</strong>TEACHER INFORMATIONNewton’s Third Law1. This experiment may not take a full lab period; it is intended as a short in-classactivity to clarify an often-misunderstood law. You may want to combine it with aNewton’s second law experiment.2. Be careful that students do not pull too hard on <strong>the</strong> Force <strong>Sensor</strong>s.3. This activity may be <strong>the</strong> first in which students calibrate a sensor, so you may need todevote time to understanding that process.4. A push is positive <strong>for</strong> one sensor and negative <strong>for</strong> <strong>the</strong> o<strong>the</strong>r. Having <strong>the</strong> signs invertedis helpful in this activity, since <strong>the</strong> sensors are held facing one ano<strong>the</strong>r. With oppositesigns, a <strong>for</strong>ce to <strong>the</strong> right is read as <strong>the</strong> same sign on each sensor, so <strong>the</strong> two sensorsshare a single sign convention.ANSWERS TO PRELIMINARY QUESTIONS1. The bug exerts <strong>the</strong> same magnitude <strong>for</strong>ce on <strong>the</strong> windshield as <strong>the</strong> windshield exertson <strong>the</strong> bug. The directions are opposite.2. The right hand exerts a <strong>for</strong>ce on <strong>the</strong> left via <strong>the</strong> rubber band and visa versa; <strong>the</strong> two<strong>for</strong>ces are in opposite directions.3. Yes, increasing <strong>the</strong> <strong>for</strong>ce exerted by one hand increases <strong>the</strong> <strong>for</strong>ce exerted by <strong>the</strong> o<strong>the</strong>r.4. The <strong>for</strong>ce exerted by <strong>the</strong> left hand is <strong>the</strong> same magnitude but <strong>the</strong> opposite direction as<strong>the</strong> <strong>for</strong>ce exerted by <strong>the</strong> right.SAMPLE RESULTSANSWERS TO ANALYSIS QUESTIONS1. The magnitudes are <strong>the</strong> same but <strong>the</strong> directions are opposite. This is true regardless of© 2007 - <strong>Vernier</strong> Software & Technology 37
<strong>Activities</strong> <strong>for</strong> <strong>the</strong> <strong>Wireless</strong> <strong>Dynamics</strong> <strong>Sensor</strong> <strong>System</strong><strong>the</strong> time of comparison.2. The rubber band does not change <strong>the</strong> results.3. When <strong>the</strong> sensors are facing one ano<strong>the</strong>r, a pull is read as <strong>the</strong> same sign as a push on<strong>the</strong> o<strong>the</strong>r, meaning that <strong>the</strong> positive direction of <strong>the</strong> two sensors is <strong>the</strong> same, while<strong>the</strong>y are in that orientation.4. No, you can’t pull without your partner pulling back.5. Answers will vary, but should be of this content: When body A exerts a <strong>for</strong>ce on bodyB, body B exerts a <strong>for</strong>ce on body A of <strong>the</strong> same magnitude but <strong>the</strong> opposite direction.6. Answers will vary.38 © 2007 - <strong>Vernier</strong> Software & Technology
<strong>Activities</strong> <strong>for</strong> <strong>the</strong> <strong>Wireless</strong> <strong>Dynamics</strong> <strong>Sensor</strong> <strong>System</strong>Investigating Collisions with CrumpleZonesThe design of modern railway cars such as that shown in Figure 1 incorporates a series ofcrush or crumple zones so that, in <strong>the</strong> event of a collision, much of <strong>the</strong> train’s kineticenergy is transferred through de<strong>for</strong>mation. Such zones reduce <strong>the</strong> accelerations and <strong>for</strong>ceson both <strong>the</strong> train and its passengers and also make it less likely a derailment will occur.Current safety regulations <strong>for</strong> new train cars state that <strong>the</strong> crumple zones in each carriagemust absorb at least 3MJ of energy. A modern car equipped with a crumple zone, andhitting a wall at 55 km/hr, only absorbs about 0.1 MJ through de<strong>for</strong>mation of this zone.Figure 1 – Virgin Rail Class 390 Pendolinotrain going through RugbyFigure 2 – Energy absorbingcrumplingCrumple zones in train cars is just one example of innovations designed to keeppassengers safe in <strong>the</strong> event of a collision. O<strong>the</strong>r examples include seat belts and air bagsparticularly <strong>for</strong> use in automobiles. In this activity, you will investigate accelerationsduring collisions with and without crumple zones.OBJECTIVESIn this activity, you will• simulate collisions with and without crumple zones.• simulate collisions with differing quantities of crumple zones.• investigate <strong>the</strong> effectiveness of a crumple zone.© 2007 - <strong>Vernier</strong> Software & Technology 39
<strong>Activities</strong> <strong>for</strong> <strong>the</strong> <strong>Wireless</strong> <strong>Dynamics</strong> <strong>Sensor</strong> <strong>System</strong>MATERIALSBluetooth ® equipped computerLogger Pro Software<strong>Vernier</strong> <strong>Wireless</strong> <strong>Dynamics</strong> <strong>Sensor</strong> <strong>System</strong>glue stickdynamics cart and track with 500 g mass10 heavy-duty aluminum foil strips3 × 10 cm10 standard aluminum foil strips3 × 10 cmmeter stick or measuring tapePROCEDUREEstablish a connection to your WDSS1. Turn on <strong>the</strong> WDSS. Note <strong>the</strong> name on <strong>the</strong> label of <strong>the</strong> device.2. Make sure Bluetooth is activated on your computer. Some computers have Bluetoothbuilt into <strong>the</strong>m. If that is <strong>the</strong> case, make sure Bluetooth is turned on.3. Start Logger Pro.4. Establish a wireless connection with <strong>the</strong> WDSS.a. Choose Connect Interface from <strong>the</strong> Experiment menu. Choose <strong>Wireless</strong> and <strong>the</strong>nScan <strong>for</strong> <strong>Wireless</strong> Device.b. There will be a short delay while Logger Pro attempts to establish a connection. If<strong>the</strong> WDSS is not found, try scanning again.c. A dialog box will appear showing your WDSS on <strong>the</strong> list of available devices.Select your WDSS device and <strong>the</strong>n click . Once a connection is made, <strong>the</strong>two LEDs on <strong>the</strong> WDSS will be lit green.<strong>Sensor</strong> and Data Collection Setup5. Choose Set Up <strong>Sensor</strong>s from <strong>the</strong> Experiments menuand <strong>the</strong>n select your WDSS device. Set up <strong>the</strong> sensorsso that only <strong>the</strong> x-axis accelerometer is active.6. Choose Data Collection from <strong>the</strong> Experiment menu.Adjust <strong>the</strong> data collection experiment length to 1second with a sampling rate of 250 samples/second.Click on <strong>the</strong> Triggering tab and set up triggering asshown in Figure 3.7. Set up <strong>the</strong> dynamics cart and track using one set of<strong>the</strong> adjustable leveling feet to create a slight incline.Attach <strong>the</strong> track end stop to <strong>the</strong> lower end of <strong>the</strong> trackand place that end against a wall or firm surface thatwill prevent <strong>the</strong> track from moving during <strong>the</strong>experiment. Adjust <strong>the</strong> end stop so it is positioned at<strong>the</strong> 7 cm mark on <strong>the</strong> track.Figure 340 © 2007 - <strong>Vernier</strong> Software & Technology
<strong>Activities</strong> <strong>for</strong> <strong>the</strong> <strong>Wireless</strong> <strong>Dynamics</strong> <strong>Sensor</strong> <strong>System</strong>8. Mount <strong>the</strong> WDSS on top of <strong>the</strong> cart as shown in Figure 4. Arrange <strong>the</strong> cart andWDSS so that <strong>the</strong> x-axis accelerometer is pointing towards <strong>the</strong> track’s end stop. With<strong>the</strong> cart in place and not moving, click to zero <strong>the</strong> x-axis accelerometer.Figure 4 – WDSS attached to cart on a track9. Attach <strong>the</strong> 500 g mass to <strong>the</strong> WDSS. For more stability, place <strong>the</strong> mass toward <strong>the</strong>center of <strong>the</strong> car.10. Roll each strip of aluminum foil into a cylinder. Attach <strong>the</strong> two edges toge<strong>the</strong>r usingglue from <strong>the</strong> glue stick. Each cylinder should be 3 cm in height. Be sure you knowwhich cylinders are heavy-duty and which are standard aluminum foil.Simulating Collisions using Heavy-Duty Aluminum Foil11. Position <strong>the</strong> front edge of <strong>the</strong> cart at <strong>the</strong> 60 cm mark on <strong>the</strong> track. The cart will be53 cm from <strong>the</strong> end stop. Click to begin data collection. Release <strong>the</strong> cart andallow it to collide with <strong>the</strong> end stop. The collision will have triggered data collection.12. Once data collection is complete, review <strong>the</strong> data to find <strong>the</strong> magnitude of <strong>the</strong> largestacceleration associated with stopping <strong>the</strong> WDSS. Record this value in <strong>the</strong> data tableprovided. Determine <strong>the</strong> time it took <strong>for</strong> <strong>the</strong> cart to stop its <strong>for</strong>ward progress andrecord this value in <strong>the</strong> data table provided.13. Position one foil cylinder so that it is centered on <strong>the</strong> track with <strong>the</strong> base of <strong>the</strong>cylinder against <strong>the</strong> track’s end stop. Repeat Steps 11 – 12 using <strong>the</strong> foil cylinder as acrumple zone. Note <strong>the</strong> condition of <strong>the</strong> cylinder after <strong>the</strong> collision.14. Repeat Step 13 using two foil cylinders placed side by side.15. Repeat Step 13 using three foil cylinders placed side by side.16. Repeat Step 13 using four foil cylinders placed side by side.Simulating Collisions using Standard Aluminum Foil17. Repeat Steps 13 – 16, this time using standard aluminum foil cylinders in place of <strong>the</strong>heavy-duty foil.© 2007 - <strong>Vernier</strong> Software & Technology 41
<strong>Activities</strong> <strong>for</strong> <strong>the</strong> <strong>Wireless</strong> <strong>Dynamics</strong> <strong>Sensor</strong> <strong>System</strong>DATA TABLEMaximum StoppingAcceleration(m/s 2 )Time to stop(s)Without Crumple ZonesHeavy-Duty Aluminum FoilStandard Aluminum FoilWith Crumple ZonesMaximumStoppingAcceleration(m/s 2 )Time to stop(s)MaximumStoppingAcceleration(m/s 2 )Time to stop(s)1 Foil Cylinder2 Foil Cylinders3 Foil Cylinders4 Foil CylindersQUESTIONS1. What is <strong>the</strong> relationship between <strong>the</strong> maximum stopping acceleration and <strong>the</strong>maximum stopping Force experienced by <strong>the</strong> cart? What physics principle is <strong>the</strong>relationship based on?2. What is <strong>the</strong> relationship between <strong>the</strong> maximum stopping acceleration and <strong>the</strong> time ittakes <strong>the</strong> cart to stop? What physics principle is <strong>the</strong> relationship based on?3. What is <strong>the</strong> relationship between <strong>the</strong> number of cylinders and <strong>the</strong> maximum stoppingacceleration <strong>for</strong> <strong>the</strong> heavy-duty foil? Does this same relationship hold <strong>for</strong> <strong>the</strong> standardfoil? Explain.4. Based on your data, which crumple zone was <strong>the</strong> most effective? Which was <strong>the</strong> leasteffective? Explain your reasoning.EXTENSION1. Design a crumple zone that would best protect passengers during a collision. Describeyour design. Explain how you determined <strong>the</strong> right “stiffness” of <strong>the</strong> crumple zone?2. Research how scientists design and test crumple zones. Be sure to investigate howFinite Element Analysis (FEA) is used.42 © 2007 - <strong>Vernier</strong> Software & Technology
<strong>Activities</strong> <strong>for</strong> <strong>the</strong> <strong>Wireless</strong> <strong>Dynamics</strong> <strong>Sensor</strong> <strong>System</strong>TEACHER INFORMATIONInvestigating Collisions with CrumpleZones1. Most students will know that cars have crumple zones, air bags and seat belts to aid<strong>the</strong> protection of people in collisions. They might not realize that crumple zones havealso been developed <strong>for</strong> use on trains. The crumple zones also help to keep a train on<strong>the</strong> track following a collision.2. When discussing <strong>the</strong> accelerometer reading, it is proper to refer to it as a measure ofNormal Force per Unit Mass, with units of N/kg, where “normal” is in <strong>the</strong> directionof that particular accelerometer. This is what <strong>the</strong> accelerometer is actually measuring.(Note that it is not <strong>the</strong> net <strong>for</strong>ce per unit mass which would be acceleration.) Amotionless accelerometer oriented in <strong>the</strong> vertical direction will give a reading of+9.8 N/kg when pointed up and -9.8 N/kg when pointed down. A motionlessaccelerometer oriented in <strong>the</strong> horizontal direction will read 0 N/kg. An accelerometerin freefall will give a value of 0 N/kg regardless of its orientation. Since most peopleprefer <strong>the</strong> measurement be in m/s 2 , we have used <strong>the</strong>se units in this manual.3. To prevent damaging your WDSS, be sure to keep it on <strong>the</strong> dynamics track.4. WDSS acceleration readings greater than ±50 m/s 2 are not reliable as <strong>the</strong>y exceed <strong>the</strong>maximum measurable acceleration of <strong>the</strong> WDSS. These accelerations result when <strong>the</strong>cart hits <strong>the</strong> end stop.5. The following web sites contain in<strong>for</strong>mation on collisions with crumple zones.• Finite Element Analysis – this Wikipedia web site provides a very brief explanationof what FEA is and where and how it is used, plus a number of useful externallinks.http://en.wikipedia.org/wiki/Finite_element_analysis• Introduction to Finite Element Analysis – this site provides a simple and briefintroduction to FEA, its history, what it is, how it works and where it is often used.http://www.sv.vt.edu/classes/MSE2094_NoteBook/97ClassProj/num/widas/history.html• Modeling collisions of rail vehicles with de<strong>for</strong>mable objects – this detailed reportwas produced by AEA Technology Rail <strong>for</strong> <strong>the</strong> Rail Safety and Standards Board of<strong>the</strong> UK. The report contains many images showing <strong>the</strong> stages of such simulatedcollisions toge<strong>the</strong>r with associated graphs looking at <strong>the</strong> velocity and energyprofiles of <strong>the</strong> colliding objects.http://www.rssb.co.uk/pdf/reports/research/T305%20Modelling%20collisions%20of%20rail%20vehicles%20with%20de<strong>for</strong>mable%20objects.pdf• Volpe Center Highlights – this article looks includes in<strong>for</strong>mation about a crash testof railway cars colliding with a concrete wall at 26 mph. The web site is <strong>for</strong> <strong>the</strong>research and development centre in Cambridge, Massachusetts, USA <strong>for</strong> nationaltransportation systems.http://www.volpe.dot.gov/ufosrc/highlts/pdf/400.pdf© 2007 - <strong>Vernier</strong> Software & Technology 43
<strong>Activities</strong> <strong>for</strong> <strong>the</strong> <strong>Wireless</strong> <strong>Dynamics</strong> <strong>Sensor</strong> <strong>System</strong>• Will <strong>the</strong> crash zone crumple? FEA tells – this article is from Machine Design whichlooks at <strong>the</strong> crumple zone development on <strong>the</strong> Class 390 Pendolino trains now inuse with Virgin Rail in <strong>the</strong> UK.http://www.machinedesign.com/ASP/viewSelectedArticle.asp?strArticleId=56432&strSite=MDSite&catId=0SAMPLE RESULTSno crumple zoneHeavy-Duty Foil – 1 cylinderHeavy-Duty Foil – 2 cylindersHeavy-Duty Foil – 3 cylindersHeavy-Duty Foil – 4 Cylinders44 © 2007 - <strong>Vernier</strong> Software & Technology
<strong>Activities</strong> <strong>for</strong> <strong>the</strong> <strong>Wireless</strong> <strong>Dynamics</strong> <strong>Sensor</strong> <strong>System</strong>Standard Foil – 1 cylinderStandard Foil – 2 cylindersStandard Foil – 3 cylindersStandard Foil – 4 CylindersMaximum StoppingAcceleration(m/s 2 )Time to stop(s)Without Crumple Zones >50 0.008Heavy-Duty Aluminum FoilStandard Aluminum FoilWith Crumple ZonesMaximumStoppingAcceleration(m/s 2 )Time to stop(s)MaximumStoppingAcceleration(m/s 2 )Time to stop(s)1 Foil Cylinder 9.36 0.115 > 50 0.7302 Foil Cylinders 9.43 0.066 6.24 0.1223 Foil Cylinders 14.40 0.052 7.21 0.0944 Foil Cylinders 15.22 0.049 7.76 0.072© 2007 - <strong>Vernier</strong> Software & Technology 45
<strong>Activities</strong> <strong>for</strong> <strong>the</strong> <strong>Wireless</strong> <strong>Dynamics</strong> <strong>Sensor</strong> <strong>System</strong>ANSWERS TO QUESTIONS1. The maximum acceleration and <strong>for</strong>ce are directly related. As one goes up so does <strong>the</strong>o<strong>the</strong>r. This is Newton’s 2 nd Law.2. The maximum acceleration and time to stop <strong>the</strong> cart are inversely related. As <strong>the</strong>maximum acceleration increases, <strong>the</strong> time to stop <strong>the</strong> cart decreases. This is based on<strong>the</strong> impulse-momentum <strong>the</strong>orem. Given <strong>the</strong> carts all have <strong>the</strong> same change inmomentum, <strong>the</strong>y all require <strong>the</strong> same impulse to stop <strong>the</strong> cart. The cart with <strong>the</strong>largest average acceleration will stop in <strong>the</strong> shortest amount of time.3. Answers will vary. For our data, as <strong>the</strong> number of cylinders increased, <strong>the</strong> maximumacceleration increased. This is a result of <strong>the</strong> increased “stiffness” of <strong>the</strong> crumplezones. This was not <strong>the</strong> case <strong>for</strong> <strong>the</strong> standard foil where a single cylinder was not ableto significantly slow <strong>the</strong> cart be<strong>for</strong>e it impacted <strong>the</strong> end stop. For two or morecylinders, <strong>the</strong> results were similar to <strong>the</strong> heavy-duty foil.4. Answers will vary. From our data, <strong>the</strong> best crumple zone was <strong>the</strong> two cylinder,standard foil crumple zone. This had <strong>the</strong> smallest maximum stopping accelerationand <strong>the</strong> longest stopping time. The worse crumple zone was <strong>the</strong> single cylinderstandard foil. The cylinder was completely flattened, allowing <strong>the</strong> cart to impact <strong>the</strong>end stop with a <strong>for</strong>ce comparable to <strong>the</strong> collision without a crumple zone.46 © 2007 - <strong>Vernier</strong> Software & Technology