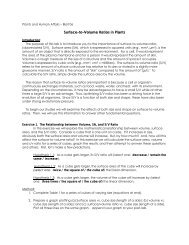
Lucas et al. / MARITAL SATISFACTION INVARIANCE 117TABLE 3Spousal Invariance <strong>of</strong> Marital Satisfaction in Four CulturesScale and Model df χ 2 RMSEA NNFI CFI ∆df ∆χ 2 ∆CFIAmerican (N = 322)LoveConfigural 125 444.24*** .088 .90 .92 — — —Metric 134 454.21*** .085 .91 .92 9 9.81 .00Intercept 142 477.44*** .084 .91 .92 8 23.23** .00Mean 143 477.11*** .084 .91 .92 1 0.33 .00PartnershipConfigural 125 189.01*** .039 .97 .98 — — —Metric 134 195.70*** .037 .98 .98 9 6.69 .00Intercept 142 215.52*** .040 .97 .97 8 19.82* .01Mean 143 215.53*** .039 .97 .97 1 0.01 .01British (N = 1,031)LoveConfigural 125 740.88*** .069 .93 .94 — — —Metric 134 790.56*** .069 .93 .94 9 49.68*** .00Intercept 142 979.38*** .071 .92 .93 8 188.82*** .01Mean 143 1,011.97*** .077 .91 .93 1 32.59*** .00PartnershipConfigural 125 563.56*** .058 .94 .95 — — —Metric 134 629.33*** .060 .93 .94 9 65.77*** .01Intercept 142 815.85*** .068 .92 .93 8 186.52*** .01Mean 143 821.73*** .068 .92 .93 1 5.88* .00Chinese (N = 232)LoveConfigural 125 246.55*** .065 .91 .92 — — —Metric 134 253.59*** .062 .91 .92 9 7.04 .00Intercept 142 309.47*** .071 .90 .91 8 56.08*** .01Mean 143 314.52*** .072 .90 .91 1 5.05* .00PartnershipConfigural 125 213.38*** .055 .94 .95 — — —Metric 134 231.55*** .056 .94 .95 9 18.17* .00Intercept 142 253.56*** .058 .93 .94 8 22.01** .01Mean 143 256.72*** .059 .93 .94 1 3.16 .00Turkish (N = 350)LoveConfigural 125 293.07*** .062 .93 .94 — — —Metric 134 307.39*** .061 .93 .94 9 14.32 .00Intercept 142 340.42*** .063 .93 .93 8 33.03*** .01Mean 143 344.02*** .063 .93 .93 1 3.60 .00PartnershipConfigural 125 220.15*** .047 .95 .96 — — —Metric 134 247.61*** .049 .95 .95 9 27.46** .01Intercept 142 261.65*** .049 .95 .95 8 14.04 .00Mean 143 280.35*** .052 .94 .94 1 18.70*** .01NOTE: RMSEA = root mean square error <strong>of</strong> approximation; NNFI = nonnormed fit index; CFI = comparativefit index. Bold lines indicate highest level <strong>of</strong> invariance attained for each analysis.*p < .05. **p < .01. ***p < .001.a multidimensional view <strong>of</strong> marital satisfaction in suggesting that both evolutionarilyinvariant and culturally unique criteria may be reflected in marital satisfaction ratings <strong>of</strong>husbands and wives.Downloaded from http://jcc.sagepub.com at College <strong>of</strong> St. Benedict/St. John's University on April 10, 2008© 2008 SAGE Publications. All rights reserved. Not for commercial use or unauthorized distribution.
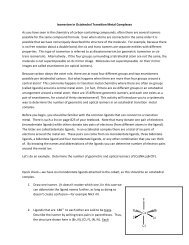
118 JOURNAL OF CROSS-CULTURAL PSYCHOLOGYTABLE 4<strong>Cultural</strong> Invariance <strong>of</strong> Marital Satisfaction for Husbands and WivesScale and Model df χ 2 RMSEA NNFI CFI ∆df ∆χ 2 ∆CFIHusbands (N = 1,945)LoveConfigural 108 619.35*** .093 .93 .95 — — —Metric 135 706.80*** .088 .94 .94 27 87.45*** .01Intercept 159 1,240.37*** .120 .89 .88 24 533.57*** .06PartnershipConfigural 108 421.92*** .073 .95 .96 — — —Metric 135 560.72*** .076 .93 .95 27 138.82*** .01Intercept 159 1,044.95*** .110 .89 .88 24 484.23*** .07Wives (N = 1,945)LoveConfigural 108 666.86*** .097 .93 .95 — — —Metric 135 759.41*** .091 .93 .94 27 92.55*** .01Intercept 159 1,162.73*** .110 .90 .89 24 403.32*** .05PartnershipConfigural 108 513.06*** .082 .94 .96 — — —Metric 135 631.46*** .082 .93 .95 27 118.40*** .01Intercept 159 1,302.06*** .120 .88 .86 24 670.60*** .09NOTE: RMSEA = root mean square error <strong>of</strong> approximation; NNFI = nonnormed fit index; CFI = comparativefit index. Bold lines indicate highest level <strong>of</strong> invariance attained for each analysis.***p < .001.Although romantic love is sometimes seen as characteristic <strong>of</strong> marriage in Western cultures,evolutionary researchers have historically emphasized its ubiquitous role in marriage.For example, Jankowiak and Fischer (1992) have suggested that there exists auniversal amorous component to marriage. Others have noted that even within traditionalcultures in which there are arranged marriages, most couples eventually fall in love (forreviews, see Lucas et al., 2004; Weisfeld & Weisfeld, 2002). Although there are many plausibleinterpretations, one possibility is that romantic love may be an adaptively evolvedcomponent <strong>of</strong> marital satisfaction to the extent that it facilitates both procreation and caregiving.The results <strong>of</strong> this study lend support to this possibility in that spouses were similarto one another in romantic love across all four <strong>of</strong> our cultures.In addition to romantic love, there are numerous evolutionary arguments that supportubiquitous partnership arrangements in marriage. Most notably, communication and supportbetween husbands and wives may enhance caregiving. Couples who are unable tocoordinate complex support routines that are demanded by a child, or who are generallyunsupportive <strong>of</strong> one another, may perform less successfully as parents. Accordingly, selectionpressures should favor at least some universally adaptive forms <strong>of</strong> communicationbetween husbands and wives for the purpose <strong>of</strong> supporting children. Thus, in addition toromantic love, marriage may require at least some unequivocal partnership behaviors thatare generally reflected in couples’ sense <strong>of</strong> satisfaction with one another.Although evolutionary explanations <strong>of</strong> marital satisfaction are at least plausible according tospousal invariance, a lack <strong>of</strong> full cultural invariance in the present study also suggests that maritalsatisfaction criteria may be determined by culture. In this vein, theory and research supportthat husbands and wives from different cultures may define their satisfaction with one anotherin unique ways. For example, religion is thought to play an important role in spouses’ satisfactionwith one another in many cultures. In China, however, there is a tenuous connectionDownloaded from http://jcc.sagepub.com at College <strong>of</strong> St. Benedict/St. John's University on April 10, 2008© 2008 SAGE Publications. All rights reserved. Not for commercial use or unauthorized distribution.