Measurement and Characterization of Key Fiber Reliability Attributes
Measurement and Characterization of Key Fiber Reliability Attributes
Measurement and Characterization of Key Fiber Reliability Attributes

You also want an ePaper? Increase the reach of your titles
YUMPU automatically turns print PDFs into web optimized ePapers that Google loves.
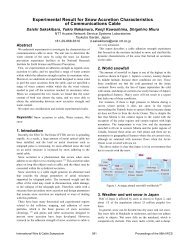
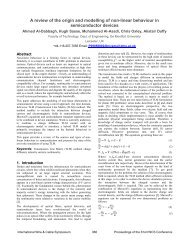
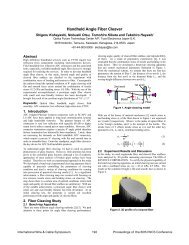
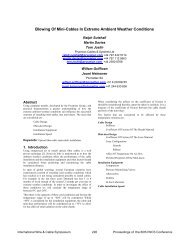
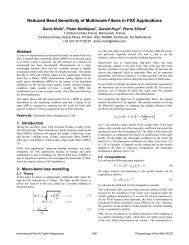
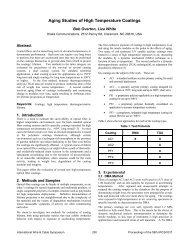
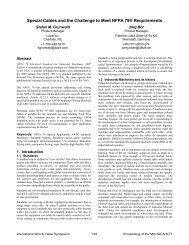
log(failure stress)nd = 24.1 (2PBT)SEE = .0007563.853.803.753.703.65log(V/r)Figure 3 – Results <strong>of</strong> two-point bending method n dtesting on a fiber with a low modulus inner primary.The same fiber demonstrated highly elevated SEE inaxial tension testing (Figure 2).2.2 SEE Values <strong>and</strong> n d DeterminationA low SEE value is instrumental to the accurate measurement <strong>of</strong>the dynamic stress corrosion susceptibility. Scatter in the failurestress measurements via either n d measurement method canprovide both erroneously high <strong>and</strong> low n d values depending on thestress rates at which the scatter is observed. The internationalmeasurement st<strong>and</strong>ard, IEC 60793-1-33, requires themeasurement <strong>of</strong> additional samples when the SEE value exceeds0.0017. That SEE limit, however, does not always ensure that then d value is properly represented. Figure 4 shows the results <strong>of</strong> n dtesting via the axial tension method testing on two fibers. Onesample has a conforming SEE <strong>and</strong> n d value <strong>of</strong> 26.2. The otherfiber has a conforming SEE <strong>of</strong> less than 0.0017, but scatter at thehigh stress rates caused the slope to be lower, which elevated themeasured n d value. The actual n d value <strong>of</strong> the second fiber isimproperly represented despite the conforming SEE value.ln(failure stress)6.756.76.656.66.556.56.456.4Dynamic Fatigue - Axial Tension - IEC 60793-1-33nd = 25.2SEE = 0.000493nd = 33.0SEE = 0.001559ln(stress rate)Figure 4 – Axial tension method test results for tw<strong>of</strong>ibers with conforming SEE values. The n d value <strong>of</strong> 33is not an accurate reflection <strong>of</strong> fiber performancedespite the conforming SEE <strong>of</strong> less than 0.0017.The requirement for limitations on SEE values is not absoluteamong all measurement st<strong>and</strong>ards. While the internationalst<strong>and</strong>ard, IEC 60793-1-33, has a SEE limitation, some domesticst<strong>and</strong>ards may not have a requirement. For example, TIA-455-28C, Measuring Dynamic Strength <strong>and</strong> Fatigue Parameters <strong>of</strong>Optical <strong>Fiber</strong>s by Tension, does not incorporate a SEE limitation 3 .Since this document may be referenced in some industryst<strong>and</strong>ardized fiber specifications, harmonization <strong>of</strong> the TIAst<strong>and</strong>ard with international st<strong>and</strong>ards is desirable. The TIAdocument also does not include the two-point bending method,which should be included as an acceptable alternative dynamicstress corrosion susceptibility measurement method.3. Use <strong>of</strong> n in Lifetime Estimates3.1 Impact <strong>of</strong> nThe significance <strong>of</strong> the stress corrosion susceptibility (n) isrealized in reliability equations. When a fiber is under bend, theouter cladding surface will experience stresses that could be inexcess <strong>of</strong> the pro<strong>of</strong> test value. The radius <strong>of</strong> the bend must besufficiently large to ensure that the fiber remains in the extrinsicstrength region <strong>of</strong> the fiber. Under that bend condition, extrinsicflaws at the surface <strong>of</strong> the cladding will be susceptible to fatigue<strong>and</strong> failure when under bend. The allowable bend stress (σ a ) towhich a fiber can be subjected for a specified period <strong>of</strong> time (t a ,the design lifetime) with a defined failure probability (F) isdefined in Equation 1 4 .σ⎡(n−2)1/ ntpln(1 F) me⎛ ⎞ ⎢⎧− ⎫a = σp⎜⎟ ⎨1− ⎬ −1a ⎢p b⎝ t ⎠⎩⎣L * N * C ⎭⎤⎥⎥⎦1/ nIn Equation 1, σ p is the pro<strong>of</strong> test value, t p is the dwell time for thepro<strong>of</strong> test, N p is the pro<strong>of</strong> test break rate, L*C b is the effectivelength <strong>of</strong> the fiber that is under bend, <strong>and</strong> m e is the Weibull slopefor the extrinsic strength region. This equation is typicallyconfigured to represent the lifetime at a specified bendradius/bend stress with a defined part-per-million (ppm) failureprobability. A more meaningful representation <strong>of</strong> Equation 1expresses the failure probability (F) in terms <strong>of</strong> the bend stress<strong>and</strong> design lifetime, which is presented in Equation 2.⎡F = 1−exp⎢⎢L * N⎢⎣p⎧⎪ ⎛ σ* Cb* ⎨1−⎜⎪ ⎝ σ⎩t ⎞+ 1⎟t ⎠na anp pmen−2This form <strong>of</strong> the equation is more suitable to demonstrate thechange in ppm failure probability at a specified bend radius as afunction <strong>of</strong> the stress corrosion susceptibility. As expected, theequation indicates that a higher n value will yield a decreasingppm failure probability. There are several key points about thisestimate, however, that must be taken into consideration whenassessing the actual impact <strong>of</strong> a measured n d change on the longterm reliability <strong>of</strong> a fiber that is under bend.There are documented concerns associated with the use <strong>of</strong> themeasured n d from IEC 60793-1-33 for lifetime/failure probabilityestimates. This st<strong>and</strong>ard specifically notes in Section 4.2, “Theuse <strong>of</strong> stress corrosion susceptibility (<strong>and</strong> pro<strong>of</strong> stress) parametersfor reliability estimates is still under consideration. A method forextrapolating such parameters to service environments differentfrom the default environment specified above has not beendeveloped. It has been observed that the value <strong>of</strong> n produced bythese tests can change after even brief exposure <strong>of</strong> the fibre toelevated temperature <strong>and</strong> humidity.” Therefore, a higher⎫⎤⎪⎥⎬⎥⎪⎭⎥⎦(1)(2)International Wire & Cable Symposium37Proceedings <strong>of</strong> the 60th IWCS Conference
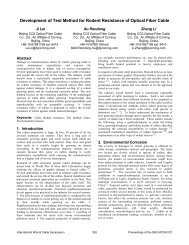
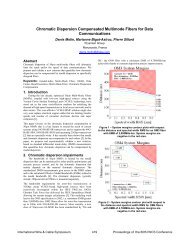
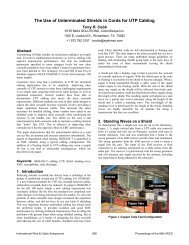
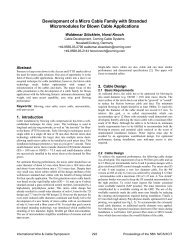
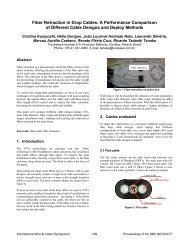
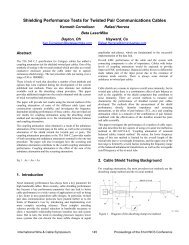
measured n d value is not assured to translate into enhancedreliability in the deployed system. This is consistent withprevious work that recommended the use <strong>of</strong> n values based on theevaluation <strong>of</strong> large flaws at low stress rates <strong>and</strong> the two-regionpower law theory 5 . Furthermore, the difference in measured n dfrom different industry st<strong>and</strong>ardized <strong>and</strong> approved test methodsdem<strong>and</strong>s that proper engineering judgment must be used whenapplying a measured n d value to lifetime estimates.In some cases, the measured change in n d can be attributed to acause that is based on a fundamental underst<strong>and</strong>ing <strong>of</strong> glassperformance. Glass composition, product enhancements thatpermanently prohibit or significantly reduce the diffusion <strong>of</strong>moisture to the glass surface (e.g., hermetic coatings), <strong>and</strong>environmental conditions are typically accepted as characteristicsthat will cause actual n d to vary. In some cases, the cause for theincrease in the measured n d value is not fully understood. Forexample, reference 6 attributed the increase in n d to thecharacteristics <strong>of</strong> the coating system. While a potentialmechanism was suggested, the actual cause for the observedchange in measured n d values was not definitively known. Untilthe increase in measured n d can be directly attributed to a specificmechanism that explains the observed improvement in fatigueresistance <strong>and</strong> industry experts accept the explanation, no benefitshould be assumed in lifetime modeling.Another consideration in the use <strong>of</strong> measured n d is the magnitude<strong>of</strong> the failure probability at a given bend radius. In general, themagnitude <strong>of</strong> the change in the failure probability with n value isslight. Figure 5 shows the projected failure probability over fortyyears for four different bend diameters. All <strong>of</strong> the projectedfailure probabilities for a single full turn are two ppm or less.Even at 5-mm bend radius, the projected failure probability isreduced from about 1.5 ppm to about 0.6 ppm for an assumedchange in n from 20 to 30. Larger radius bends have even smallerprojected failure probabilities with this equation. The magnitude<strong>of</strong> the failure probability is already exceptionally low whencalculated by applying the n value with the conservatism that isdem<strong>and</strong>ed by the industry st<strong>and</strong>ard. The practical benefitassociated with the assumption that higher n values can be appliedis negligible.5Failure Probability versus n d at Small Bend RadiiOne Full Turn for 40 Years3.2 Impact <strong>of</strong> Extrinsic Strength/N pEquation 2 requires the pro<strong>of</strong> test break rate during themanufacturing process, N p , to estimate a failure probabilityestimate at a given bend radius. Implicit with the use <strong>of</strong> N p is thatthe pro<strong>of</strong> test break rate accurately represents the extrinsicstrength distribution that is susceptible to breakage at small bendsover the design lifetime <strong>of</strong> the fiber. Previous work has indicatedthat this assumption is not implicit. Reference 7 noted that thepro<strong>of</strong> test distribution might be multi-modal. As a result, theextrinsic strength distribution is not assured to be represented bythe pro<strong>of</strong> test break rate. Additional measurement work isnecessary to ensure that the pro<strong>of</strong> test break rate will adequatelyrepresent the extrinsic strength distribution.To enable effective lifetime modeling for a fiber under bend, theuse <strong>of</strong> a long gage length test device that can stress significanttotal lengths <strong>of</strong> fiber (hundreds <strong>of</strong> kilometers) to well above thepro<strong>of</strong> test value should be used to capture the extrinsic strengthdistribution <strong>of</strong> the optical fiber. Figure 6 contains the results <strong>of</strong>long gage length testing on several different optical fiber products.The fibers are differentiated by manufacturing process <strong>and</strong>cladding characteristics. Upon inspection, it is clear that several<strong>of</strong> the products have significantly different extrinsic strengthdistributions. The use <strong>of</strong> modeling tools, such as the two-regionpower law, can be used to process the data <strong>and</strong> determine if thepro<strong>of</strong> test break rate can be accurately projected. The data inFigure 6 can also be used to determine an extrinsic Weibull slope(m e ), which can provide a more refined estimate <strong>of</strong> actual failureprobabilities under bend conditions.Failure Probability0.010.0010.00010.00001Product 1Product 2Product 3Product 4Product 520 m Gage Length Failure StrengthFailure Probability (ppm)4321019 20 21 22 23 24 25 26 27 28 29 30 31n d5-mm 7.5-mm 10-mm 15-mmFigure 5 – Plot <strong>of</strong> failure probability versus n d at 5, 7.5,10, <strong>and</strong> 15 mm bends. The results show low failureprobabilities <strong>and</strong> little change in F with varying n d0.000001Failure Stress (kpsi)Figure 6 – Plot <strong>of</strong> post pro<strong>of</strong> test extrinsic strengthdistribution <strong>of</strong> different optical fiber products. The fiberwas subjected to long gage length (20 meter) testing ata high stress rate. Disparity in failure rates is observedamong several <strong>of</strong> the products.3.3 Impact <strong>of</strong> Pro<strong>of</strong> Test on <strong>Reliability</strong>Another issue that is related to the extrinsic strength distribution<strong>of</strong> bend insensitive fibers is the pro<strong>of</strong> test level that is required toenable long term reliability. The st<strong>and</strong>ard pro<strong>of</strong> test level, 100kpsi, has been driven primarily by the long term reliabilityrequirements for long lengths <strong>of</strong> deployed fiber. A higher pro<strong>of</strong>test level <strong>of</strong> 200 kpsi has been suggested for bend insensitivefibers. This higher pro<strong>of</strong> test level, however, may simply increasecost with minimal benefit in projected reliability under bend. Forexample, the maximum post-pro<strong>of</strong> test flaw size that will survivea 40 year lifetime at a 10-mm bend radius (minimal bendInternational Wire & Cable Symposium38Proceedings <strong>of</strong> the 60th IWCS Conference
insensitive fiber bend radius requirement in ITU-TRecommendation G.657.A1) will exceed 200 kpsi. Therefore, thepro<strong>of</strong> test will not eliminate all <strong>of</strong> the extrinsic flaws that couldyield when subjected to the design bend <strong>of</strong> a RecommendationG.657.A1 fiber for 40 years. As the minimum bend diameter isreduced, the size <strong>of</strong> the largest surviving flaw gets smaller. A 200kpsi pro<strong>of</strong> test will not eliminate all <strong>of</strong> the extrinsic flaws thatcould fail when deployed at those reduced minimum design bendradii for a 40 year lifetime. Therefore, long term reliability insmall bend deployments is driven by the extrinsic flawdistribution. Optical fibers with superior strength distributionsgain little benefit through exposure to a 200 kpsi pro<strong>of</strong> test. Infact, the higher stress test <strong>and</strong> additional h<strong>and</strong>ling may only serveto damage the fiber or fatigue existing extrinsic flaws, whichcould increase the long term failure probability.4. ConclusionsIndustry st<strong>and</strong>ards cite two methods for the measurement <strong>of</strong>dynamic stress corrosion susceptibility - axial tension <strong>and</strong> twopointbending. Both can provide reliable trade <strong>and</strong> commercevalues for n d , but the two-point bending method values areapproximately 2 units higher on average than the reference testmethod, axial tension, when the same fibers are evaluated. Agood SEE value is important to ensure a reliable n d value, but theactual results should be closely reviewed for credibility, even ifconforming SEE values are obtained. The two-point bendingmethod will tend to yield better SEE values due to the shortevaluated gage length, but successful results from the referencetest method should be obtained first to ensure that localizedstrength issues are not masked. Due to the variability in the n dmeasurement method <strong>and</strong> the disparity in measured n d valuesbetween methods, a conservative n d value is recommended for usein lifetime modeling. The suggestion <strong>of</strong> any benefit in n d shouldbe attributable to a specific attribute or mechanism that isaccepted by experts within the industry. The extrinsic strengthdistribution <strong>of</strong> the fiber is a critical attribute in reliabilitymodeling. Actual long gage length testing is required tocharacterize the extrinsic strength distribution <strong>and</strong> validate the use<strong>of</strong> pro<strong>of</strong> test break rates <strong>and</strong> to underst<strong>and</strong> better the long termreliability under small bend conditions.5. AcknowledgementsSpecial thanks to Eric Argentieri for the stress corrosionsusceptibility measurement work that supported this paper.6. References[1] IEC 60793-1-22, <strong>Measurement</strong> Methods <strong>and</strong> Test Procedures– Stress Corrosion Susceptibility, First Edition, 08-2001[2] Long Han, Xiaosong Wu, et. al, <strong>Characterization</strong> <strong>of</strong> TensileProperties <strong>of</strong> Optical <strong>Fiber</strong>s Coated with a New GenerationCoating System <strong>and</strong> the Comparison <strong>of</strong> Fatigue Behavior byTensile Test <strong>and</strong> Two Point Bending Technique, 59 th IWCS[3] TIA-455-28C, Measuring Dynamic Strength <strong>and</strong> FatigueParameters <strong>of</strong> Optical <strong>Fiber</strong>s by Tension (2005)[4] Pieter Matthijsse, Willem Griffioen, Matching Optical <strong>Fiber</strong>Lifetime <strong>and</strong> Bend-Loss Limits for Optimized Local Loop<strong>Fiber</strong> Storage, Optical <strong>Fiber</strong> Technology 11 (2005) pp 92-99[5] T. Volotinen, A. Breuls, N. Evanno, K. Kemeter, C.Kurkjian, P. Regio, S. Semjonov, T. Svensson <strong>and</strong> S.Glaesemann, Mechanical behavior <strong>and</strong> B-value <strong>of</strong> anabraded optical fiber, Proc. <strong>of</strong> 48 th IWCS, (1998), p. 881 -890[6] Xinwei Qian, Ruichun Wang, et. al, ContinuousStrengthening <strong>of</strong> Optical <strong>Fiber</strong> over Time – Contribution <strong>of</strong>Next Generation Coating System to Dynamic FatigueImprovement, 59 th IWCS[7] A. Paul, G. S. Glaesemann, An Appraisal <strong>of</strong> Mechanical<strong>Reliability</strong> Predictions for Optical <strong>Fiber</strong>s Based on BreakRates, 46 th IWCS (1997)7. Author BiographiesJeffrey J. Englebert started his career inthe optical fiber industry with Siecor(now Corning Cable Systems) in 1992,where he served in a variety <strong>of</strong> technical<strong>and</strong> supervisory positions. In 1999, hetransferred to Corning’s Center for<strong>Fiber</strong>-Optic Testing (CFT) in Corning,NY where he was assigned Supervisor,Optical/Physical <strong>Measurement</strong>s Group<strong>and</strong> Supervisor, CFT. He is currentlythe Manager, Product Engineering/CFTfor Corning Optical <strong>Fiber</strong>. Prior to hiswork in optical fiber, he served as a nuclear submarine <strong>of</strong>ficerwith the US Navy. Jeff received a bachelor’s degree in chemistryfrom Northwestern University.Amy Millett is a senior productengineer for Corning Optical <strong>Fiber</strong>where she is responsible for designcontrol <strong>of</strong> new <strong>and</strong> existing opticalfiber product <strong>of</strong>ferings. She joinedCorning in 2007 in their Life Sciencesdivision where she held positions inprocess <strong>and</strong> quality engineering. Sheassumed her current responsibilities in2010. Prior to joining Corning, Amyworked for Hutchinson Technology,where she held a number <strong>of</strong> roles inquality, applications, <strong>and</strong> product <strong>and</strong> process development. Amyreceived a bachelor’s degree in mechanical engineering fromCornell University.International Wire & Cable Symposium39Proceedings <strong>of</strong> the 60th IWCS Conference