Fact Sheet - Stockland - Casual Mall Leasing
Fact Sheet - Stockland - Casual Mall Leasing
Fact Sheet - Stockland - Casual Mall Leasing
- No tags were found...
Create successful ePaper yourself
Turn your PDF publications into a flip-book with our unique Google optimized e-Paper software.
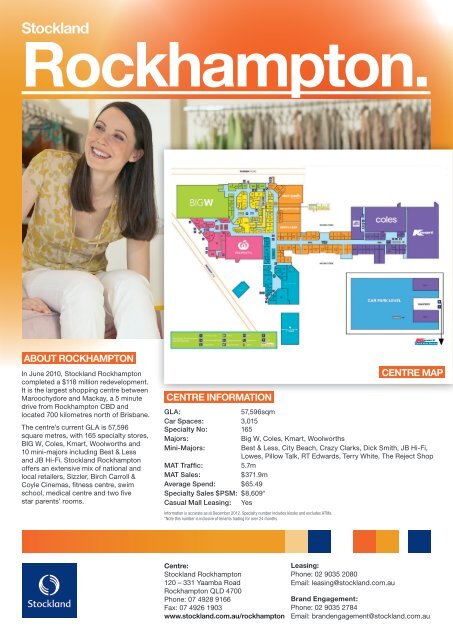
<strong>Stockland</strong>Rockhampton.ABOUT ROCKHAMPTONIn June 2010, <strong>Stockland</strong> Rockhamptoncompleted a $118 million redevelopment.It is the largest shopping centre betweenMaroochydore and Mackay, a 5 minutedrive from Rockhampton CBD andlocated 700 kilometres north of Brisbane.The centre’s current GLA is 57,596square metres, with 165 specialty stores,BIG W, Coles, Kmart, Woolworths and10 mini-majors including Best & Lessand JB Hi-Fi. <strong>Stockland</strong> Rockhamptonoffers an extensive mix of national andlocal retailers, Sizzler, Birch Carroll &Coyle Cinemas, fitness centre, swimschool, medical centre and two fivestar parents’ rooms.CENTRE INFORMATIONGLA:57,596sqmCar Spaces: 3,015Specialty No: 165Majors:Big W, Coles, Kmart, WoolworthsMini-Majors:Best & Less, City Beach, Crazy Clarks, Dick Smith, JB Hi-Fi,Lowes, Pillow Talk, RT Edwards, Terry White, The Reject ShopMAT Traffic: 5.7mMAT Sales:$371.9mAverage Spend: $65.49Specialty Sales $PSM: $8,609*<strong>Casual</strong> <strong>Mall</strong> <strong>Leasing</strong>: YesInformation is accurate as at December 2012. Specialty number includes kiosks and excludes ATMs.*Note this number is inclusive of tenants trading for over 24 months.CENTRE MAPCentre:<strong>Stockland</strong> Rockhampton120 – 331 Yaamba RoadRockhampton QLD 4700Phone: 07 4928 9166Fax: 07 4926 1903www.stockland.com.au/rockhampton<strong>Leasing</strong>:Phone: 02 9035 2080Email: leasing@stockland.com.auBrand Engagement:Phone: 02 9035 2784Email: brandengagement@stockland.com.au
Centre demographics.Trade area<strong>Stockland</strong> Rockhampton is located five minutes drive north of Rockhampton CBD. The centre captures a large percentage of themain trade area of 113,520 people with an ever increasing appeal to the tertiary trade area, as a result of recent redevelopment.The average household income is $95,660 per annum, 19.3 per cent higher than the non-metro QLD average.Trade area populationTRADE AREA MAPTrade AreaSectorPrimary SectorsPopulation2011ForecastPopulation2016AverageAnnualChange (%)2011 – 2016North 47,410 48,410 0.4%South 27,190 30,690 2.5%Total Primary 74,600 79,100 1.2%Secondary SectorsNorth 29,990 33,740 2.4%South 8,930 9,180 0.6%Total Secondary 38,920 42,920 2.0%Main Trade Area 113,520 122,020 1.5%Tertiary Sector 36,750 39,250 1.3%Total Trade Area 150,270 161,270 1.4%Trade area demographicsCharacteristicsPrimarySector –NorthPrimarySector –SouthSecondarySectors –NorthSecondarySectors –SouthMain TATertiarySectorTotal TANM QLDAverageAverage Per Capita Income $32,800 $33,065 $34,162 $29,340 $32,951 $47,694 $36,556 $31,651 $34,201Per Capita Income Variation 3.6% 4.5% 7.9% -7.3% 4.1% 50.7% 15.5% n.a. n.a.Average Household Income $86,603 $82,526 $84,703 $74,278 $84,096 $135,389 $95,660 $80,193 $87,928Household Income Variation 8.0% 2.9% 5.6% -7.4% 4.9% 68.8% 19.3% n.a. n.a.Average Household Size 2.6 2.5 2.5 2.5 2.6 2.8 2.6 2.5 2.6Age Distribution (% of Pop’n)Aged 0–14 21.3% 21.5% 19.9% 20.9% 21.0% 25.2% 22.0% 20.4% 19.3%Aged 15–19 7.2% 8.0% 7.2% 6.4% 7.3% 6.7% 7.2% 6.6% 6.5%Aged 20–29 14.7% 14.4% 9.2% 8.4% 12.7% 15.7% 13.4% 12.3% 13.8%Aged 30–39 13.3% 12.2% 11.0% 10.8% 12.2% 16.4% 13.2% 12.9% 13.8%Aged 40–49 13.5% 13.3% 14.6% 14.6% 13.8% 14.8% 14.1% 14.2% 14.2%Aged 50–59 12.3% 11.9% 15.2% 15.7% 13.2% 12.0% 12.9% 13.2% 12.8%Aged 60+ 17.7% 18.7% 22.9% 23.3% 19.7% 9.2% 17.2% 20.4% 19.6%Average Age 36.2 36.6 39.7 39.7 37.5 31.7 36.1 38.0 37.9Housing Status (% of H’holds)Owner/Purchaser 66.5% 63.0% 70.8% 81.2% 68.0% 48.9% 63.3% 65.4% 69.3%Renter 33.5% 37.0% 29.2% 18.8% 32.0% 51.1% 36.7% 34.6% 30.7%Birthplace (% of Pop’n)Australian Born 90.0% 91.0% 88.4% 94.0% 90.1% 88.6% 89.8% 82.1% 73.9%Overseas Born 10.0% 9.0% 11.6% 6.0% 9.9% 11.4% 10.2% 17.9% 26.1%Family Type (% of H’holds)Couple with dep't children 44.2% 43.5% 41.5% 40.6% 43.0% 57.1% 46.5% 43.3% 45.3%Couple with non-dep't child 7.5% 6.5% 6.3% 8.3% 7.0% 5.9% 6.7% 6.3% 7.7%Couple without children 22.5% 21.6% 29.7% 27.4% 24.6% 20.9% 23.7% 25.9% 23.0%Single with dep't child 11.3% 11.8% 9.1% 9.4% 10.7% 6.3% 9.6% 10.3% 9.2%Single with non-dep't child 3.7% 4.0% 2.7% 3.1% 3.5% 1.5% 3.0% 3.1% 3.5%Other family 1.0% 1.1% 0.6% 0.7% 0.9% 0.8% 0.9% 0.9% 1.1%Lone person 9.7% 11.6% 10.2% 10.5% 10.4% 7.4% 9.6% 10.2% 10.2%AustAverageSources: ABS Census of Population and Housing 2011; MapInfo LocationIQAll due care has been taken in the preparation of this document and as at December 2012, the information contained in this document is understood to be correct. However, no warranty is given as to the accuracy of the information contained in this document. All figuresare based on 2011 SA1 boundary definition with the exception of 2006 which is based on 2006 CCD definition. 2006 and 2011 ERP is calculated using SA2 preliminary ERP 2011 enumeration factor. Further, it should not be noted that the information contained in thisdocument should not be taken to be correct at any future date. Trading patterns described in this document will change in the future and this document should not be relied upon in any way to predict future trading patterns. The management of <strong>Stockland</strong> regard the contentsof this booklet as confidential and retailers should therefore not disclose its contents to any person other than personnel of the retailers involved in the management or promotion of their business at <strong>Stockland</strong>.


