Exercise, Blood Pressure, and Oxygen Saturation Levels - iWorx
Exercise, Blood Pressure, and Oxygen Saturation Levels - iWorx
Exercise, Blood Pressure, and Oxygen Saturation Levels - iWorx
- No tags were found...

You also want an ePaper? Increase the reach of your titles
YUMPU automatically turns print PDFs into web optimized ePapers that Google loves.
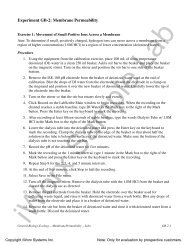
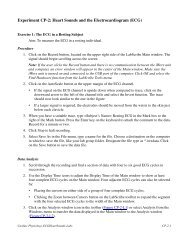
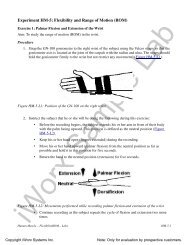
9. Click the Stop button.10. Remove all the pressure from the cuff. The subject should flex <strong>and</strong> extend their fingers toencourage blood circulation. Make sure the subject keeps his or her h<strong>and</strong>s <strong>and</strong> arms warm, topromote good peripheral circulation, while waiting for the next exercise to begin.11. Select Save As in the File menu, type a name for the file. Choose a destination on the computerin which to save the file, like your lab group folder). Designate the file type as *.iwxdata. Clickon the Save button to save the data file.Data Analysis - <strong>Oxygen</strong> <strong>Saturation</strong> <strong>and</strong> Heart Rate at Rest1. Scroll to the section of data recorded while the subject was resting <strong>and</strong> before the bloodpressure cuff was inflated.2. Use the Display Time icons to adjust the Display Time of the Main window to show at leastsixty seconds of data that is relatively free of artifacts. Sixty seconds of data can also beselected by:• Placing the cursors on either side of sixty seconds of data; <strong>and</strong>• Clicking the Zoom between Cursors button on the LabScribe toolbar to exp<strong>and</strong> the sixtyseconds of data to the width of the Main window.3. Click on the Analysis window icon in the toolbar or select Analysis from the Windows menu totransfer the data displayed in the Main window to the Analysis window (Figure HE-3-L2).Figure HE-3-L2: The pulse wave, oxygen saturation level, cuff pressure, <strong>and</strong> heart rate recordedbefore the occlusion of the artery displayed in the Analysis window. The mean oxygen saturation levelat rest equals 95.387222.<strong>iWorx</strong> Sample LabHuman <strong>Exercise</strong> – O2<strong>Saturation</strong>-<strong>Exercise</strong> – LabsHE-3-3Copyright <strong>iWorx</strong> Systems Inc.Note: Only for evaluation by prospective customers.
4. Look at the Function Table that is above the uppermost channel displayed in the Analysiswindow. The mathematical functions, Value1, Value2, V2-V1, T2-T1, Max, Min, Mean, <strong>and</strong>Max-Min should appear in this table. Values for these parameters on each channel are seen inthe table across the top margin of each channel.5. Once the cursors are placed in the correct positions for determining the volumes <strong>and</strong> rates ofeach breath cycle, the values of the parameters in the Function Table can be recorded in the onlinenotebook of LabScribe by typing their names <strong>and</strong> values directly into the Journal, or on aseparate data table.6. The functions in the channel pull-down menus of the Analysis window can also be used to enterthe names <strong>and</strong> values of the parameters from the recording to the Journal. To use thesefunctions:• Place the cursors on either side of the section of data to be analyzed.• Transfer the names of the mathematical functions used to determine the volumes <strong>and</strong>rates to the Journal using the Add Title to Journal function in the Lung Volumes Channelpull-down menu.• Transfer the values for the volumes <strong>and</strong> rates to the Journal using the Add Ch. Data toJournal function in the Lung Volumes Channel pull-down menu.7. Measure the following parameters from the O2 <strong>Saturation</strong> channel for the region of dataselected:• Maximum <strong>Oxygen</strong> <strong>Saturation</strong> Level, which is the value for Max on the O2 <strong>Saturation</strong>channel.• Minimum <strong>Oxygen</strong> <strong>Saturation</strong> Level, which is the value for Min on the O2 <strong>Saturation</strong>channel.• Mean <strong>Oxygen</strong> <strong>Saturation</strong> Level, which is the value for Mean on the O2 <strong>Saturation</strong>channel.• Change (∆) in <strong>Oxygen</strong> <strong>Saturation</strong> Level, which is the value for Max-Min on the O2<strong>Saturation</strong> channel.8. Record the values for these parameters in Table HE-3-L2.9. Use one of the techniques described in Steps 5 or 6 to record the values for the followingparameters in the Journal:• Maximum Heart Rate, which is the value for Max on the Heart Rate channel.• Minimum Heart Rate, which is the value for Min on the Heart Rate channel.• Mean Heart Rate, which is the value for Mean on the Heart Rate channel.• Change (∆) in Heart Rate, which is the value for Max-Min on the Heart Rate channel.10. Record the values for these parameters in the data table.11. Click the Save button to save the file.<strong>iWorx</strong> Sample Lab12. Click on the Main icon in the LabScribe toolbar to return to the Main window (Figure HE-3-L1).Human <strong>Exercise</strong> – O2<strong>Saturation</strong>-<strong>Exercise</strong> – LabsHE-3-4Copyright <strong>iWorx</strong> Systems Inc.Note: Only for evaluation by prospective customers.
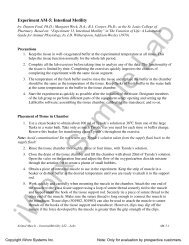
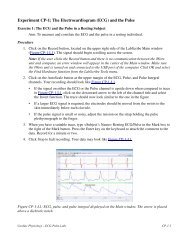
Data Analysis - <strong>Blood</strong> <strong>Pressure</strong> at Rest1. Click the Main window icon on the LabScribe toolbar to return to the Main window. Scroll tothe section of data recorded while the pressure in the cuff was being released.2. Use the Display Time icons to adjust the Display Time of the Main window to show the datafrom just before the reappearance of the pulse wave to just after the pulse wave in which thedichrotic notch reappears. This section of data can also be selected by:• Placing the cursors on either side of the required data; <strong>and</strong>• Clicking the Zoom between Cursors button on the LabScribe toolbar to exp<strong>and</strong> the datato the width of the Main window.3. Click on the Analysis window icon in the toolbar or select Analysis from the Windows menu totransfer the data displayed in the Main window to the Analysis window (Figure HE-3-L3).Figure HE-3-L3: The pulse wave, oxygen saturation level, cuff pressure, <strong>and</strong> heart rate recordedduring <strong>and</strong> after the occlusion of the artery displayed in the Analysis window. The subjects bloodpressure at rest equals 116/74.4. On the Pulse channel, place one cursor on the peak of the first pulse wave that reappears afterthe pressure in the cuff is released. Place the second cursor on the dichrotic notch of the firstwave in which the dichrotic notch reappears after the pressure in the cuff is released.5. Use one of the techniques described in the previous section to record the values for thefollowing parameters in the Journal:• Systolic <strong>Blood</strong> <strong>Pressure</strong>, which is the value for Value1 on the <strong>Blood</strong> <strong>Pressure</strong> channel.<strong>iWorx</strong> Sample Lab• Diastolic <strong>Blood</strong> <strong>Pressure</strong>, which is the value for Value2 on the <strong>Blood</strong> <strong>Pressure</strong> channel.Human <strong>Exercise</strong> – O2<strong>Saturation</strong>-<strong>Exercise</strong> – LabsHE-3-5Copyright <strong>iWorx</strong> Systems Inc.Note: Only for evaluation by prospective customers.
• Pulse <strong>Pressure</strong>, which is the value for V2-V1 on the <strong>Blood</strong> <strong>Pressure</strong> channel.6. Record the values for these parameters in the data table.7. Select Save in the File menu.8. Determine the subject’s blood pressure class from Table HE-3-L1. List it in Table HE-3-L2.Table HE-3-9: Classification of <strong>Blood</strong> <strong>Pressure</strong> <strong>Levels</strong> According to the Seventh Report of theJoint National Committee on Prevention, Detection, Evaluation, <strong>and</strong> Treatment of High <strong>Blood</strong><strong>Pressure</strong> (JNC 7)Class Systolic <strong>Pressure</strong> (mmHg) Diastolic <strong>Pressure</strong> (mmHg)Hypotensive
Warning: St<strong>and</strong>ing on the belt when the treadmill is turned on could cause injury to the subject ordamage to the treadmill.For Cycling on a Stationary Bicycle:• The subject should be on the bicycle 20 seconds before the exercise period begins <strong>and</strong> holdingthe arm with the photoplethysmograph <strong>and</strong> the blood pressure cuff still to reduce the possibilityof motion artifacts on the recording.• The subject should maintain a speed of 60 rotations per minute throughout the exercise period.• The subject should begin pedaling at the beginning of the exercise period <strong>and</strong> reach thedesignated speed as soon as possible.For Stepping in Place:• The metronome should be set to 48 beats per minute <strong>and</strong> turned on 20 seconds before theexercise period begins.• The subject should be st<strong>and</strong>ing in front of the step at that time.• The subject should hold the arm with the photoplethysmograph <strong>and</strong> the blood pressure cuff stillto reduce the possibility of motion artifacts on the recording.Warning: It is important to secure the step against the side of a lab bench or up against a wall toprevent it from slipping from under the feet of the subject.3. The timekeeper should give the group a 10-second countdown before the beginning of theexercise period. When the timekeeper says “Start!”, the subject should begin exercising <strong>and</strong> theRecord button on LabScribe Main window should be clicked.4. Type 1 Minute, Light <strong>Exercise</strong> in the Mark box to the right of the Mark button. At one minuteinto the exercise period, press the Enter key on the keyboard to mark the recording.5. Type 2 Minute, Light <strong>Exercise</strong> in the Mark box. At two minutes into the exercise period, pressthe Enter key on the keyboard to mark the recording.6. Thirty seconds before the end of the exercise period, the timekeeper should alert the group to beready to take the subject’s blood pressure.7. Type End of Light <strong>Exercise</strong> in the Mark box. At three minutes into the exercise period, press theEnter key on the keyboard to mark the recording, <strong>and</strong> instruct the subject to stop exercising, sitdown <strong>and</strong> relax. Continue recording.8. As soon as possible after the end of the exercise period, measure the subject’s blood pressure:• Check the position of the blood pressure cuff on the arm.• Inflate the cuff the pulse wave disappears.• Release the pressure from the cuff at the rate of 2-3 mmHg per second until the pressurereads 40 mmHg.<strong>iWorx</strong> Sample LabHuman <strong>Exercise</strong> – O2<strong>Saturation</strong>-<strong>Exercise</strong> – LabsHE-3-7Copyright <strong>iWorx</strong> Systems Inc.Note: Only for evaluation by prospective customers.
9. Continue recording10. Type 1 Minute, Recovery 1 in the Mark box. At one minute into the recovery period, press theEnter key on the keyboard to mark the recording.11. Mark the recording of the recovery period at 2, 3, 4, <strong>and</strong> 5 minutes into the recovery periodusing notations similar to the one used in Step 10.12. Between the 4-minute <strong>and</strong> 5-minute (end) marks of the recovery period, measure the subject’sblood pressure again.13. As soon as the blood pressure measurement at the end of the first recovery period is completed,prepare to begin the second exercise period.Second <strong>Exercise</strong> Period:For Walking on a Treadmill:• The speed should be set to 2.6 miles per hour <strong>and</strong> turned on 15 seconds before the exerciseperiod begins.For Cycling on a Stationary Bicycle:• The subject should seated on the bicycle <strong>and</strong> ready to maintain a speed of 90 rotations perminute throughout the exercise period.For Stepping in Place:• The metronome should be set to 72 beats per minute <strong>and</strong> turned on 20 seconds before theexercise period begins, <strong>and</strong> the subject should be st<strong>and</strong>ing in front of the step at that time.14. Repeat Steps 3 through 12 of these directions for the second exercise <strong>and</strong> recovery periods.15. As soon as the blood pressure measurement at the end of the second recovery period iscompleted, prepare to begin the third exercise period.Third <strong>Exercise</strong> Period:For Walking on a Treadmill:• The speed should be set to 3.2 miles per hour <strong>and</strong> turned on 15 seconds before the exerciseperiod begins.For Cycling on a Stationary Bicycle:• The subject should seated on the bicycle <strong>and</strong> ready to maintain a speed of 120 rotations perminute throughout the exercise period.For Stepping in Place:• The metronome should be set to 96 beats per minute <strong>and</strong> turned on 20 seconds before theexercise period begins, <strong>and</strong> the subject should be st<strong>and</strong>ing in front of the step at that time.<strong>iWorx</strong> Sample LabHuman <strong>Exercise</strong> – O2<strong>Saturation</strong>-<strong>Exercise</strong> – LabsHE-3-8Copyright <strong>iWorx</strong> Systems Inc.Note: Only for evaluation by prospective customers.
16. Repeat Steps 3 through 12 of these directions for the third exercise <strong>and</strong> recovery periods.17. As soon as the blood pressure measurement at the end of the third recovery period is completed,click the Stop button on the LabScribe Main window.18. Select Save in the File menu.Data Analysis - <strong>Oxygen</strong> <strong>Saturation</strong> <strong>and</strong> Heart Rate1. Scroll to the data recorded between the beginning of the first exercise period <strong>and</strong> one-minutemark of the first exercise period.2. Use the Display Time icons to adjust the Display Time of the Main window to show the sixtyseconds of data in the window.Sixty seconds of data can also be selected by:• Placing the cursors on either side of sixty seconds of data; <strong>and</strong>• Clicking the Zoom between Cursors button on the LabScribe toolbar to exp<strong>and</strong> the sixtyseconds of data to the width of the Main window.3. Click on the Analysis window icon in the toolbar or select Analysis from the Windows menu totransfer the data displayed in the Main window to the Analysis window.4. Use the same techniques employed in <strong>Exercise</strong> 1 to measure <strong>and</strong> record the followingparameters from the O2 <strong>Saturation</strong> channel for the region of data selected:• Maximum <strong>Oxygen</strong> <strong>Saturation</strong> Level, which is the value for Max on the O2 <strong>Saturation</strong>channel.• Minimum <strong>Oxygen</strong> <strong>Saturation</strong> Level, which is the value for Min on the O2 <strong>Saturation</strong>channel.• Mean <strong>Oxygen</strong> <strong>Saturation</strong> Level, which is the value for Mean on the O2 <strong>Saturation</strong>channel.• Change (∆) in <strong>Oxygen</strong> <strong>Saturation</strong> Level, which is the value for Max-Min on the O2<strong>Saturation</strong> channel.5. Record the values for these parameters in the Journal <strong>and</strong> on the data table.6. Use the same techniques employed in <strong>Exercise</strong> 1 to measure <strong>and</strong> record the followingparameters from the Heart Rate channel for the region of data selected:• Maximum Heart Rate, which is the value for Max on the Heart Rate channel.• Minimum Heart Rate, which is the value for Min on the Heart Rate channel.• Mean Heart Rate, which is the value for Mean on the Heart Rate channel.• Change (∆) in Heart Rate, which is the value for Max-Min on the Heart Rate channel.7. Record the values for these parameters in the Journal <strong>and</strong> on the data table.8. Select Save in the File menu.<strong>iWorx</strong> Sample Lab9. Scroll to the other minute marks in all the exercise <strong>and</strong> recovery periods <strong>and</strong> repeat Steps 2through 8.Human <strong>Exercise</strong> – O2<strong>Saturation</strong>-<strong>Exercise</strong> – LabsHE-3-9Copyright <strong>iWorx</strong> Systems Inc.Note: Only for evaluation by prospective customers.
Data Analysis - <strong>Blood</strong> <strong>Pressure</strong>1. Click the Main window icon on the LabScribe toolbar to return to the Main window. Scroll tothe section of the blood pressure data recorded at the end of the first exercise period <strong>and</strong> thebeginning of the first recovery period. Find the data recorded as the pressure in the bloodpressure cuff was being released.2. Use the Display Time icons to adjust the Display Time of the Main window to show the datafrom just before the reappearance of the pulse wave to just after the pulse wave in which thedichrotic notch reappears. This section of data can also be selected by:• Placing the cursors on either side of the required data; <strong>and</strong>• Clicking the Zoom between Cursors button on the LabScribe toolbar to exp<strong>and</strong> the datato the width of the Main window.3. Click on the Analysis window icon in the toolbar or select Analysis from the Windows menu totransfer the data displayed in the Main window to the Analysis window.4. Use the same techniques employed in <strong>Exercise</strong> 1 to measure <strong>and</strong> record the followingparameters from the O2 <strong>Saturation</strong> channel for the region of data selected:• Systolic <strong>Blood</strong> <strong>Pressure</strong>, which is the value for Value1 on the <strong>Blood</strong> <strong>Pressure</strong> channel.• Diastolic <strong>Blood</strong> <strong>Pressure</strong>, which is the value for Value2 on the <strong>Blood</strong> <strong>Pressure</strong> channel.• Pulse <strong>Pressure</strong>, which is the value for V2-V1 on the <strong>Blood</strong> <strong>Pressure</strong> channel.5. Record the values for these parameters in the Journal <strong>and</strong> on the data table.6. Select Save in the File menu.7. Scroll to the other blood pressure recordings made at the ends of the other exercise <strong>and</strong> recoveryperiods <strong>and</strong> repeat Steps 2 through 6.QuestionsAt Rest1. Which subject in the pair had the highest oxygen saturation level?2. Which subject in the pair had the lowest heart rate?3. Which subject in the pair had the lowest blood pressure?In the Light <strong>Exercise</strong> Period4. Which subject in the pair showed the greatest percentage change in oxygen saturation levelfrom the resting level?5. Which subject in the pair showed the greatest percentage change in heart rate from the restingheart rate?6. Which subject in the pair showed the greatest percentage change in blood pressure from theresting blood pressure?<strong>iWorx</strong> Sample LabHuman <strong>Exercise</strong> – O2<strong>Saturation</strong>-<strong>Exercise</strong> – LabsHE-3-10Copyright <strong>iWorx</strong> Systems Inc.Note: Only for evaluation by prospective customers.
In the Vigorous <strong>Exercise</strong> Period7. Which subject in the pair showed the greatest percentage change in oxygen saturation levelfrom the resting level?8. Which subject in the pair showed the greatest percentage change in heart rate from the restingheart rate?9. Which subject in the pair showed the greatest percentage change in blood pressure from theresting blood pressure?Overall10. Does the fitter subject always have the higher oxygen saturation level at rest, the lower oxygensaturation level at any level of exercise, the lower heart rate at rest or exercise, <strong>and</strong> the lowestblood pressures at rest or exercise?11. Determine the maximum heart rate of each subject:Max Heart Rate-Male (BPM) = 220 - Age (Years)Max Heart Rate-Female (BPM) = 226 - Age (Years)For example, the maximum predicted heart rate of a 25 year old woman is 201 beats per minute:226 - 25 = 201BPM12. Which subject in the pair had a heart rate for vigorous exercise closer to his or her maximumheart rate?Table HE-3-L2: O 2<strong>Saturation</strong> Level, <strong>Blood</strong> <strong>Pressure</strong>, <strong>and</strong> Heart Rate at Different <strong>Levels</strong> of<strong>Exercise</strong>.ConditionResting<strong>Exercise</strong> 1,0-1 Min<strong>Exercise</strong> 1,1-2 Min<strong>Exercise</strong> 1,2-3 Min<strong>Oxygen</strong> <strong>Saturation</strong> (%) Heart Rate (BPM) <strong>Blood</strong> <strong>Pressure</strong> (mmHg)Max Min Mean ∆ Max Min Mean ∆ Systolic Diastolic PulseBPClass<strong>iWorx</strong> Sample LabHuman <strong>Exercise</strong> – O2<strong>Saturation</strong>-<strong>Exercise</strong> – LabsHE-3-11Copyright <strong>iWorx</strong> Systems Inc.Note: Only for evaluation by prospective customers.
Recovery 1,0-1 MinRecovery 1,1-2 MinRecovery 1,2-3 MinRecovery 1,3-4 MinRecovery 1,4-5 Min<strong>Exercise</strong> 2,0-1 Min<strong>Exercise</strong> 2,1-2 Min<strong>Exercise</strong> 2,2-3 MinRecovery 2,0-1 MinRecovery 2,1-2 MinRecovery 2,2-3 MinRecovery 2,3-4 MinRecovery 2,4-5 Min<strong>Exercise</strong> 3,0-1 Min<strong>Exercise</strong> 3,1-2 Min<strong>Exercise</strong> 3,2-3 MinRecovery 3,0-1 Min<strong>iWorx</strong> Sample LabHuman <strong>Exercise</strong> – O2<strong>Saturation</strong>-<strong>Exercise</strong> – LabsHE-3-12Copyright <strong>iWorx</strong> Systems Inc.Note: Only for evaluation by prospective customers.
Recovery 3,1-2 MinRecovery 3,2-3 MinRecovery 3,3-4 MinRecovery 3,4-5 Min<strong>iWorx</strong> Sample LabHuman <strong>Exercise</strong> – O2<strong>Saturation</strong>-<strong>Exercise</strong> – LabsHE-3-13Copyright <strong>iWorx</strong> Systems Inc.Note: Only for evaluation by prospective customers.